BITCOIN Will Move Higher! Buy!
Take a look at our analysis for BITCOIN.
Time Frame: 2h
Current Trend: Bullish
Sentiment: Oversold (based on 7-period RSI)
Forecast: Bullish
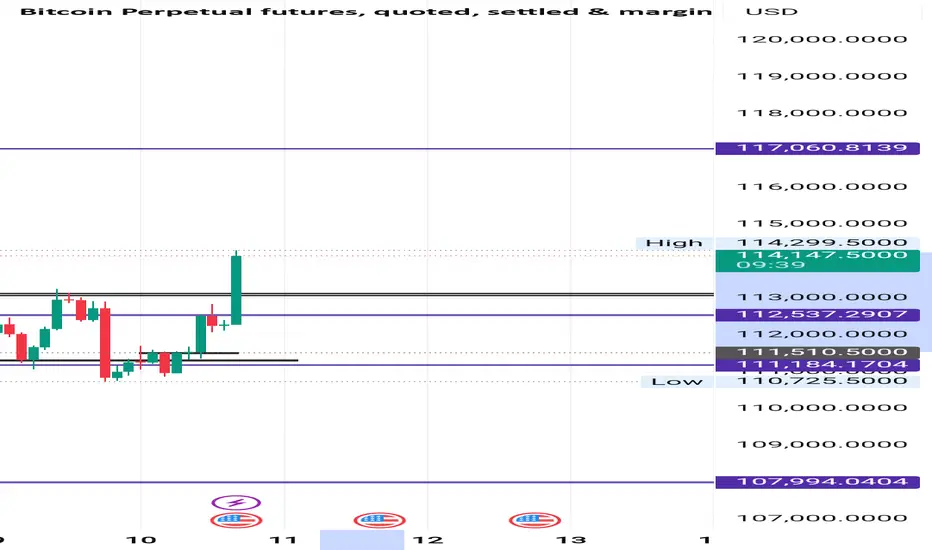
The market is approaching a key horizontal level 114,261.88.
Considering the today's price action, probabilities will be high to see a movement to 115,993.92.
P.S
Overbought describes a period of time where there has been a significant and consistent upward move in price over a period of time without much pullback.
Disclosure: I am part of Trade Nation's Influencer program and receive a monthly fee for using their TradingView charts in my analysis.
Like and subscribe and comment my ideas if you enjoy them!
BTCMINI trade ideas

BTC-USD Trade Insight 📢 NFX Trade Alert – Swing Setup
💹 Instrument: BITSTAMP:BTCUSD Bitcoin (BTCUSD.r)
🛒 Trade Type: Swing – Buy at Market
📍 Entry: $113,750
⛔ Stop Loss: $112,500
✅ Target Profit: $123,000
Analysis:
BTC has reclaimed bullish momentum, forming a bullish flag right above the key ascending triangle breakout level. Price structure remains strong, with buyers stepping in around the $114k zone. These dynamics reinforce our trade bias, keeping the upside toward $123k firmly in play.

BTC/USD Elliott Wave Setup Signals Potential Final Leg UpBTC/USD on the 1-hour chart is showing strong bullish momentum after multiple break of structure (BOS) and change of character (CHOCH) signals. Price respected the order block demand and fair value gap zones, bouncing off the protected low and forming higher highs and lows along a rising trendline. The recent Elliott Wave count suggests wave 3 completed and a corrective wave 4 near completion, setting the stage for a final wave 5 move toward the key target near 115,976. Buyers maintain control, and a continuation toward previous liquidity zones looks probable as long as support near 111,532 holds.
This analysis is for educational purposes only and does not constitute financial advice. Trading involves risks; perform your own analysis or consult a professional before trading.

Bitcoin rises as expected how to trade next?After Bitcoin broke upward out of the descending triangle consolidation zone this time, it did not repeat the "breakout followed by a pullback" trend seen in previous days. In the past, after the price broke through key patterns, it often fell rapidly and returned to the oscillating range; however, after this breakout, the price has remained firmly above the support level at the upper edge of the descending triangle, forming an effective breakout confirmation, and the market's bullish momentum has significantly strengthened compared to before.
For those who followed the strategy to establish long positions near the support level earlier, they have now gained a floating profit of 2,000 to 3,000 points, and the short-term profit target has been initially achieved. From the current technical perspective, the primary resistance level above is concentrated around the 115,000 mark. This level is not only an intensive resistance zone formed by previous transactions but also overlaps with the psychological expectation of integer levels, so a certain amount of selling pressure is likely to occur here. Therefore, it is recommended to consider taking partial profits by closing some positions near this level: on the one hand, it locks in the profits already obtained to avoid profit retracement caused by market pullbacks; on the other hand, retaining some core positions allows you to seize further upward space if the price breaks through the 115,000 resistance level later.
If there are key changes in the market later—such as a breakout of key levels, a significant change in trading volume, or an adjustment in the trend direction—I will update the strategy and notify everyone as soon as possible to ensure that the operation rhythm is synchronized with market changes and help everyone cope with market fluctuations more steadily.

BTCUSD Short
ENTRY 113710.43
SL 115760.85
TP 111660.00
Bitcoin is currently undervalued versus USD and Gold.

BTC/USD – Liquidity Grab Before Downside MoveBTC/USD – Liquidity Grab Before Downside Move
Price is currently setting up for a retracement to the upside, likely sweeping excess liquidity before forming equilibrium. This move will provide the market with balance before continuing lower.
📍 Point of Entry
I’m watching the highlighted zone for a reaction after liquidity is taken. This level offers a potential short setup with strong risk-to-reward.
📉 Bearish Scenario
After the liquidity grab, price is expected to rotate lower and revisit the support zone, aligning with the 4H Fair Value Gap (FVG). This will be the key area to monitor for continuation or a potential bounce.
🔑 Market Outlook
Retracement upward → Liquidity grab.
Downward continuation → Support & 4H FVG retest.
Break below support → Opens further bearish targets.

BTC/USD 4H Chart Review1. Growth channel (orange lines)
• The price moves inside the growing channel.
• Currently testing the upper part of this channel → potential resistance.
2. Horizers of support and resistance (red and green lines)
• Support:
• $ 111 632
• 110 019 $ (key support, breaking down can deny an upward trend).
• resistance:
• $ 113 255 (local, currently tested).
• 115 197 $
• 117 416 $ (strong target resistance in the channel).
3. STOCHASTIC RSI (bottom of the chart)
• The oscillator is in the bribe zone (80-100) → possible short -term withdrawal.
• But - if the upward trend is strong, the indicator may remain in this zone for a long time.
⸻
📊 Scenarios
• Bull (continuation of the trend):
• Benefinage above 113K and a breakdown of 115.2k → opens the road to 117.4k.
• The growth channel acts as a guide - as long as the lower line is maintained, the upward trend continues.
• Bear (correction):
• Rejection from 113–115K with a simultaneous signal with RSI → decrease towards 111.6k.
• If 111.6k falls, the goal is 110k.
⸻
⚠️ Applications
• The short -term market looks bought (Stoch RSI), so the correction cannot be ruled out.
• medium -term - as long as the price stays in the growth canal and above 111K, the advantage is on the buyers' side.
• Key level for observation now: 113K -115K. Breaking up = continuation, jet = correction.

What Could Break Bitcoin's (BTC/USD) Consolidation Phase?Bitcoin (BTC/USD) is consolidating after a sharp pullback from its summer highs, with price currently trading near $113,472. The chart shows a well-defined range between support at $107,300 and resistance at $123,200, suggesting a potential breakout setup in the coming weeks.
Key technical points:
Support and Resistance: Price is holding above the 50-day SMA (114,742) but remains below the recent swing high, keeping BTC in a neutral-to-bullish zone. Stronger support rests at $100,000, where the 200-day SMA also aligns.
Momentum Indicators: The RSI is stabilizing near 51, showing neither overbought nor oversold conditions, while the MACD histogram is flattening, hinting at reduced bearish momentum.
Trend Outlook: Despite recent weakness, the longer-term uptrend remains intact as BTC trades above the rising 200-day SMA. A break above $123,200 would signal renewed bullish momentum and potentially open the way to fresh highs. Conversely, a close below $107,300 risks deeper retracement toward $100,000.
Overall, Bitcoin is in a consolidation phase with buyers defending support. A decisive breakout from this range will likely set the tone for the next major move. -MW

BITCOIN – CLEAN THE LOWS, BEFORE THE SHOWSLadies and gentlemen,
Bitcoin has been trending up today, reaching the PRZ (~114,000). But under the hood, things aren’t as strong as they look. Let’s break it down:
🔎 Data & Orderflow
Open Interest: Spiked heavily during today’s impulsive leg up on the LTF. Since the afternoon (Amsterdam time), perp OI has been climbing.
Aggregated Spot CVD: Diverged bearish during the pump → no real spot demand, rally driven by futures only.
Coin + Stablecoin OI: Both surged as price moved higher → confirming this was perp-driven.
ExoCharts Orderflow: Clear cluster of top longers chasing the breakout. Now, CVD is rolling over into negative territory → signs of exhaustion.
📰 Macro Context
Today’s soft PPI print fueled the move as retail chased longs.
Tomorrow = CPI. The market is leaning bullish after today’s PPI surprise, expecting CPI to also come in soft.
⚠️ If CPI disappoints (comes in hot) → expect a wave down to clean weekend lows before any new leg higher.
🧩 Confluence
Price is sitting at the anchored VWAP (ACWAP) from the 23 June low.
We just touched the tip of an imbalance zone, overlapping with Fibonacci confluence.
Combined with weak spot demand + perp-driven pump → edge leans bearish short-term.
Price is sitting at the local POC.
🎯 My Take
I believe BTC could dip down into the golden pocket, sweeping the lows, before moving back up
Invalidation: Sustained time above 114,500 invalidates this idea and favors continuation higher.
✅ Summary:
Today = perp-driven pump, weak spot demand.
Tomorrow = CPI risk → if it misses, watch for liquidity grab to the downside before the next big move.

BTC Range Breakout Toward 115k+Bitcoin respected the 111k liquidity zone and is pushing higher. Long from 110,997 is in profit.
• Bias: Bullish above 111.5k
• Next targets: 115.5k → 119.6k → 121.8k
• Invalidation: Close below 110.8k

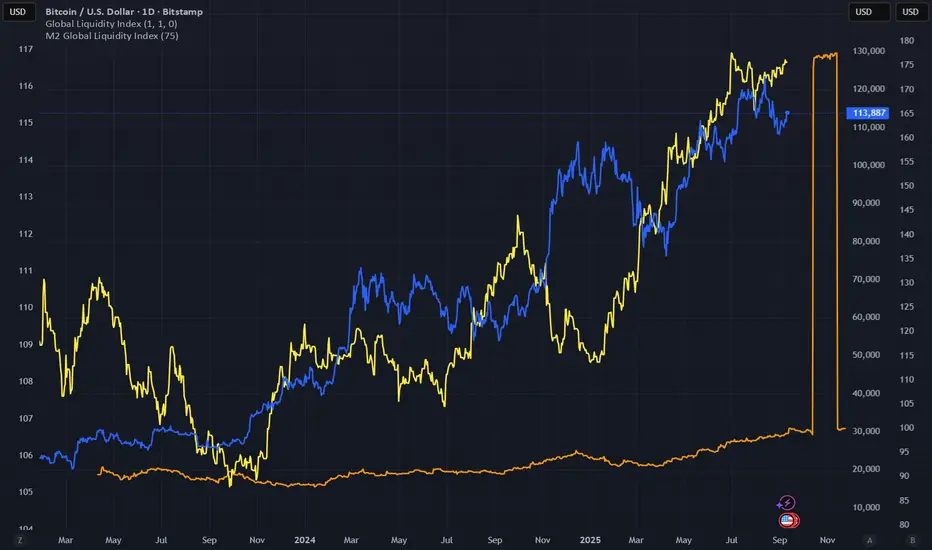
UPDATE: M2 Indicator issue partially fixed!Update: So I was able to get the “Global liquidity index” (yellow) indicator to show accurately by selecting all inputs EXCEPT “JPM2” (Japan money supply).
I then tried any other indicators starting with “M2” for overlap and experimental purposes to see what the exact issue was and the glitch comes back as seen in my original post (yesterday).
There is really weird "jump" and "pull back".
Is something wrong with the Japan money supply – JPM2 – input?
I used the “M2 Global liquidity Index – Time Shift – KH – KrystianHutyra” – in ORANGE to reference against the correctly working indicator and it showed the same issue from yesterday.
Could this indicator (ORANGE) be linked to the JPM2?, I cannot change inputs on it as there are none, on offset the time.
Thank you.
$BTC bitcoin short ideaeveryone calling for BTC ath again with this move maybe im crazy but worth a try ! gl and safe fallow X for more updates !

BITCOIN TRADE ALERT📢 NFX Trade Alert – Swing Setup
💹 Instrument: BITSTAMP:BTCUSD Bitcoin (BTCUSD.r)
🛒 Trade Type: Swing – Buy at Market
📍 Entry: $113,750
⛔ Stop Loss: $112,500
✅ Target Profit: $123,000
Analysis:
BTC has reclaimed bullish momentum after holding above key short-term support. Current price structure suggests strength, with buyers stepping in around the $113k zone. A break and hold above $114k increases the probability of continuation toward the $123k resistance level.
Risk is defined with a tight stop at $112,500 to protect capital if momentum fails. This setup offers a favorable risk-to-reward ratio for swing traders.
Share your thoughts in comment below

Another upside breakout—can this rally continue?Bitcoin has broken upward again. However, for those who haven't entered the market yet, there's no need to rush into chasing the rally. Looking back at the characteristics of recent market trends, after the price made multiple breakout moves, it has been difficult to sustain the upward momentum, often followed by a rapid pullback. Blindly chasing high prices can easily leave you in a passive situation of being trapped in the short term.
As for those who have already established long positions near key support levels in line with the previous strategy, there's no need to adjust your positions frequently at present—just continue to hold firmly. From a technical perspective, if this breakout can effectively hold above the key resistance level, the subsequent upside potential of the market will be far beyond the current minor fluctuations. The short-term consolidation is more like a period of momentum accumulation before the trend begins. It is recommended that everyone stay patient, hold onto your positions well, and give the market sufficient time to develop—"let the bullets fly for a while."
I'm Matthew, an analyst focused on technical analysis. If you have any questions regarding specific operations or trend judgments, feel free to communicate and discuss with me at any time. Let's learn trading logic together and move forward steadily in the market!

BTC : After retesting the 2024 peak, the price is showing signs BTC :
After retesting the 2024 peak, the price is showing signs of opening a strong bullish trend.

Bitcoin forecast Hi traders. We have an Engulf below of chart. It's sign of market direction. We can expect specified scenario

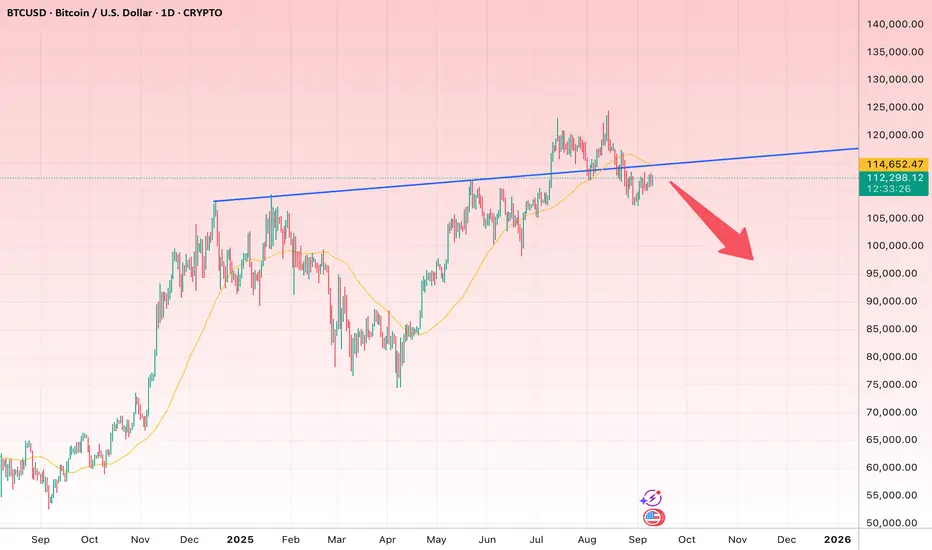
Bitcoin Breakdown Ahead? Why the $100K Level Is Back on the TablTechnical Analysis of Bitcoin (BTC/USDT) – Daily Chart
1. Trendline (Key Resistance):
o A major ascending trendline (blue) that previously acted as a strong resistance has once again turned into dynamic resistance.
o After a failed breakout above this trendline, price slipped back below it — a clear sign of weakening bullish momentum.
2. Moving Average (MA50):
o The 50-day moving average is visible on the chart.
o Bitcoin is currently trading below this MA, which strengthens bearish pressure in the short term.
3. Market Structure:
o After topping around $131,700, BTC entered a corrective phase.
o Lower highs and lower lows are gradually forming, pointing to the emergence of a short-term downtrend.
4. Bearish Signals:
o Failed retest of the broken trendline.
o Price rejection near the MA50.
o A potential bearish divergence (if checked with RSI).
o The red arrow on the chart suggests further downside pressure.
5. Key Levels to Watch:
o Resistance Zone: $114,500 – $118,000 (trendline + MA50).
o First Support: $100,000 – $103,000.
o Second Support: $95,000 – $97,000.
o Critical Support: $90,000.
6. Possible Scenarios:
o If Bitcoin fails to reclaim and hold above $114,500 – $118,000, the path toward $100K and even $95K remains open.
o A decisive breakout and strong close above $118K would invalidate the bearish bias and could trigger another rally toward the $130K region.
Conclusion:
At this stage, Bitcoin is showing more bearish than bullish signals. The failed breakout above the trendline and rejection below the MA50 increase the probability of a deeper correction. Unless BTC regains strength above the $114.5K–$118K resistance, downside targets at $100K and $95K look more likely.
Bitcoin Bitcoin Bullish Outlook
Bitcoin (BTC) is currently showing strong upward momentum, reflecting a positive market sentiment.
Technical Highlights:
Support Levels: BTC has shown resilience around key support near $107,000, indicating strong buying interest.
Breakout Confirmation: A decisive close above $111,600 would confirm bullish momentum, with potential targets near $113,500.
Market Breadth: The Bullish Percent Index for Bitcoin indicates a positive phase, suggesting the trend could continue upward.

Elementary TA - Cup & HandleIn pure return % from the 2022 bottom (+330%) ; following 'Cup & Handle' TA guidelines, the +330% yields a future CRYPTOCAP:BTC price near the $300k mark...
Using the drawdown % from the 2021 ATH (-76.5%) and applying the same 'Cup & Handle' methodology, we have a more sober target of +76.5% from ~$70k and yield a future CRYPTOCAP:BTC price of $125k...
God speed

BTCUSD 2H SetupCurrently watching price action at the 50% Fibonacci retracement, which is aligning with the 4H Fair Value Gap (FVG).
Scenario 1 (Sell Bias): If price respects this level and confirms rejection on the lower timeframes, I’ll be looking to sell, targeting the next liquidity zone/support below.
Scenario 2 (Buy Bias): If price breaks above the resistance zone and gives a clean retest, I’ll switch bias to long and ride it up to the next resistance level.
At the moment, I’m waiting for confirmation before execution.

BTC at a Crossroads: $114k Break or Retest $110k?BTC at a Crossroads: $114k Break or Retest $110k?
Bitcoin (BTCUSD) experienced a significant downtrend throughout mid-August, eventually finding robust support around the $108,000 level. This price action formed a "Double Bottom" pattern, which is a classic bullish reversal indicator, suggesting a potential shift in market mo-mentum.
Following this bullish reversal, BTC has initiated a recovery, currently navigating within an ap-parent ascending channel. It is now actively testing immediate resistance at the $114,000 mark, having recently demonstrated strength by bouncing off solid support established near $110,000.
Should Bitcoin successfully break and hold above the $114,000 resistance, the next substantial area of overhead supply and a critical psychological barrier is identified between $118,000 and $120,000. This zone would represent the next major hurdle for continued upward movement.
A definitive breakout above $114,000 to confirm sustained bullish momentum, or a rejection that could lead to a retest of the $110,000 support, potentially dictating the short-term direction.
Disclaimer:
The information provided in this chart is for educational and informational purposes only and should not be considered as investment advice. Trading and investing involve substantial risk and are not suitable for every investor. You should carefully consider your financial situation and consult with a financial advisor before making any investment decisions. The creator of this chart does not guarantee any specific outcome or profit and is not responsible for any losses incurred as a result of using this information. Past performance is not indicative of future results. Use this information at your own risk. This chart has been created for my own improvement in Trading and Investment Analysis. Please do your own analysis before any investments.

BTC Sell IdeaAfter reaching new all-time highs, there’s often a period of profit taking. Many early investors or institutional buyers might choose to cash out, triggering selling pressure and driving the price lower. If the sentiment shifts from greed to fear, it could accelerate the price decline.
