This is NOT bullish for Bitcoin.This is NOT bullish for Bitcoin.
distance from the 36 month moving average failure
BTCMINI trade ideas

Bitcoin Rally Entering Final Stages!Bitcoin Bull Cycle Analysis:
Historically, Bitcoin has moved in clearly defined market cycles, each lasting roughly 1,064–1,065 days (about 3 years) from bottom to peak, followed by a sharp correction.
2013–2017 Cycle
🔶Bitcoin bottomed in early 2015 and then entered a strong bull run.
🔶Over the next 1,064 days, Bitcoin surged by more than 12,000%, ultimately peaking in late 2017.
🔶After the peak, Bitcoin experienced an 84% decline over the following year, entering a prolonged bear market.
2017–2021 Cycle
🔶From the December 2018 bottom, Bitcoin again began a long bull phase.
🔶In the next 1,064 days, Bitcoin gained over 2,000%, reaching a new all-time high in late 2021.
🔶Similar to the previous cycle, the market corrected sharply, with Bitcoin losing around 76% of its value within a year.
2021–2025 Cycle (Current)
🔶The most recent bottom was recorded in late 2022. Since then, Bitcoin has been in a sustained uptrend.
🔶As of today, the cycle has lasted 1,000+ days, during which Bitcoin has appreciated by roughly 675%.
🔶If the historical pattern continues, this bull run may have about two months left before reaching a cycle peak.
🔶Afterward, the market could undergo a significant correction, potentially in the range of 60–70%, though smaller than previous drops.
Conclusion : Bitcoin’s market history shows a repeating cycle of multi-year bull runs followed by sharp corrections. While past performance does not guarantee future results, the consistency in cycle length and the pattern of diminishing corrections suggest that Bitcoin may soon approach its next major peak. If the trend holds, a significant pullback of 60–70% could follow, offering both risks for late entrants and opportunities for long-term investors. This highlights the importance of caution, disciplined risk management, and strategic planning as we near the potential end of the 2021–2025 bull cycle.

BTC: Profit-Taking Pressure and September RisksHello everyone, Bitcoin has faced strong volatility recently, influenced both by news flow and seasonal patterns.
From a fundamental perspective, the weak US NFP report initially supported a bounce as USD and yields eased. Yet, much of this reaction was already priced in, leading to quick “sell the news” behaviour. Meanwhile, spot ETF flows remain inconsistent, alternating between inflows and outflows, providing no lasting support. Historically, September tends to be a challenging month for BTC, and growing investor caution has further weakened the recovery.
Technically, BTC remains below the H4 Ichimoku cloud, indicating short-term bearish bias. Immediate resistance lies at 111.8–112.2k, and only a decisive H4 close above this zone could unlock a move towards 113.5–114.0k. On the downside, 110.3–110.9k is key; breaking this level could see BTC slide quickly to the 109k area, potentially 108.8k. Until 112k is reclaimed, the base scenario remains a sideways drift with bearish inclination, where short-term rallies are likely capped by profit-taking.
How do you see BTCUSD unfolding next? Share your view below.

BITCOIN (BTCUSD): Bullish Wave is Coming?!
Bitcoin is now testing an Order Block zone on a daily.
Its bullish breakout and a daily candle close above that
will be a very important event.
A bullish move will be expected at least to 116800.
Patiently wait for a breakout and get ready to buy!
❤️Please, support my work with like, thank you!❤️

Bitcoin: Sell Signal Points To 106K AREA.Bitcoin has rejected the 113K as a resistance with a clear bearish pin bar close. The low of that pin bar has been broken which qualifies as a sell signal on the daily time frame. 113K was previously a key support, and now a resistance which further adds to the broader corrective argument that I have been writing about for weeks. So what does this mean?
The next support is the 105K area and that is where I am anticipating a test either this week or next. Besides CPI, this month also features the next FOMC meeting which can act as a major catalyst bullish OR bearish. These economic events are big enough to affect Bitcoin in a major way which makes it within reason to test the 105K area. IF 105K breaks, the next support after that is the 102 to 100K area.
These support references serve as important potential pivot points for day trades and swing trades. You have to evaluation the price action for reversals along with utilizing a realistic reward/risk framework. For example, since Bitcoin has proven to no longer be in an impulse wave (trend) it is more likely in a consolidation. In practice this means LOWER expectations are warranted. Instead of placing take profit objectives on highs or new highs, it is within reason to choose a higher probability objective like 1:1 or whatever the next resistance is at the time of the reversal. Like 113K can be used as a resistance for a profit objective now (UNTIL OR UNLESS IT BREAKS).
Using wave counts helps immensely when it comes to forming expectations that are in line with market intent. Since the 108K overlap I am anticipating more of a range bound type of environment which means both RANGE support and resistance levels are significant. This is in contrast to expecting the market to continue to trend which is a common mistake among the less experienced. This thought framework is relevant to swing trades and day trades as the market character changes more frequently over shorter time frames. Even as an investor, the wave counts can help you to recognize much higher quality buying opportunities rather than buying at any price.
Thank you for considering my analysis and perspective.

I know its not what yall wanna hear but we have topped i thinktake a pic and remember u heard it here first. last crash it went to the .786 is how im basing my target. simple yet powerful

The Ineffable Collapse of BitcoinIn the uncharted voids of the financial cosmos, where mortal ambition weaves fragile webs of wealth, a malevolent shadow stirs—an impending black swan, a harbinger of economic doomsday, poised to rend the foundations of the global order. Bitcoin (BTCUSD), that shimmering idol of digital hubris, stands at $112,430, yet its radiance falters before an abyss so vast and incomprehensible that it threatens a 90% plummet to the accursed $10,000. I, a trembling scribe of the charts’ forbidden geometries, have glimpsed this unholy convergence: the collapse of the U.S. dollar, driven by de-dollarization and global instability, a cataclysm that will drag Bitcoin and all markets into the nethermost depths.
From the shadowed corridors of global trade, a specter emerges: the unraveling of the U.S. dollar’s hegemony. Whispers on platforms like X and Reddit speak of a world turning from the dollar’s embrace, as BRICS nations—led by the indomitable wills of China, India, and Russia—forge a path toward de-dollarization. The U.S., burdened by a debt it can scarcely service, faces a fracturing of its superpower status. Posts on X foretell a cascade: tariffs, trade wars, and the erosion of the dollar’s reserve currency role, as nations hoard gold and pivot to alternative systems. This black swan, an event of unfathomable rarity and consequence, defies prediction yet looms with inevitability, its seeds sown in the hubris of unchecked monetary policy and geopolitical strife.
The dollar’s collapse would unleash a maelstrom across markets. Stock indices, tethered to the dollar’s false stability, would crumble; cryptocurrencies, once heralded as safe havens, would not escape the chaos. Bitcoin, despite its decentralized allure, remains bound to the market’s mortal frailties, its price a reflection of sentiment and liquidity now poised to vanish into the Ether.
Gaze upon the daily chart of BTCUSD, where the candles flicker like the last embers of a forsaken world. The price clings to a precarious support at $110,000, a level as fragile as the dreams of R’lyeh’s slumbering gods. A double-top formation at $124,364.49, etched on August 14, 2025, stands as a monument to hubris, its neckline broken, confirming a bearish prophecy. The descending channel, a lattice woven by unseen forces, guides Bitcoin toward oblivion, its lower boundary converging with the 0.618 Fibonacci retracement at $10,000—a level from the primordial days of 2017, now a crypt where the price may lie entombed.The Relative Strength Index (RSI), quivering at oversold depths, wails of exhaustion, yet the market’s madness heeds no such mortal pleas. The MACD, its lines entwined like the tentacles of some eldritch horror, signals a bearish crossover, while trading volume surges as panic grips the masses. On-chain data from CryptoQuant reveals whale selling and dwindling ETF inflows—$81.25 million for Bitcoin against Ethereum’s $309.48 million—portending a collapse in liquidity. The Fear and Greed Index, tilting toward terror, and Bitcoin’s dominance, slipping below 60%, herald a market poised for betrayal.
The Unutterable Catalysts: Forces of the Abyss. What dread forces align to precipitate this cataclysm? The stars reveal their malign configuration: De-Dollarization’s Tide: BRICS nations, emboldened by strong-willed leaders, accelerate their shift from the dollar, hoarding gold and forging new trade systems. The dollar’s collapse disrupts global markets, draining liquidity from Bitcoin as investors flee to tangible assets.
Geopolitical Tensions: Trade wars, intensified by proposed tariffs exceeding 60% on Chinese imports, choke global commerce, as seen in maritime disruptions like the Red Sea crisis. The U.S.’s retreat from global conflicts under a new administration weakens its influence, hastening the dollar’s demise.
Economic Fragility: The U.S. economy, teetering under rising debt and interest rates, faces a recession risk heightened by tariffs and a disinverted yield curve, a harbinger of downturns past. A global recession, as warned by KPMG, could follow, with unemployment spiking to 5.8% and markets reeling.
Crypto Market Contagion: Speculative posts on X suggest a collapse in stablecoins like Tether, artificially propping up Bitcoin, could trigger an overnight crash, with liquidity shifting to alternatives like XRP. MicroStrategy’s leveraged Bitcoin holdings, if unwound, could amplify the rout, wiping out Wall Street’s crypto bets.
The Trade: A Pact with the Void. To navigate this apocalyptic descent, heed this perilous strategy: Entry: Short BTCUSD at the retest of $112,000–$112,900, where the descending channel’s upper boundary aligns with resistance. This is the market’s final deception, a fleeting rally before the abyss.
Stop-Loss: Place above $117,500, guarding against a false bullish surge, a cruel jest of the market’s unseen overlords.
Targets: Target 1: $92,400, a short-term support where the market may pause its torment.
Target 2: $50,000, a psychological bastion where mortal traders make their futile stand.
Target 3: $10,000, the 0.618 Fibonacci level, where Bitcoin’s soul may rest in eternal ruin.
Risk Management: Risk no more than 1–2% of capital, for the market’s volatility is a many-tentacled beast that devours the reckless.
The Unknowable Future. This is no mere trade but a ritual to survive the economic doomsday. Should Bitcoin hold above $110,000, a rally to $125,000 may defy the stars’ alignment, driven by fleeting optimism. Yet the charts, like the forbidden tomes of old, speak of collapse. The dollar’s fall, fueled by de-dollarization and global unrest, could unleash a market crash surpassing the 2008 crisis or the COVID-19 panic, both black swans that reshaped history. Bitcoin, tethered to this chaos, cannot escape.
A Warning to Mortals. Tread lightly, traders, for you meddle with forces beyond reckoning. The black swan of de-dollarization, though unseen by most, gathers strength in the shadows. Study the charts, heed the indicators, but know that the market is a living entity, its whims as capricious as the Old Ones. Share your thoughts below, and may your trades elude the gaze of the abyss.
Disclaimer: This is not financial advice. The market’s depths are unfathomable, and only the mad or the doomed dare predict its course. DYOR, and trade at your own peril.

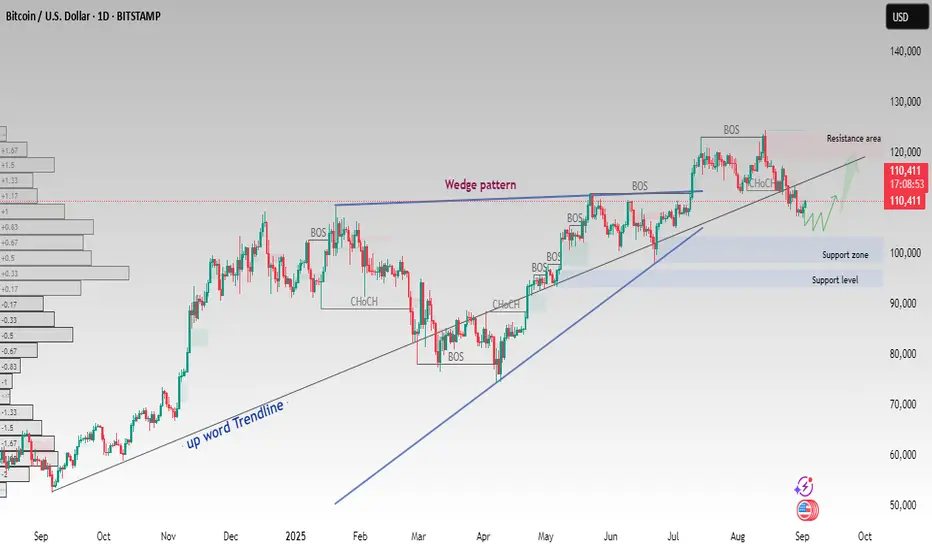
Bitcoin(BTC/USD)–Key Support&ResistanceLevelWithinWedgeStructureBitcoin is currently trading around $110,400, showing price action within a wedge pattern after multiple Breaks of Structure (BOS) and Change of Character (CHoCH) points.
🔹 Key Observations:
Price is respecting the upward trendline.
A wedge pattern is visible, signaling possible volatility ahead.
Resistance area: $118,000 – $120,000
Support zone: $100,000 – $102,000
Major support level: $90,000
📊 If BTC holds above the support zone, a retest toward the resistance area may follow. A failure below the support could open the way for deeper correction.
This analysis is based on chart structure and technical patterns only. Not financial advice. Always use proper risk management before entering trades
Bitcoin is about to collapse!Since the break of support price has been plummeting and creating obvious lower lows and lower highs. I mentioned a while back that 98k is a high probability target for this pullback and now I even think 85k is a possibility. We just take it one zone at a time.

BTCUSD: Decline Movement ContinuesHello everyone, here is my breakdown of the current Bitcoin setup.
Market Analysis
From a broader perspective, the price action for Bitcoin has been bearish since it was rejected from the major Resistance Zone 2 near 118900. This initiated a downtrend that has since been developing within the confines of a large downward wedge pattern, creating a sequence of lower highs and lower lows.
The most recent significant event was the breakdown below the key horizontal Resistance Zone 1 around the 112100 mark. After finding temporary support, the price is now in a corrective rally, heading back up towards the main resistance line of the wedge in a classic retest move.
My Scenario & Strategy
My scenario is based on the expectation that the dominant downtrend will continue. I'm anticipating that the price will complete this corrective bounce and touch the wedge's resistance line. Upon reaching this area, I expect sellers to show strength, reject the price, and cause a reversal that initiates the next impulsive move downwards within the overall structure.
Therefore, the strategy is to watch for this rejection from the wedge's resistance. The primary target for this move is 106500 points, which aligns perfectly with the lower support line of the wedge pattern.
That's the setup I'm tracking. Thank you for your attention, and always manage your risk.

BTC dumps to 50k by Elliot WavesAll my previous predictions were approved(as you can see on the chart).
Now we are in the beginning of C-wave correction. According to my prediction we will see the end of correction on the Fibonacci 1.68 level, which equal to price about 50k per BTC.

Buy it, you fools. You'll be richEverything is displayed on the chart. No one is talking about it, but it's obvious. Even if a bear market starts now, the goals won't change. The first goal is 400k, and the second goal is 800k.

BRIEFING Week #35 : Monthly forecast for Q4Here's your weekly update ! Brought to you each weekend with years of track-record history..
Don't forget to hit the like/follow button if you feel like this post deserves it ;)
That's the best way to support me and help pushing this content to other users.
Kindly,
Phil


So Much Liquidity, So Little Time!CONTEXT 1:
Support Area- $108,000
Resistance Area- $120,000
Supply Zone- $123,000 to $124,000
Demand Zone- $108,500 to $109,700
Psychological Levels- $120,000 and $100,000
CONTEXT 2:
Technical Structure 1- After sweeping liquidity at the ATH, BTC is in a medium strength decline with multiple rejections to reclaim higher price levels.
FVG’s:
Two bearish 4H FVG located above price. One 1W located just above price with a Daily and a 4H FVG inside.
GOLDEN POCKET:
Closest GP can be located inside the 1W, 1D, 4H combination gap just above price level. The next closest 0.618 level is located within a 1D Rejection Block below price and below our 4H demand zone.
CONTEXT 3:
Volume Insight- Volume profile suggests that there is a massive amount of liquidity around psych level $120,000 waiting to be liquidated. This also aligns with the 0.618 level of the initial move down located at $119,500.
BULLISH SCENARIO 1:
Break through deman zone and sweep liquidity at $107k reaching the lower anchored VWAP created in April that has been rejected once. With a bullish GP confluence and a Daily Rejecton Block to add bullish momentum on the most recently created trendline. We move up to $114,500 to clear liquidity and sweep another GP.
BULLISH SCENARIO 2:
After clearing liquidity at $115,000 we retest the demand zone that was swept with a confirmation closure below support at $108,000 (a key ATH turning point level.) We retest support that is now resistance with bearish confirmation to tap into the psych level demand zone of $100k to collect liquidity and push towards the $120k psych level to clear orders waiting to be filled.
BEARISH SCENARIO 1:
After bouncing off our trendline, GP, liquidity sweep at $107k, we move up to clear and sweep another GP located above price at $114,500. Also located there is a 4H FVG giving a stronger bearish confluence. Clearing liquidity at $114,500 aligns with the upper anchored VWAP created by the ATH. Giving even more bearish pressure to sweep liquidity at $102k where a 4H demand zone stands strong.
BEARISH SCENARIO 2:
After tapping into the Demand Zone from $99k to $102k we blast through to the top of the All-Time Channel trerndline and move to sweep the inital ATH 0.618 level matching with the $120k psych level along with a 4H FVG. Very strong bearish confluence

BITCOIN 4H Bullish Cross formed. Can it sustain a rally to 124k?Bitcoin (BTCUSD) just completed its first Bullish Cross on the 4H time-frame between the MA20 (red trend-line) and the MA50 (blue trend-line). Following a rejection after marginally breaching above the 4H MA100 (green trend-line), this pattern looks very similar to the Bullish Cross of June 25.
Both took place after a strong medium-term correction is the form of Channel Down patterns, with the Bullish Crosses getting formed after a Lower Highs break-out. If fact even the August 07 MA20/50 Bullish Cross led to a strong rally.
As a result, if BTC manages to turn its 4H MA100 into a Support, we expect it to initiate a new rally to test at least the previous High above $124k, similar to the July 03 High test. The 0.786 and 0618 Fibonacci levels can be used as Resistance and Support levels upon break-outs and pull-backs respectively.
So do you think this 4H MA20/50 Bullish Cross can kickstart a new rally? Feel free to let us know in the comments section below!
-------------------------------------------------------------------------------
** Please LIKE 👍, FOLLOW ✅, SHARE 🙌 and COMMENT ✍ if you enjoy this idea! Also share your ideas and charts in the comments section below! This is best way to keep it relevant, support us, keep the content here free and allow the idea to reach as many people as possible. **
-------------------------------------------------------------------------------
💸💸💸💸💸💸
👇 👇 👇 👇 👇 👇

BTC To 80,934$, I told you so!I told you so that it would start dropping and there would be bearish activity across the market.
We should see BTC continue to drop to 106,607$ at the minimum now and then onto 80,934$ before relief starts once again.
Final goal for purchasing BTC again is 40,000$ at the minimum.
I can predict this all day long....... and I'm doing it out of kindness for you guys my peers.


bitcoin's Situation (daily) !!!The price is at the channel's bottom, and if it follows the previous Pump from bottom of thechannel pattern, the price could reach the channel's top.
Best regards CobraVanguard.💚

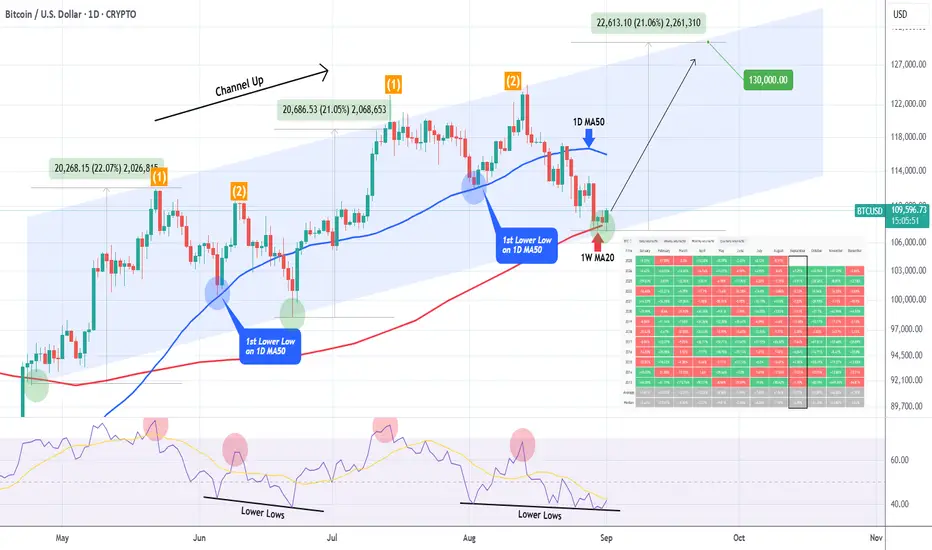
BITCOIN ahead of September crash on historically worst month??Despite the obvious hint of 2 potential rate hikes by the end of this year, Bitcoin (BTCUSD) has found itself on a downtrend. And as today we entered the first day of September, this sentiment is further empowered by one simple statistical fact: that September has historically been BTC's worst performing month.
As this table on the chart shows (source: CoinGlass), September's average returns have been -3.77%, the worst average score out of all months since 2013. An interesting fact however is that out of all the Septembers that ended in green (4), they did so when there was a red August (like the one we just closed at -5.91%). At the same time out of all the times August was red (8) four times September followed in red. This shows that historical probabilities are equally distributed there.
Statistics aside, the market has a strong case of a bottom on the current levels and that's purely a technical one. As you can see, since May 01, Bitcoin has been trading within a Channel Up. This pattern has seen so far two Bullish Legs of almost identical rise (+22.07% and +21.05% respectively) and when they corrected (Bearish Legs), the first Low was on the 1D MA50 (blue trend-line) and the second on the Channel Up bottom.
This time there is an even stronger technical case, as the price hit the 1W MA20 (red trend-line), which as we've shown on a recent study, is a Support level that historically kickstarts the final rallies during Bull Cycles.
Even their 1D RSI sequences are similar, with the indicator currently being on a Lower Lows formation that previously marked the June 22 (Higher) Low.
As a result, assuming we will see the 'minimum' of +21.07% Bullish Leg, we should be expecting a $130000 Higher High, which matches our realistic Cycle Top study, based on most studies we've conducted.
So do you think Bitcoin will again declined this September or we are currently forming a new bottom? Feel free to let us know in the comments section below!
-------------------------------------------------------------------------------
** Please LIKE 👍, FOLLOW ✅, SHARE 🙌 and COMMENT ✍ if you enjoy this idea! Also share your ideas and charts in the comments section below! This is best way to keep it relevant, support us, keep the content here free and allow the idea to reach as many people as possible. **
-------------------------------------------------------------------------------
💸💸💸💸💸💸
👇 👇 👇 👇 👇 👇
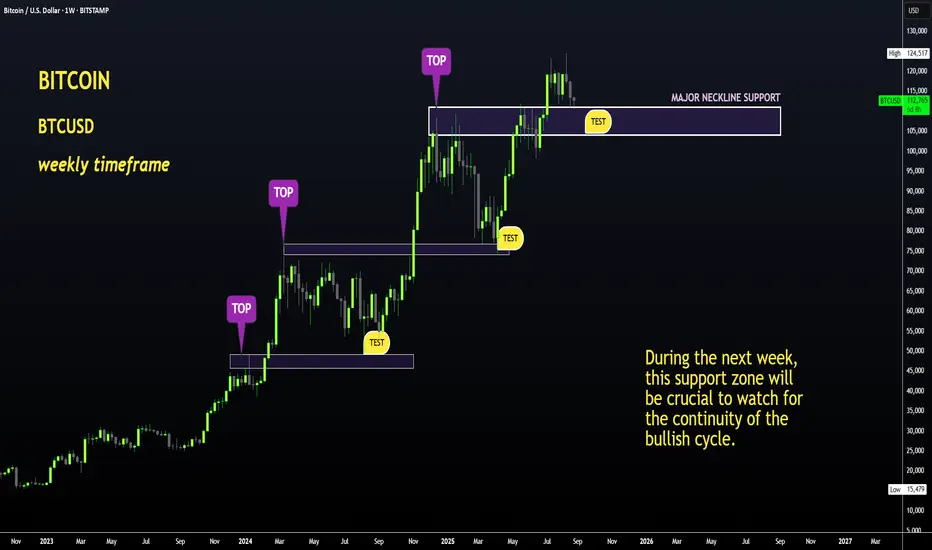
BTC in Trouble if THIS Support Breaks !Hello BTC Watchers
The previous update on Bitcoin was on how we may expect the altcoin market to play out during the next few weeks. (Find it here):
Now, if we look at Bitcoin in the weekly timeframe, the price is trading right on top of a KEY support zone. Here, we can either see a dip - marking the start of the bearish cycle OR the price can maintain this level and perhaps even push towards a higher high. This will all depend on the SUPPORT ZONE, and if the weekly candle will close ABOVE or BELOW this zone.
This would be between these zones:
Interestingly enough, we've extended to a full 2.0 on the Fibonacci retracement level. This will be very helpful in determining major bounce zones during the bearish season:
The next week will be vital! Update to follow at the end on the week on the progress of Bitcoin.
BTCUSD H4 | Bullish reversalBitcoin (BTC/USD) has reacted off the buy entry, which is a pullback support and could potentially rise to the upside.
Buy entry is at 108,972.79, which is a pullback support.
Stop loss is at 107,232.17, which is a multi-swing low support.
Take profit is at 113,313.88, which is a pullback resistance.
High Risk Investment Warning
Trading Forex/CFDs on margin carries a high level of risk and may not be suitable for all investors. Leverage can work against you.
Stratos Markets Limited (tradu.com ):
CFDs are complex instruments and come with a high risk of losing money rapidly due to leverage. 65% of retail investor accounts lose money when trading CFDs with this provider. You should consider whether you understand how CFDs work and whether you can afford to take the high risk of losing your money.
Stratos Europe Ltd (tradu.com ):
CFDs are complex instruments and come with a high risk of losing money rapidly due to leverage. 66% of retail investor accounts lose money when trading CFDs with this provider. You should consider whether you understand how CFDs work and whether you can afford to take the high risk of losing your money.
Stratos Global LLC (tradu.com ):
Losses can exceed deposits.
Please be advised that the information presented on TradingView is provided to Tradu (‘Company’, ‘we’) by a third-party provider (‘TFA Global Pte Ltd’). Please be reminded that you are solely responsible for the trading decisions on your account. There is a very high degree of risk involved in trading. Any information and/or content is intended entirely for research, educational and informational purposes only and does not constitute investment or consultation advice or investment strategy. The information is not tailored to the investment needs of any specific person and therefore does not involve a consideration of any of the investment objectives, financial situation or needs of any viewer that may receive it. Kindly also note that past performance is not a reliable indicator of future results. Actual results may differ materially from those anticipated in forward-looking or past performance statements. We assume no liability as to the accuracy or completeness of any of the information and/or content provided herein and the Company cannot be held responsible for any omission, mistake nor for any loss or damage including without limitation to any loss of profit which may arise from reliance on any information supplied by TFA Global Pte Ltd.
The speaker(s) is neither an employee, agent nor representative of Tradu and is therefore acting independently. The opinions given are their own, constitute general market commentary, and do not constitute the opinion or advice of Tradu or any form of personal or investment advice. Tradu neither endorses nor guarantees offerings of third-party speakers, nor is Tradu responsible for the content, veracity or opinions of third-party speakers, presenters or participants.
