BITCOIN Is this the last rally of the Cycle??Bitcoin (BTCUSD) has held its 1W MA20 (red trend-line) to perfection and closed last week in green for the first time after 3 straight red 1W candles.
As discussed in previous analyses, the 1W MA20 is critical to BTC's bullish trend as it is the trend-line that supported every final parabolic rally on its previous Cycles.
Even on the current Bull Cycle, it has been the first (and main) level of Support during the entirety of the 3-year Channel Up. The second one is the 1W MA50 (blue trend-line) and was the ultimate Buy Signal on all three occasions it was hit (or approached), which coincided with a 0.382 Fibonacci retracement test.
Since the last contact the market had with both the 1W MA50 and 0.382 Fib (April 07 2025 Low), Bitcoin has been trading within the Channel's 0.236 - 0.618 Fibonacci range, which is the zone that has dominated the price action for most of the Bull Cycle. It broke below or above it 4 times, twice below it in the early stages of the Channel Up and as the Cycle's strength accelerated, twice above it to form Higher Highs.
Those Higher Highs have been the mid-Cycle 'Profit taking Zones' (red Triangles), where traders/ investors were encouraged to book quarterly profits and wait for a lower buy opportunity o the 1W MA50/ 0.382 Fib Support Cluster.
Once again, this is were we expect this upcoming final BTC rally to peak. Technically, even if we see a highly aggressive rise starting now, this Zone should be at $140k and above. Profit taking is a personal matter to each trader, depending on their risk tolerance and how low/ soon they entered the market, but this chart can serve as a reminder on their profit taking strategy.
So are you booking your profits soon for this Cycle? Feel free to let us know in the comments section below!
-------------------------------------------------------------------------------
** Please LIKE 👍, FOLLOW ✅, SHARE 🙌 and COMMENT ✍ if you enjoy this idea! Also share your ideas and charts in the comments section below! This is best way to keep it relevant, support us, keep the content here free and allow the idea to reach as many people as possible. **
-------------------------------------------------------------------------------
💸💸💸💸💸💸
👇 👇 👇 👇 👇 👇
BTCMINI trade ideas

BTCUSD – Trendline Breakout with Bullish Continuation SetupBitcoin has broken out of the perfect 4H descending channel and is now showing strong bullish structure after a clean Break of Structure (BOS). Price is currently retesting the breakout zone, which aligns with the demand area around 112,000 – 114,000 USD.
As long as price holds above this demand zone, we can expect a potential continuation towards the resistance area at 124,000 USD. A pullback to support before another leg higher would provide a strong confirmation for buyers.
📌 Key points:
Trendline and channel breakout confirmed ✅
BOS & Change of Character (CHoCH) align with bullish bias 📈
Demand zone (112,000 – 114,000) acting as potential entry area
First major resistance around 124,000 USD
This is not financial advice. Always manage your risk properly and trade according to your plan.

Bitcoin - Will Bitcoin break out of range?!Bitcoin is above EMA50 and EMA200 on the four-hour timeframe and is in its ascending channel. If the downward trend continues towards the specified demand range, we can buy Bitcoin with appropriate risk-reward.
Bitcoin’s rise to around 121,000 and its arrival at the specified supply range will provide us with its next selling position. It should be noted that there is a possibility of heavy fluctuations and shadows due to the movement of whales in the market and capital management in the cryptocurrency market will be more important. If the downward trend continues, we can buy within the demand range.
Bitcoin continues to fluctuate within the $110,000 to $117,000 range, as reduced capital inflows into ETFs combined with intensified profit-taking exert mounting pressure on its upward momentum. In this environment, the derivatives market—driven by the strong presence of futures and options contracts—plays a central role in balancing and shaping market direction. Profit-taking by 3–6 month holders, alongside losses realized by recent buyers at price peaks, has fueled selling pressure across the market.
On-chain liquidity still maintains a constructive structure, but signs of gradual weakening are evident. Meanwhile, net ETF inflows and outflows have declined to around 500 BTC per day, significantly undermining demand from traditional finance (TradFi), which had previously been a key driver of rallies in March and December 2024.
Following the mid-August all-time high, market momentum steadily weakened, dragging Bitcoin below the cost basis of recent buyers at the top and pushing the asset back into a range-bound structure. The critical question now is whether this reflects a healthy consolidation phase or the beginning of a deeper corrective cycle.
While dip-buyers provided some support, the primary selling pressure originated from experienced short-term holders. Data shows that 3–6 month holders have been realizing approximately $189 million in daily profits (based on the 14-day moving average), accounting for nearly 79% of total short-term holder realized gains. These figures indicate that many investors who entered the market during the February-to-May correction used the recent rally as an opportunity to lock in profits—creating considerable resistance against upward continuation.
In addition to profit-taking from seasoned short-term holders, recent peak buyers also capitulated by realizing losses during the pullback, further amplifying selling pressure. Alongside on-chain dynamics, assessing external demand through ETFs remains crucial, as these instruments have been pivotal in driving the current market cycle.
Since early August, net inflows into U.S. spot ETFs have sharply declined, currently averaging around 500 BTC per day (14-day moving average). This is far below the levels of capital inflows that had previously supported the bullish phase of the cycle, reflecting weakening momentum from TradFi investors. Given the central role of ETFs in fueling Bitcoin’s recent uptrend, the slowdown in flows makes the market’s current structure noticeably more fragile.
Meanwhile, blockchain-based prediction platform Polymarket has announced a new collaboration with Chainlink. The partnership aims to launch 15-minute crypto prediction markets featuring rapid settlement and industry-leading security standards.
The integration of Chainlink’s oracle technology with Polymarket’s trading infrastructure is expected to enhance user access to accurate and reliable data, delivering a new experience in short-term prediction markets. This collaboration could mark a turning point in the development of innovative trading instruments and price forecasting tools.

BRIEFING Week #36 : Oil Prices Diverge from RealityHere's your weekly update ! Brought to you each weekend with years of track-record history..
Don't forget to hit the like/follow button if you feel like this post deserves it ;)
That's the best way to support me and help pushing this content to other users.
Kindly,
Phil

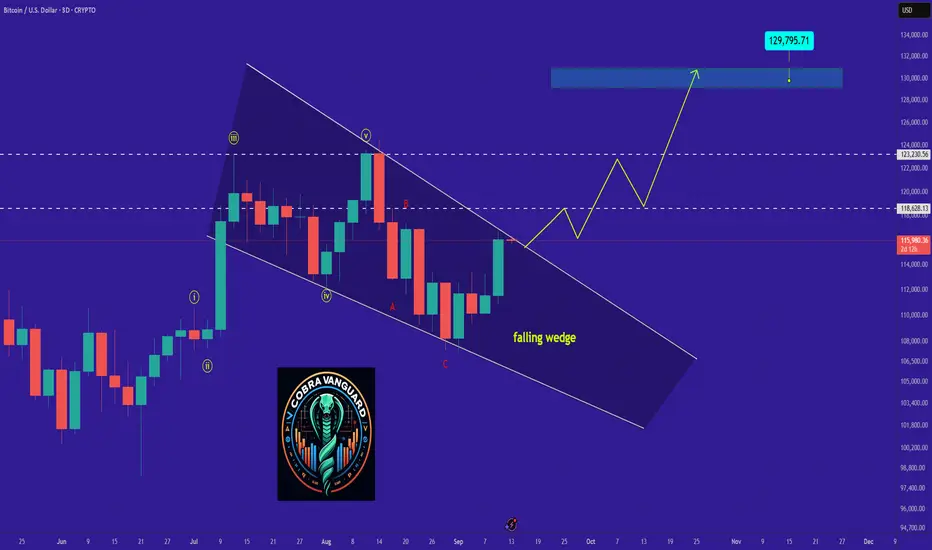
Bitcoin is bullish now & many Traders don't see it !!!Well, so far, the price has broken the triangle and the pullback is being completed. From here on, if nothing unusual happens, we can be hopeful that Bitcoin will reach $150k.
previous analysis
BTCUSD – 4H / Daily Testing Resistance, PO3 Setup PossibleBTCUSD is trading around $114,400 (≈ $114,300-114,500) and is showing resistance pressure in both the 4H & Daily timeframes. The price has bounced off lower structure but is now compressing right under a major resistance zone. This is appearing like a PO3 accumulation + possible breakout or rejection zone.
Possible Long Trade Setup:
• Entry: Consider going long if there’s a clean 4H candle close above $115,000, or a retest of support near $113,000-114,000 with strong bullish candle action.
• Target Levels:
• 🎯 1st Target – $118,000
• 🎯 2nd Target – $120,000+
• Invalidation: If price closes decisively below $112,500, bullish scenario is weakened and rejects may lead toward lower liquidity zones.
Please like 👍 & comment 💬 to support my post!
Your engagement pushes me to keep sharing quality setups with depth.
Best Regards,
KeswanTrades 🕊️
Disclosure: This is for educational purposes only—not financial advice.
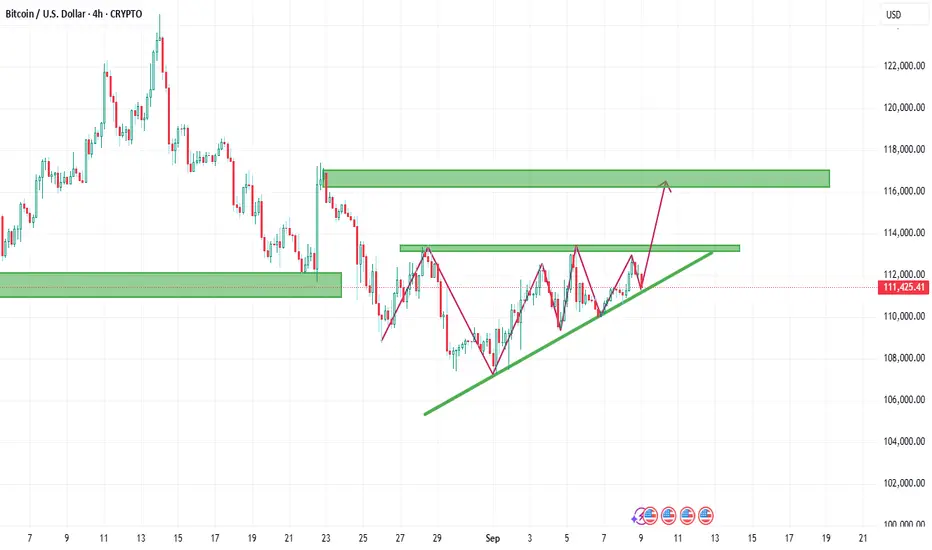
BTC is bullish now and many Traders don't see it !So if you pay attention to the BTC chart you can see that the price has formed a Ascending wedge which means it is expected to price move as equal as the measured price movement.( AB=CD )
NOTE: wait for break of the WEDGE .
Best regards CobraVanguard
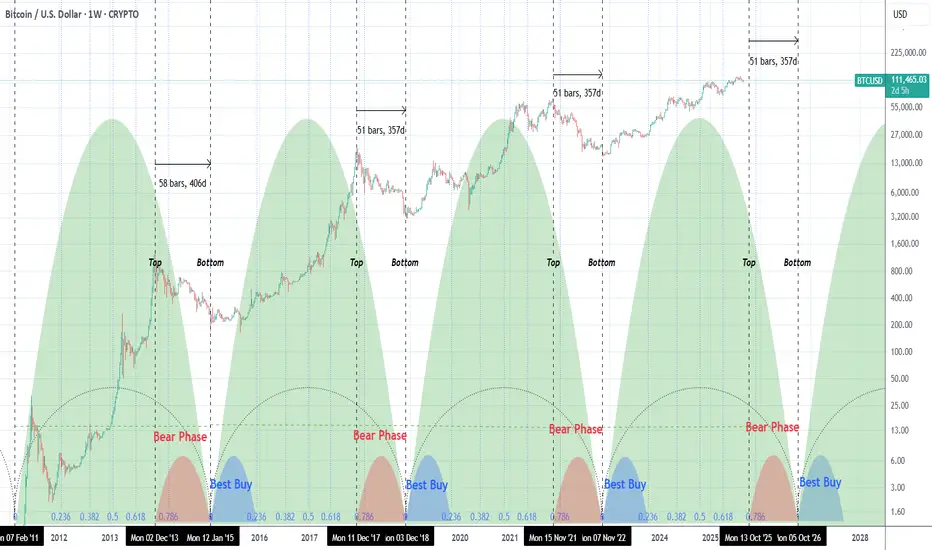
BITCOIN Is the end of the Bull Cycle approaching?Bitcoin (BTCUSD) may be approaching the end of its current Bull Cycle and a few weeks ago we have issued a first reminder of the dynamics of this Cycle in relation to all previous. The historic symmetry is high and this time we've presented it using the Time Cycles and Time Fibonacci levels.
As mentioned on previous studies, measuring the Super Cycle from bottom-to-bottom, the Top tends to be formed around the 0.786 Time Fib. Naturally the distance from the 0.786 Fib and 1.0 is the Bear Phase (red). What follows next is the Bear Buy (blue) of the Bull Phase from Fib 0.0 to Fib 0.236.
What concerns us most at this stage is the fact that 0.786 Time Fib is on the week starting December 01 2025. To make things more alarming, if the next Bear Phase follows the last two that measured 51 days from Top-to-Bottom, since the Super Cycle ends on October 05 2026, the next potential Top of this Cycle could be on the week starting October 13 2025!
Certainly food for thought, surely the current Cycle got derailed/ delayed a few months by Trump's tarrifs but above all this serves as a reminder that booking profits in trading is key. And especially since very few actually manage to do so on Tops.
So are you booking profits for this Cycle or not yet? Feel free to let us know in the comments section below!
-------------------------------------------------------------------------------
** Please LIKE 👍, FOLLOW ✅, SHARE 🙌 and COMMENT ✍ if you enjoy this idea! Also share your ideas and charts in the comments section below! This is best way to keep it relevant, support us, keep the content here free and allow the idea to reach as many people as possible. **
-------------------------------------------------------------------------------
💸💸💸💸💸💸
👇 👇 👇 👇 👇 👇
BTC bullish, targeting $115K and $120KWhat I have here is a series of fib fans and a fib retracement. You can see we hit the 61.8 and 50% retraces (red arrows), perfectly. There is a confluence of targets above. Momentum is supportive.

BTC/USD Builds Bullish Structure Toward 113,396 LiquidityBTC/USD on the 15-minute chart shows a sequence of bullish break of structure (BOS) moves, protected lows, and higher highs after recovering from an order block demand zone. Price respected multiple fair value gaps and pulled back into a support area near 111,387 before rallying. With a current BOS and accumulation in the fair value area, BTC looks set for a potential move toward the key liquidity target and previous daily high (PDH) near 113,396. A confirmed hold above 111,387 increases the likelihood of bulls pushing price higher; however, a break below weak low (110,747) would invalidate the setup.
This analysis is for educational purposes only and does not constitute financial advice. Trading involves risk—please do your own research or consult a financial advisor before making decision

Bitcoin BTC is at a Critical Level: Equal Highs Trade Plan💰 Bitcoin (BTC) Update 💰
BTC is currently trending upward 🟢📈 on the 30M timeframe ⏰ and has reached a critical level ⚖️. We’re seeing a shift in structure 🔄, but there are equal highs forming 📍, leaving the question: will price break higher and continue bullish 🚀, or reject and move lower 🔽?
📊 My trade plan is simple:
✅ Wait for a break above the current range/equal highs 📈
✅ Look for a retrace + retest 🔄
✅ Enter long on confirmation 🎯
If this setup fails to play out, then the idea is invalidated ❌ and we stand aside.
⚠️ This analysis is for educational purposes only and not financial advice. 📚

September 11 Bitcoin Bybit chart analysis (CPI)Hello
It's a Bitcoin Guide.
If you "follow"
You can receive real-time movement paths and comment notifications on major sections.
If my analysis was helpful,
Please click the booster button at the bottom.
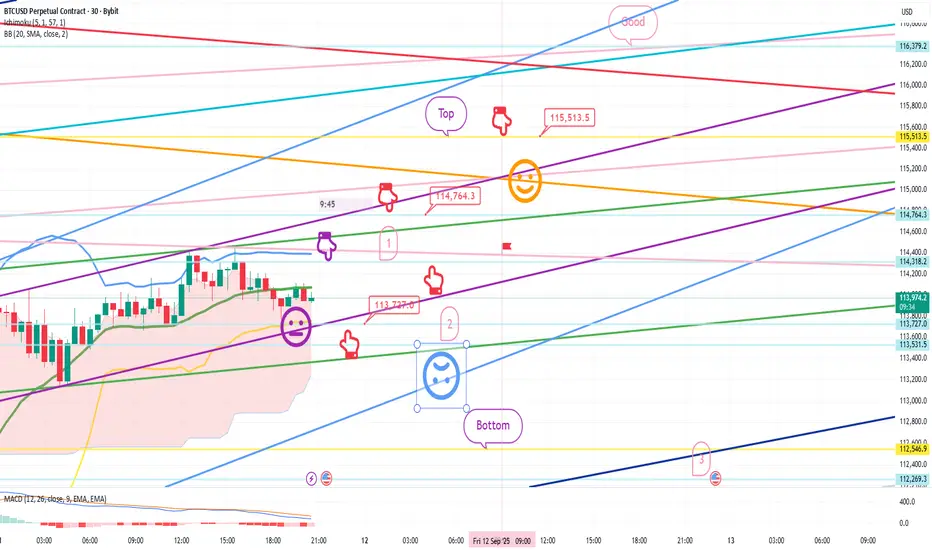
This is Bitcoin's 30-minute chart.
The CPI indicator will be released shortly at 9:30 AM.
I implemented the strategy based on Nasdaq movements.
*When the red finger moves,
Long position strategy
Confirm the upward wave by touching the first section above (autonomous shorting)
1. $113,727 long position entry point / Stop loss if the light blue support line is broken
2. $114,764.3 long position 1st target -> Top 2nd -> Good 3rd target
If the daily candlestick forms before 9:00 AM tomorrow,
you can switch to a short position if the top section is touched.
You can also use the first section shown as a long position switching point.
If the price falls immediately without touching the purple finger at the top, the final long position is at the second level. The strategy was to place a stop-loss order from the breakout of the light blue support line until the possibility of a sideways movement.
From the breakout of the light blue support line, the price opens up to the bottom -> level 3, so long positions should be cautious.
Please use my analysis to this point for reference only.
I hope you operate safely, adhering to principled trading and a stop-loss order.
Thank you.
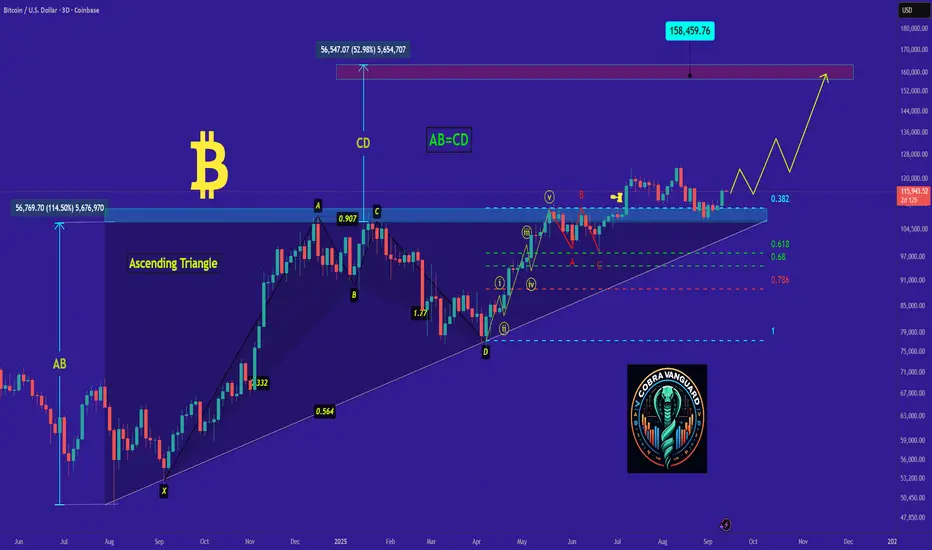
BTC to 160 > 190, maybeThis is one of many potential paths I have for BTC and want to publish it to see if it tracks. There's a lot going on here. what's important is the fib levels are all validated, meaning, if they complete their path they will hit these levels. of course, the timing is always an issue as are the pullbacks. Right now, this is the bullish case with a retrace in 2026. Yep, it could go all the way back to somewhere $75-$68K. Let's see how it does!

BTCUSD 4h bullish cloud watching, with clear complex iHSBTCUSD 4h bullish cloud watching, with clear complex iHS around 113.5k

BTC/USD Analysis Market is bullish and respecting the trendlineThe chart shows a Bullish Ascending Channel. Price is making higher-highs and higher-lows, indicating continuation of the uptrend.
---
🎯 Targets
TP1: 114,500 – 115,000
TP2: 117,000 – 117,500 (major resistance zone)
---
🛑 Stoploss
Near stoploss: 110,800 – 111,000 (below trendline)
Safe stoploss: 109,500
---
📌 Support & Resistance
Support: 111,000 – 111,200
Major Support: 109,800 – 110,000
Resistance: 114,500 – 115,000
Major Resistance: 117,000
---
✅ Post Caption for Clients
"📈 Bitcoin (BTC/USD) is moving inside a bullish ascending channel.
Strong support at 111,000 zone.
🎯 Targets: 114,500 – 117,000
🛑 Stoploss: 110,800
Market structure shows bullish continuation ahea

Bitcoins final push into new ATH?Based on my assumption that Bitcoin has formed a triple 1-2 structure, I expect that it is currently on the verge of building its final ATH for this bull market cycle. So far, the preceding wave 4s have always corrected at the upper edge of the underlying wave 4 area, which suggests that the final wave 5 may already have started. Alternatively, wave 4 might not be fully completed yet and could potentially retest the 50 week SMA.
This is not financial advice. It reflects my personal opinion and is for educational purposes only.

Bitcoin: Pullback Expected Into Prior Consolidation Zone
After a strong markup phase, Bitcoin has now formed a buying climax near the $113K level. Price action shows signs of distribution, with stacked imbalances above acting as a liquidity magnet. I expect price to first sweep this overhead liquidity, trapping breakout buyers and creating the conditions for a reversal.
Once the sweep is complete, confirmation will come if price fails back below the buying climax zone. This would indicate true seller pressure and a shift in market structure. At that point, I will be watching for a retest of the prior POC (Point of Control) to establish short positions.
Trade Plan:
Entry trigger: Sweep of buying climax → bearish rejection → retest of supply / POC.
Stop loss: Above the sweep high (invalidates distribution scenario).
Targets: Previous consolidation levels and liquidity pools below ($111K–$110K zones).
This setup aligns Wyckoff distribution structure with orderflow and liquidity logic. As long as the sweep fails and sellers regain control, I expect a pullback into the prior consolidation zone.
⚠️ Invalidation: Sustained acceptance above the buying climax would cancel the short bias.

BTC 15min TAJust wondering how this TA is going to hold up.
red box is the daily high low and median
orange is the 4hr timeframe levels
blue is 15min timeframe trends and green is 5min levels.
BS = Backside level (top of or first candle in a distribution range)
expectation = When price is above the level expect it will act as support with a strong reaction to price.
If strong reaction is not seen or long wicks are not seen reaching for the level, then the liquidity is not there and price will likely target the FrontSide level.
When price fails to gain a BackSide level like and gets below it, like it did 13 Sept 7:30, and fails 2x like at 8:15, & 9:15, then the BackSide level evolves into an Origin level and gains 1 timeframe in strength.
Price failed to gain the BackSide level (BS) at $115,991.89 2x so I differentiate the distribution trend that originates from that range as a BS level with a 2x dotted line font. This shows the color of the timeframe the level started at, and its now 2x line font indicating its strength increased and dotted indicating its been tested twice.
Hope that makes sense.
FrontSide level: the last candle in a distribution range.
The topside of the candle is the level, the swing low of the candle is the "exit" or "boundary" of the range.
Expectation: to keep price within the range. Hold price until an accumulation range/trend can establish. If price is closing below the swinglow then price is likely targeting a different range. If price fails to create the accumulation candles necessary to engulf the Frontside candle and get above the distribution candles/range, then price is likely going to target a different range or wait until one can be created.
Range = 2 or more candles in the same direction; of the same color.

BTCUSD OUTLOCK SHORT TERM CORRECTIVE SECNARIO IN PALY The current market structure of Bitcoin remains bullish, with price action steadily progressing within a well-defined upward channel. Since resolving the prior upward wedge, BTC has consistently formed higher highs and higher lows, respecting both support and resistance levels.
At present, BTC has completed another full rotation from the channel’s support and is now testing the upper boundary of the channel. This level coincides with a significant resistance zone around 118,200 – 117,200, creating a strong confluence area.
The primary expectation is a short-term corrective move, as the probability of rejection from this resistance remains high. A rejection here would indicate exhaustion of the current upward impulse and could trigger a downward rotation toward the channel’s support.
The target price (TP) for this corrective play is logically set at 112,200, which aligns well with the ascending support line of the channel—representing the most probable reaction zone for buyers.

Bitcoin analysisAfter Friday’s news that came out negative for the U.S. dollar and boosted Bitcoin and altcoins, Bitcoin is currently moving within a range. In this situation, on the 15-minute timeframe, there are two possible approaches:
1. Trade based on the range strategy.
2. Wait for a channel breakout.
**Note:** For a breakout, be very careful around the two zones marked with yellow circles, because you might think the range has broken and enter a position, while in reality there is strong support or resistance there, which can cause a fakeout and push the price back into the range. You must get solid confirmation before considering it a real breakout.
**Note:** Since the Forex market is closed, the market may show many fake and illogical moves. Therefore, using a tight stop-loss is not recommended. ✅

btc long biasWatching 15m FVG as potential entry zone
Anticipating liquidity grab + bullish reaction
Overall trend bias: Long

BTC/USD Bounces from Support, Targets Higher LevelsBTC/USD found strong support at the order block demand and fair value gap zone near 115,283. Price bounced from this area and looks poised for an upward move toward the next liquidity target around 116,807.
This analysis is for educational purposes only and does not constitute financial advice.

BTC/USDTRecently BTC has been trading inside an ascending triangle for some times now, with good volume, a breakout from the pattern passed the current resistance level will signal bullish momentum, am a little optimistic now that the BTC.D is in a bearish momentum and the ascending triangle often in many cases shows increase in bulls' control in the market. Let's hope the market doesn't disappoint us