bitcoinbitcoin is trying to reclaim resitance into support.
I will wait for weekend close to confirm and on Monday we will probabaly go long
BTCMINI trade ideas

Bitcoin Forecast: Sept 2025 | Bulls in Control?🔮 Bitcoin (BTCUSD) Technical Analysis & Trading Strategy
Date: September 6, 2025 | Closing Price: $110,656.71
🎯 Executive Summary & Market Outlook
Bitcoin is showcasing formidable strength, closing above the critical $110k psychological level. Our multi-indicator analysis suggests a bullish bias 🟢 with eyes on new all-time highs. However, the rally is maturing, and traders must be vigilant for potential volatility or a bear trap formation. This report outlines precise intraday and swing trading strategies for the week ahead.
📊 Comprehensive Technical Breakdown
1. Chart Pattern & Theory Synthesis:
Elliott Wave Theory: Price action suggests we are likely in a powerful Wave 3 of a larger impulsive bull cycle. The next minor pullback (Wave 4) should be bought into, targeting a final Wave 5 push higher.
Wyckoff Theory: Analysis points to a potential Sign of Strength (SOS) following a prolonged reaccumulation phase. A successful back-test of the breakout level ($105k - $107k) would confirm continued upward movement.
Gann Analysis: Using the Square of 9, key resistance levels are identified at $112,500 and $115,200. Gann angles from the last major low provide dynamic support; a break below could signal a deeper retracement.
Other Patterns: No classic Head & Shoulders top is present. The trend is characterized by bull flags and ascending triangles, indicating consolidation before continuation.
2. Key Indicators & Momentum:
RSI (14-period): On the daily chart, RSI is in the 60-70 range, indicating strong bullish momentum without being severely overbought. There is room for further upside before a correction becomes likely.
Bollinger Bands (BB): Price is riding the upper band, a sign of a strong trend. A move back inside the bands would signal a cooling of momentum, not necessarily a reversal.
Moving Averages: The order is perfectly bullish: Price > EMA(21) > EMA(50) > SMA(200). This "stacking" is a classic sign of a strong uptrend. Any pullback towards the EMA(21) (~$108k) would be a key intraday support.
Volume & VWAP: Anchored VWAP from the last significant low shows price trading well above it, confirming the Strong Bullish Trend ✅. Volume has been supportive on up-moves.
⚔️ Trading Strategy: Intraday (5M - 4H Charts)
Bias: cautiously bullish
Long Entries (3:1 R:R Minimum):
On a pullback to support (e.g., $109,200, $108,500, or the 21-EMA) with bullish reversal candlesticks (hammer, bullish engulfing) and increasing volume.
A breakout above the Asian session high with volume confirmation.
Short Entries (Counter-Trend, Higher Risk):
Only at clear resistance levels ($111,500, $112,500) with bearish rejection candles (shooting star, doji) and divergences on the RSI.
Stop-Loss: Tight stops, just below the recent swing low or key support level.
Take-Profit: Scale out at previous resistance levels turned support.
📈 Trading Strategy: Swing (4H - Daily Charts)
Bias: Bullish
Strategy: "Buy the Dip". Look for opportunities on any pullback into the key support zone of $105,000 - $107,000. This zone represents the previous resistance and the 50-EMA.
Invalidation: A daily close below $102,000 would invalidate the immediate bullish swing outlook and suggest a deeper correction to the $95k - $98k area.
Profit Targets:
Target 1: $115,000
Target 2: $118,000
Target 3: $125,000 (Extension)
⚠️ Risk Management & Trap Warning
Bull Trap 🚨🐂: A false breakout above $112k followed by a swift rejection and close back below $110k could lure in late buyers before a sharp drop. Confirmation: Low volume on the breakout.
Bear Trap 🚨🐻: A sharp, volatile wick down to $105k-$107k that is quickly bought up, trapping aggressive short sellers. Confirmation: A long-legged doji or hammer candle on high volume.
Always use stop-loss orders. Position size appropriately. The key is to protect capital.
💡 Conclusion
BTCUSD is in a confirmed uptrend. The path of least resistance is higher, favoring both long intraday positions and swing longs on dips. Traders should be agile, respect key support levels, and watch for trap formations at new highs. The integration of Gann targets, Elliott Wave structure, and Wyckoff phases provides a high-probability roadmap for the week ahead.
✅ Happy Trading! ✅
For individuals seeking to enhance their trading abilities based on the analyses provided, I recommend exploring the mentoring program offered by Shunya Trade. (Website: shunya dot trade)
I would appreciate your feedback on this analysis, as it will serve as a valuable resource for future endeavors.
Sincerely,
Shunya.Trade
Website: shunya dot trade
⚠️Disclaimer: This post is intended solely for educational purposes and does not constitute investment advice, financial advice, or trading recommendations. The views expressed herein are derived from technical analysis and are shared for informational purposes only. The stock market inherently carries risks, including the potential for capital loss. Therefore, readers are strongly advised to exercise prudent judgment before making any investment decisions. We assume no liability for any actions taken based on this content. For personalized guidance, it is recommended to consult a certified financial advisor.

BTC STORY ?
Hi,
Colourful world of coins.
Mega ship, mega cars.. mega house. So jealous.. they are the lucky ones.
BTC from 1$ to $120k.
If I bought it at 50,000 at 100$, I would sell like 10% and live like ...
hehe
But, life's like that... you don't have 100k$ or 500K$ excess money at that time to fund your BTC rightt..
So too bad.. or too late.
But I do have this advantage of Sell or Buy at THIS time.
That advantage is leverage or option. (my POV)
What say you?
Conversation my CME broker:
You : John ,Sell 3.00 of BTC at market (113K) !
John: You don't have 3.00 BTC?
You : What !! I tot I bought them in 1990..
John: You must have been scammed that time.
(fictitious= just a story)
Basically not everyone have it.
NOW
Conclusion .
Since I missed it. I love to buy it for vibrancy, hedging or sell when it increase in numbers.
Cheap buy, expensive sell.
That is trading only.
There Is a saying.
IF YOU LIKE CHEESE , JUST EAT IT.
DON'T BRING THE COW HOME.
You don't have to own a cow to have milk, and cheese. Just buy it.
hahaha. Trying to be funny.
Anyways.. all the best
Not a guru
NB/ stories are not true. & don't be hard up

Okay, here is a brief analysis of BTCUSD (Bitcoin against the USOkay, here is a brief analysis of BTCUSD (Bitcoin against the US Dollar).
**Fundamental Analysis:**
As the first and largest cryptocurrency by market cap, Bitcoin's core value lies in its decentralization, scarcity (capped at 21 million coins), and its narrative as "digital gold"—a store of value. Key bullish drivers include the massive success of US spot Bitcoin ETFs, which continuously attract traditional capital inflows; ongoing institutional adoption; and safe-haven demand fueled by global macroeconomic uncertainties. However, major risks remain, such as regulatory uncertainty (e.g., SEC policies), criticism over high energy consumption, and competition from other cryptocurrencies.
**Technical Analysis:**
BTCUSD typically exhibits high volatility and clear cyclical patterns (e.g., halving cycles). Its price action is often driven by macro sentiment, liquidity conditions (such as U.S. dollar interest rate policies), and its own market cycles. Key technical levels include the previous all-time high (around $69,000) as a major psychological resistance, while various moving averages (like the 200-day MA) and Fibonacci retracement levels form crucial support and resistance zones. Trading volume and the logarithmic growth trendline are vital for assessing the health of the long-term trend.
**Summary and Outlook:**
Bitcoin remains the benchmark and core asset of the cryptocurrency market. Its long-term narrative has shifted from "peer-to-peer electronic cash" to a mainstream "store of value." Short-term prices are heavily influenced by market sentiment, liquidity, and news, leading to significant volatility. Long-term performance will depend on its widespread adoption and its ability to solidify its position as a legitimate asset class within the global financial system. Investors must be aware of its high-risk nature.
***
*Disclaimer: The above content is market analysis and does not constitute any investment advice. Cryptocurrency investments are extremely high risk; please make decisions cautiously.*

Role of Technology in Global Markets 1. Historical Evolution of Technology in Markets
a. Early Communication Systems
In the 1800s, financial markets were largely local. Traders depended on physical meetings or handwritten letters to exchange market information.
The invention of the telegraph (1837) and later the telephone (1876) dramatically reduced the time it took to transmit financial information across cities and countries. For example, stock prices could be sent from New York to London in minutes instead of weeks.
b. Electronic Trading Emergence
The 20th century saw the development of electronic ticker systems, allowing near real-time updates of market prices.
By the 1970s and 1980s, exchanges began experimenting with electronic order-matching systems. NASDAQ, founded in 1971, became the world’s first electronic stock exchange.
c. The Internet Revolution
The 1990s introduced the internet into global markets. Online trading platforms allowed retail investors to directly access markets without relying solely on brokers.
E-commerce platforms like Amazon and Alibaba transformed global consumer markets, while digital communication allowed businesses to operate internationally with ease.
d. 21st-Century Transformations
Today’s markets are dominated by high-frequency trading (HFT), artificial intelligence (AI)-driven strategies, blockchain technologies, cloud computing, and mobile financial services.
Cross-border investing is instantaneous, and global markets operate nearly 24/7 with technology as their backbone.
2. Key Roles of Technology in Global Markets
a. Enhancing Market Efficiency
Technology reduces information asymmetry by providing real-time access to prices, news, and economic data.
Algorithms match buyers and sellers instantly, narrowing bid-ask spreads and improving liquidity.
b. Democratization of Access
Earlier, only wealthy institutions could access sophisticated markets. Now, mobile apps and online brokerages allow small retail investors across the world to trade with minimal costs.
Platforms like Robinhood, Zerodha, and eToro have expanded participation, enabling global capital flows.
c. Speed and Automation
High-frequency trading systems can execute thousands of trades per second, exploiting micro-price differences across exchanges.
Automation has also entered settlement systems. For example, blockchain-based smart contracts can settle cross-border payments instantly, reducing costs and delays.
d. Integration of Global Trade and Supply Chains
Technology supports global commerce through logistics software, digital supply chain management, and e-commerce.
Platforms like Amazon, Alibaba, and Shopify connect producers in one country directly with consumers worldwide.
e. Data and Analytics
Markets today thrive on data. Artificial intelligence and machine learning analyze billions of data points—from satellite images to social media sentiment—to predict economic and financial trends.
Big data tools allow investors and companies to manage risks better, anticipate market shifts, and optimize operations.
f. Financial Innovation
Technology has given rise to new asset classes such as cryptocurrencies, NFTs, and tokenized securities.
Decentralized Finance (DeFi) platforms now allow global lending, borrowing, and investing without intermediaries.
3. The Role of Technology Across Market Segments
a. Stock Markets
Stock exchanges globally, like NYSE, NASDAQ, London Stock Exchange, and NSE India, operate through highly advanced trading platforms.
Investors across the world can place trades in milliseconds, and order books are updated in real-time.
AI-driven portfolio management tools (robo-advisors) help retail investors diversify globally at low costs.
b. Foreign Exchange (Forex) Markets
The forex market is the world’s largest, trading over $7 trillion daily. Technology enables real-time currency trading across time zones.
Electronic Communication Networks (ECNs) match global buyers and sellers, improving liquidity and reducing barriers.
Mobile apps allow individuals to hedge against currency risk or speculate, regardless of location.
c. Commodities and Energy Markets
Technology enables smart logistics, digital commodity trading platforms, and automated hedging strategies.
For oil, metals, and agricultural products, satellite data and IoT devices provide real-time production and supply information, improving transparency.
d. Cryptocurrency and Digital Assets
Blockchain technology has created entirely new forms of global markets.
Bitcoin, Ethereum, and other cryptocurrencies trade on global exchanges accessible 24/7.
DeFi protocols allow people to lend, borrow, and earn interest globally without banks.
e. E-commerce and Consumer Markets
Global consumer markets are dominated by digital platforms. Amazon, Alibaba, Flipkart, and Mercado Libre connect sellers and buyers worldwide.
Payment technologies like PayPal, UPI, and digital wallets facilitate seamless cross-border transactions.
4. Benefits of Technology in Global Markets
Accessibility: Investors and businesses worldwide can participate, regardless of geography.
Efficiency: Faster transactions, lower costs, and transparent processes.
Liquidity: Electronic platforms ensure deep pools of buyers and sellers.
Innovation: Emergence of new asset classes and financial instruments.
Transparency: Real-time reporting and monitoring reduce fraud and insider advantages.
Inclusivity: Small investors and businesses gain entry into markets once dominated by large institutions.
5. Risks and Challenges of Technology in Global Markets
a. Cybersecurity Threats
Global markets face risks of hacking, data breaches, and fraud.
High-profile exchange hacks (like Mt. Gox in 2014) show how vulnerable digital markets can be.
b. Market Volatility
Algorithmic trading sometimes amplifies volatility, as seen in the “Flash Crash” of May 2010 when the Dow dropped nearly 1,000 points within minutes.
c. Digital Divide
While technology democratizes access, millions worldwide remain excluded due to lack of internet, devices, or digital literacy.
d. Regulatory Challenges
Cross-border digital markets are hard to regulate uniformly. For example, cryptocurrency regulations differ drastically between countries, creating uncertainty.
e. Over-Reliance on Technology
System failures, outages, or glitches can halt global trading. For instance, NYSE and NSE India have both faced trading halts due to technical issues.
6. The Future of Technology in Global Markets
a. Artificial Intelligence (AI) and Machine Learning
AI will further automate trading, risk management, and fraud detection.
Predictive analytics will become central to investment decisions.
b. Blockchain and Decentralization
Blockchain has the potential to eliminate intermediaries in global markets, reducing costs and improving efficiency.
Tokenization may allow fractional ownership of real-world assets like real estate and art.
c. Quantum Computing
Quantum technology could revolutionize market modeling, encryption, and trading strategies, offering new levels of computational power.
d. Sustainable and Green Technology
Technology will enable carbon credit markets, renewable energy trading platforms, and ESG-focused investing.
Blockchain can track supply chain sustainability and ethical sourcing.
e. Global Financial Inclusion
Mobile banking and fintech will bring billions of unbanked individuals into the global financial system, especially in developing nations.
7. Case Studies
Robinhood and Gamestop (2021): Showed how technology and social media democratize access but also create risks of market manipulation.
Alibaba Singles’ Day Sales: A showcase of how e-commerce technology creates global consumer demand, with billions in sales in a single day.
Cryptocurrency Boom: Bitcoin’s rise to a trillion-dollar asset class highlights the disruptive role of blockchain in global finance.
Tesla’s Global Supply Chain: Use of AI, automation, and digital logistics to manage global production and delivery networks.
Conclusion
Technology is not just an enabler but the backbone of modern global markets. It drives speed, efficiency, innovation, and inclusivity, ensuring that capital, goods, services, and information flow seamlessly across borders. However, its power also comes with risks—cyber threats, volatility, inequality, and regulatory challenges—that must be managed carefully.
As we look ahead, technology’s role will only deepen, with AI, blockchain, and fintech shaping the next wave of market evolution. The ultimate challenge will be to harness technology’s benefits while creating safeguards that ensure global markets remain fair, stable, and inclusive for all.

Role of International Trade in Global Markets1. Understanding International Trade
International trade refers to the exchange of goods, services, capital, and ideas across national borders. Unlike domestic trade, which takes place within one country, international trade involves multiple currencies, laws, cultures, and business practices.
Key Features:
Cross-border transactions: Goods and services move from one country to another.
Comparative advantage: Nations specialize in what they produce most efficiently.
Use of currencies: Requires mechanisms for exchange rates and settlement.
Government involvement: Tariffs, quotas, trade agreements, and regulations.
Global institutions: WTO, IMF, World Bank, and regional trade blocs shape trade flows.
Historical Perspective:
Ancient trade routes like the Silk Road enabled cultural and material exchanges.
Colonial trade in the 16th–19th centuries focused on raw material extraction and global shipping networks.
Post–World War II saw the creation of institutions like the GATT (General Agreement on Tariffs and Trade), later evolving into the World Trade Organization (WTO), to facilitate rules-based trade.
21st-century trade involves digital commerce, global value chains (GVCs), and services-based exports such as IT, finance, and logistics.
2. The Economic Role of International Trade in Global Markets
(a) Driver of Economic Growth
International trade expands markets for producers, giving them access to consumers beyond national borders. For developing nations, it provides pathways to industrialization and modernization. For advanced economies, it ensures continued growth through exports and investment opportunities.
Export-led growth: Economies like China, South Korea, and Singapore have grown exponentially by adopting export-oriented development strategies.
Access to larger markets: Firms achieve economies of scale, producing more efficiently and lowering costs.
Capital inflows: Foreign trade attracts foreign direct investment (FDI), creating jobs and infrastructure.
(b) Resource Allocation and Efficiency
Trade allows countries to specialize according to comparative advantage, leading to more efficient global resource use. For example:
Middle Eastern countries specialize in oil exports.
India exports IT services and pharmaceuticals.
Germany exports automobiles and engineering products.
This specialization boosts global productivity while lowering costs for consumers.
(c) Contribution to GDP
In most economies, international trade contributes significantly to GDP (Gross Domestic Product).
For open economies like Singapore, trade (exports + imports) accounts for >300% of GDP.
Even large economies like the US, China, and EU rely heavily on trade for growth.
(d) Enhancing Consumer Choice
Through trade, consumers gain access to a wider variety of goods and services—ranging from electronics and luxury cars to agricultural products and entertainment content. This improves living standards globally.
(e) Job Creation and Employment
Trade-intensive industries generate millions of jobs. Export manufacturing zones, service outsourcing, and logistics hubs provide direct employment while also stimulating indirect job creation in supporting industries.
3. International Trade and Market Integration
(a) Global Value Chains (GVCs)
Modern trade is characterized by the fragmentation of production. A single product, like an iPhone, is designed in the US, manufactured in China, with components sourced from Japan, Korea, and Germany. GVCs integrate multiple economies into a single supply network.
(b) Financial Market Integration
International trade requires financial flows, including payments, investments, and hedging. This leads to:
Cross-border capital movement.
Global financial interdependence.
Development of international banking and currency markets.
(c) Technology and Knowledge Transfer
Trade facilitates the spread of technology and innovation. Multinational corporations bring modern techniques to host countries, enhancing productivity and competitiveness.
(d) Formation of Trade Blocs
Regional economic integration—like the European Union (EU), NAFTA/USMCA, ASEAN, and African Continental Free Trade Area (AfCFTA)—has reshaped global markets by reducing barriers and creating common markets.
4. Social and Political Role of International Trade
(a) Promoting Peace and Cooperation
Trade interdependence reduces the likelihood of conflicts. Nations that rely on each other for resources, markets, or investment have incentives to maintain peaceful relations.
(b) Cultural Exchange
Trade spreads not only products but also cultures, ideas, and lifestyles. For instance, Hollywood movies, K-pop, and yoga reached global audiences through trade-driven globalization.
(c) Political Leverage
Countries use trade as a tool of diplomacy or pressure. Sanctions, trade restrictions, and preferential trade agreements influence global politics.
(d) Reducing Poverty
Trade-led growth lifts millions out of poverty. For example, China’s integration into world trade since the 1980s has lifted over 800 million people above the poverty line.
5. Challenges of International Trade in Global Markets
While trade drives growth, it also brings vulnerabilities.
(a) Trade Imbalances
Large deficits or surpluses can destabilize economies. For instance, the persistent US-China trade imbalance has fueled economic tensions.
(b) Protectionism
Countries often impose tariffs, quotas, or subsidies to protect domestic industries, which can trigger trade wars. Example: US-China tariff war (2018–2020).
(c) Supply Chain Disruptions
Events like the COVID-19 pandemic, the Russia-Ukraine war, and the Suez Canal blockage highlighted the fragility of global supply chains.
(d) Inequality
Trade benefits are unevenly distributed. While some sectors and regions thrive, others suffer job losses due to import competition or outsourcing.
(e) Environmental Concerns
Increased trade leads to higher carbon emissions from shipping and production, contributing to climate change. At the same time, global competition pressures industries to adopt environmentally unsustainable practices.
6. Role of International Institutions in Trade
(a) World Trade Organization (WTO)
Provides rules for global trade.
Resolves disputes.
Promotes free and fair competition.
(b) International Monetary Fund (IMF) and World Bank
Support balance-of-payments stability.
Finance trade-related development projects.
(c) Regional Organizations
EU ensures a common market with free movement of goods, services, and people.
ASEAN and USMCA promote regional cooperation.
7. Future of International Trade in Global Markets
(a) Digital Trade and E-commerce
Cross-border e-commerce platforms like Amazon, Alibaba, and Shopify are reshaping trade, making it easier for small businesses to reach global markets.
(b) Services Trade
Beyond goods, international trade in IT services, fintech, tourism, and online education is becoming a major growth driver.
(c) Sustainable Trade
Green trade policies are gaining prominence, focusing on renewable energy, low-carbon logistics, and sustainable sourcing.
(d) Geopolitical Shifts
The rise of China and India as global trade powerhouses.
Trade realignment due to US-China rivalry.
Increased focus on South-South trade among emerging markets.
(e) Technological Innovations
Blockchain, artificial intelligence, and digital currencies may revolutionize trade logistics, payments, and transparency.
Conclusion
International trade is the backbone of global markets. It enables countries to grow beyond their domestic limitations, enhances efficiency through specialization, and integrates the world into a complex but interdependent economic system. While trade has its challenges—ranging from inequality and environmental concerns to geopolitical tensions—it remains an irreplaceable driver of globalization and prosperity.
In the coming decades, the role of international trade will evolve further, shaped by technology, sustainability, and geopolitics. Countries that adapt effectively, balancing openness with resilience, will thrive in an interconnected global marketplace.

“Bitcoin Price Action: Liquidity Grab Fuels Next Bullish Impulse“Bitcoin Price Action: Liquidity Grab Fuels Next Bullish Impulse 📈”
Hello Traders & Investors,
Let’s take a closer look at BTCUSD from both a structural and liquidity perspective.
🔹 Market Structure
The chart shows that after a strong bullish leg into mid-August, BTCUSD faced heavy rejection from the 120,000 – 123,000 resistance zone, which remains the most important supply area on the chart. This rejection triggered a clear Break of Structure (BOS), leading to a correction and liquidity grab.
Recently, price created a liquidity sweep in the 108,000 – 110,000 region, trapping late sellers and collecting orders from beneath previous lows. Following that, BTCUSD reclaimed the 111,000 – 112,000 zone, confirming it as new support.
🔹 Liquidity & Smart Money Behavior
The downside sweep indicates accumulation, where smart money entered long positions.
Liquidity resting above current levels (towards 116,000 → 120,000) is now the most likely target for price.
The previous liquidity channel to the downside has been fully absorbed, shifting bias toward bullish continuation.
🔹 Key Levels to Watch
Support: 111,000 – 112,000 (liquidity sweep + reclaimed support).
Resistance: 120,000 – 123,000 (major supply and reaction zone).
🔹 Projection
As long as BTCUSD holds above 111,000, my bias remains bullish. The next objective lies at the 120,000 zone, which aligns with untested supply and prior rejection levels. However, traders should be prepared for a reaction or short-term retracement once this area is tested.
✅ Conclusion:
BTCUSD has shown strength after sweeping liquidity from the downside. The structure now supports a bullish push toward 120,000, provided 111,000 support continues to hold. This remains a critical level for validation of further upside.

Latest Bitcoin Analysis: Accurate Trading SignalsBitcoin prices closed lower again on the daily chart, and the overall range is still slowly moving downward. The intraday gains have been retraced, and the current low is near yesterday's support level of 109,300, but it has not broken below, and the trend remains weak and volatile. A subsequent break below 109,000 support would break the short-term consolidation pattern, and the intraday low is expected to move further downward.
The four-hour chart shows a correction after a high. The short-term rebound has not broken through the daily Bollinger middle axis, and the price is currently trading below 111,000. If it breaks below the intraday support level, the risk of further decline is expected. Therefore, the intraday strategy remains to hold a short position on the rebound. Based on the current trend, focus on the resistance area of 111,800.
Accurate Bitcoin Signals Reference:
1. Short-selling Resistance: 111,300-111,800; Major Resistance: 112,500
2. Buy-Support Support: 109,500-108,300; Major Support: 106,500
Trading involves risk; manage your position appropriately.
KRAKEN:BTCUSD BITSTAMP:BTCUSD COINBASE:BTCUSD BINANCE:BTCUSD CRYPTO:BTCUSD OKX:BTCUSD

Gold Prices Hit All-Time Highs: What Does This Mean for Bitcoin?Gold prices surged to new highs in early September, driven by global uncertainty and new US trade barriers. Bitcoin retested a two-month low near $107,350, extending its three-week decline since its all-time high of $124,474 in August. During this period, the correlation between gold and Bitcoin remained near zero, challenging the "digital gold" narrative but supporting their use as complementary hedges.
While gold shines, Bitcoin finds itself at a crossroads. The BTC sell-off has had broad repercussions across the cryptocurrency market.
A research report this week highlighted that the ETH/BTC exchange rate has stabilized at 0.04 over the past ten trading days, signaling a pause in Bitcoin's bullish momentum. Furthermore, BTC’s average daily spot trading volume also fell to $2.9 billion this week. “Despite the downward trend, activity has remained high, with smaller weekly changes since mid-July compared to Q2 – indicating a vibrant spot market as BTC continues to consolidate in the $110,000 range.” BITSTAMP:BTCUSD COINBASE:BTCUSD CRYPTO:BTCUSD BINANCE:BTCUSD OKX:BTCUSD KRAKEN:BTCUSD

1D BTCUSD inverted green hammerOn the 1D BTCUSD chart an inverted green hammer is forming. Will it stay like this at the end of the day?
Add this to the inverted head and shoulders pattern on the 4h BTCUSD for an even more bullish outlook.

btc levels we pumped off the 109397 level t0 113393 level with a high of 113402 and was Rejected and is now falling needs to hold 111111 or we start thr process all over again lock in profits

Bitcoin - TIP - Correct Way to Draw Support / ResistanceI see often times analysts using horizontal support and resistance on Bitcoin.
I wanted to demonstrate the proper way of using support resistance on Bitcoin - and show how the channels are ascending from left to right.
Not only can this be repeated on high time frames - by duplicating the line with the same degree of angle, and placing it at any location - it can also be applied to smaller and smaller time frames, and the price respects these angles very well.
Due to the liquidation wicks and absorptions that occur, price will move above and below the correct line - but the correct line serves as a volume support line that’s again, ascending from left to right.
Try this out on your charts - and see how reliable it is.
Ascending angles - not horizontals.

Bitcoin Shorting Opportunity: Order Block Resistance at $120KBitcoin (BTC/USD) Shorting Opportunity: Order Block Resistance at $120K - Sep 5, 2025
This chart is a 1-day candlestick chart for Bitcoin (BTC/USD), created on TradingView.com on September 5, 2025, at 10:58 UTC+1 (11:04 AM WAT). It presents a potential shorting opportunity based on the following analysis:
- Entry Point: Initiate a short position near $120,892.50, which aligns with the upper boundary of the Order Block (OB). This area likely represents significant institutional selling interest and a potential resistance zone.
- Target: Aim for a profit target at $98,242.47, the recent low, indicating a potential downside move of approximately $22,650 per BTC.
- Stop Loss: Place a stop loss at $123,286.98, just above the Order Block, to limit risk to about $2,394.48 per BTC if the price breaks upward.
- Risk-Reward Ratio: This setup offers a favorable 1:9 risk-reward ratio, making it an attractive shorting opportunity if the Order Block holds as resistance.
- Rationale: The Order Block, marked on the chart, suggests a reversal point where selling pressure may dominate. The recent "Sweep" and "Shift" annotations indicate a possible liquidity grab or trend change, supporting a potential decline toward the support at $98,242.47. The upward move from the low followed by a pullback reinforces this setup.
Monitor price action closely around the Order Block, as volatility could impact the trade. Consider real-time data for confirmation.

BTCUSD DAY TRADING SETUP (CAFX)"This is how I am currently analyzing BTCUSD. I’m paying close attention to the overall market structure, key support and resistance zones, and recent price action to determine where the next move might unfold. I’ll be watching for potential breakout opportunities, liquidity grabs, and retests around major levels to confirm my bias. Keep in mind, this is simply my personal outlook and not financial advice — always do your own analysis before making trading decisions."

BTCUSD – Breakout from Range High → Eyeing 115–119k SweepBTC broke out of the local range and tagged liquidity around 112.6k. Structure still looks constructive with EMAs turning supportive on the 1H.
• Entry (white): 112,000–112,200 (buy zone / retest levels)
• Stop (red): 110,785 (below recent swing)
• Take Profit 1 (green): 113,825 (local fib extension + resistance)
• Take Profit 2 (green): 115,503–115,516 (key supply)
• Take Profit 3 (green): 119,608 (major range high / liquidity sweep)
Bias: Bullish continuation unless 110,800 breaks — in which case we reassess for a deeper flush back to 109k liquidity.

BTCUSD bullish continuation supported at 109,040The BTCUSD remains in a bullish trend, with recent price action showing signs of a corrective pullback within the broader uptrend.
Support Zone: 109,040 – a key level from previous consolidation. Price is currently testing or approaching this level.
A bullish rebound from 109,040 would confirm ongoing upside momentum, with potential targets at:
115,420 – initial resistance
117,400 – psychological and structural level
119,260 – extended resistance on the longer-term chart
Bearish Scenario:
A confirmed break and daily close below 109,040 would weaken the bullish outlook and suggest deeper downside risk toward:
106,470 – minor support
104,340 – stronger support and potential demand zone
Outlook:
Bullish bias remains intact while the BTCUSD holds above 109,040. A sustained break below this level could shift momentum to the downside in the short term.
This communication is for informational purposes only and should not be viewed as any form of recommendation as to a particular course of action or as investment advice. It is not intended as an offer or solicitation for the purchase or sale of any financial instrument or as an official confirmation of any transaction. Opinions, estimates and assumptions expressed herein are made as of the date of this communication and are subject to change without notice. This communication has been prepared based upon information, including market prices, data and other information, believed to be reliable; however, Trade Nation does not warrant its completeness or accuracy. All market prices and market data contained in or attached to this communication are indicative and subject to change without notice.

Emerging Markets vs Developed Markets1. Defining Emerging and Developed Markets
Emerging Markets
Defined by the World Bank, IMF, and MSCI as economies transitioning from low or middle-income to higher-income levels.
Often characterized by rapid GDP growth, increasing foreign investment, and structural reforms.
Have growing but still volatile financial markets.
Examples: India, China, Brazil, Mexico, Turkey, South Africa.
Developed Markets
Countries with high per-capita income (usually above $12,000-$15,000), strong institutions, and advanced infrastructure.
Financial systems are stable, liquid, and globally integrated.
Economies are more service-oriented rather than manufacturing-driven.
Examples: U.S., U.K., Germany, Japan, Canada, Australia.
2. Key Economic Characteristics
Feature Emerging Markets Developed Markets
GDP Growth Higher growth rates (5–8% in many cases) Lower growth (1–3%)
Per Capita Income Low to middle-income High-income
Industrial Structure Manufacturing & agriculture dominant, but services growing Services dominate (finance, technology, healthcare)
Innovation Catching up; dependent on FDI & imports Advanced R&D, global tech leaders
Currency Stability Volatile, prone to inflation Stable, globally traded (USD, Euro, Yen)
Emerging markets are often seen as growth stories, while developed markets represent stability and maturity.
3. Financial Market Differences
Emerging Markets
Stock markets are less liquid, meaning large trades can move prices dramatically.
Higher volatility due to political risk, regulatory uncertainty, and global capital flows.
Often more sector-concentrated (energy, banking, infrastructure).
Foreign Direct Investment (FDI) plays a big role in financing growth.
Developed Markets
Deep, highly liquid capital markets (e.g., U.S. stock market is the largest in the world).
Lower volatility, with strong institutional investors (pension funds, insurance companies).
More diverse sectoral representation (tech, healthcare, finance, industrials).
Better regulations, reducing systemic risks.
4. Investment Opportunities
Why Investors Choose Emerging Markets
Higher returns: Fast economic growth means higher equity and bond returns (though riskier).
Demographics: Younger populations, rising middle class, and urbanization.
Undervalued assets: Stocks and bonds often trade at cheaper valuations compared to developed markets.
Natural resources: Many emerging economies are rich in oil, gas, and minerals.
Why Investors Choose Developed Markets
Stability: Political stability, strong legal protections, and reliable institutions.
Liquidity: Easy entry and exit in large markets like the U.S. and Europe.
Innovation hubs: Developed countries lead in technology, biotech, and finance.
Lower risk: Investors prefer developed markets during global uncertainty.
5. Risk Factors
Emerging Markets Risks
Political Risk: Government instability, corruption, and inconsistent policy.
Currency Risk: Devaluation or inflation affecting returns.
Liquidity Risk: Difficulty in buying/selling assets without price disruptions.
Regulatory Risk: Sudden changes in trade policy, taxes, or financial rules.
Dependence on Commodities: Economies like Brazil or Russia depend heavily on oil/mineral exports.
Developed Markets Risks
Slower Growth: Returns are lower due to market maturity.
Aging Population: Japan and Europe face demographic challenges.
Debt Levels: High government debt (U.S., Japan).
Global Linkages: Developed markets are highly exposed to global downturns.
6. Role in Global Trade
Emerging Markets: Supply labor-intensive goods, commodities, and raw materials. They are key players in global manufacturing supply chains (China, Vietnam, India).
Developed Markets: Supply high-value goods and services like technology, finance, pharmaceuticals, aerospace, and luxury products.
Emerging economies are often the producers, while developed markets are the consumers and innovators.
7. Examples of Emerging vs Developed Markets
Emerging Markets Examples
India: Fastest-growing large economy, driven by services and IT.
China: World’s factory, now transitioning toward consumption-driven growth.
Brazil: Rich in natural resources but faces political and inflation challenges.
South Africa: Gateway to Africa, but troubled by inequality and governance issues.
Developed Markets Examples
United States: World’s largest economy, innovation hub (Silicon Valley, Wall Street).
Germany: Europe’s powerhouse, strong in engineering and manufacturing.
Japan: Technology-driven, though aging demographics challenge growth.
United Kingdom: Major financial center, diversified economy.
8. Performance Trends
Emerging markets tend to outperform during global booms due to higher growth and demand for commodities.
Developed markets perform better in downturns, as investors flock to safe assets.
Over the last two decades, China and India have been the growth engines, while the U.S. has remained the financial powerhouse.
9. Case Study: 2008 Financial Crisis vs COVID-19 Pandemic
2008 Crisis: Developed markets (U.S., Europe) were hit hardest due to financial exposure. Emerging markets recovered faster, supported by China’s stimulus.
COVID-19 Pandemic: Emerging markets struggled due to weak healthcare and high debt, while developed economies used fiscal stimulus and central banks to stabilize markets.
This highlights how resilience differs across categories.
10. Future Outlook
Emerging Markets: Expected to drive global growth due to demographics, urbanization, and technology adoption. India and Southeast Asia are especially promising.
Developed Markets: Will remain leaders in innovation, finance, and global institutions. However, slower growth and aging populations will challenge long-term momentum.
Integration: The line between emerging and developed is blurring. Countries like South Korea, Singapore, and Taiwan once considered “emerging” are now closer to developed status.
Conclusion
The distinction between emerging markets and developed markets is fundamental in understanding global economics and finance. Emerging markets offer growth, opportunities, and dynamism, while developed markets provide stability, maturity, and reliability.
For investors, businesses, and policymakers, the choice is not about preferring one over the other but about balancing exposure to both. A diversified portfolio that captures the growth of emerging markets while relying on the stability of developed markets is often the most effective approach.
The future will likely see more emerging economies transition into developed ones, reshaping the global economic order. India, China, and parts of Africa may become the next growth engines, while developed countries will continue leading in technology and governance.
In summary, emerging markets are the growth frontier, while developed markets remain the anchors of global stability. Understanding their differences is key to navigating global finance and economics.
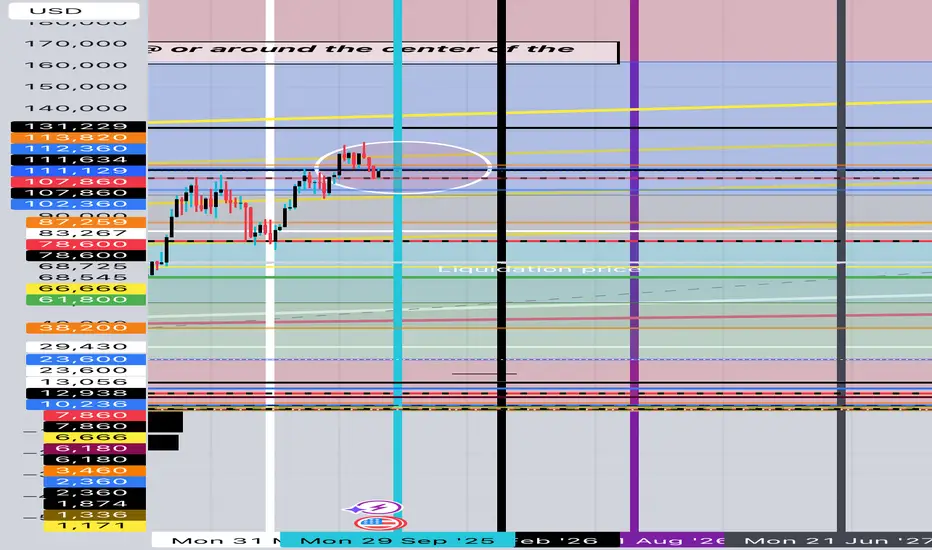
BTC 5th halving : $423,600 (minimum) Predicting Q1 of 2032
Im almost certain BTC is nearing the end of its current bull run cycle. So Im getting ready to find the bottom of the 4th Halving's run to prepare for the 5th Halving's peak

Testing snap shotI never really got the hang of publishing ideas , which sucks because I have been spot on with my predictions
Btcusd fridayIt’s happening btc is going a bit high and then higher then higher because of the falling usd in Friday session

BIG BTC Upswing coming upMy Trade idea is based on Moving Averages, Momentum, Volume profiles and Bollinger Bands

Bitcoin to $500K by 2028–2030Institutional Adoption, Scarcity, and the Devaluation of the Dollar
The question of whether Bitcoin could reach the half‑million mark within the next five to seven years is increasingly debated among investors, economists, and institutions alike. While such projections still carry uncertainty, several converging trends suggest that a $500,000 valuation for Bitcoin by 2028–2030 is within the realm of possibility. These drivers include the rapid pace of institutional adoption, Bitcoin’s fixed supply, its growing narrative as a store of value, the potential role of national reserves, and a macroeconomic backdrop defined by inflation and dollar devaluation. Additionally, the long‑term holding behavior of Bitcoin investors has reduced circulating supply, further amplifying the scarcity effect.
1. Institutional Adoption via ETFs and Beyond
The approval and growth of Bitcoin exchange-traded funds (ETFs) in major financial markets mark a watershed moment in the asset’s mainstream acceptance. These vehicles simplify access for institutional investors that were previously constrained by custody and regulatory hurdles. Pension funds, endowments, and sovereign wealth funds are now able to allocate to Bitcoin through regulated channels.
As demand from professional investors grows, the inflows through ETFs act as a continual buy‑side force. Unlike speculative retail buying sprees of previous cycles, institutional allocations are more structured and long‑term oriented, potentially anchoring a more stable demand floor. This steady absorption of supply is expected to become one of the strongest catalysts for Bitcoin price growth this decade.
2. Fixed Supply: The Scarcity Engine
Bitcoin’s most unique feature is its hard‑coded supply cap: only 21 million coins will ever exist . This mathematical certainty contrasts starkly with fiat currencies, where central banks can expand money supply indefinitely. Halving events, which reduce the block rewards of mining BTC roughly every four years, further accelerate scarcity.
By 2030 , the annual mining of Bitcoin will be minuscule compared to today, limiting fresh supply even as institutional demand scales up. In classical economic terms, a growing demand against a fixed or declining supply can only result in upward price pressure.
3. Store of Value in an Inflationary World
The past decade has demonstrated how inflation and monetary expansion distort asset markets. As governments print more money to finance debt and expenditures, investors increasingly seek hedges against the erosion of purchasing power. Historically, gold has played this role.
Bitcoin, with its transportability, divisibility, verifiability, and digital-native characteristics, is now increasingly seen as a modern alternative or complement to gold. If Bitcoin even partially captures the $13+ trillion gold market as a store of value, valuations well above $500,000 per coin become mathematically plausible.
4. Bitcoin as a Component of National Reserves
While still early, several nations are exploring or experimenting with holding Bitcoin in their reserves. For countries facing dollar dependency or geopolitical pressures, Bitcoin provides a neutral, censorship‑resistant reserve asset that reduces reliance on the U.S. financial system.
Should more governments follow El Salvador’s lead or allocate even a small percentage of their foreign reserves to Bitcoin, global reserve demand could represent a massive new buyer base. Even marginal allocations at a sovereign level would create outsized effects due to Bitcoin’s relatively small market capitalization compared to global reserves.
5. The Dollar, Inflation, and Asset Price Revaluation
The U.S. dollar, while still dominant, faces structural challenges: ballooning government debt, persistent fiscal deficits, and the need for monetary expansion to sustain growth. Increased money supply historically leads to currency debasement. As purchasing power erodes, asset prices, from equities to real estate to scarce stores of value like Bitcoin, tend to reprice higher in nominal dollar terms.
Thus, Bitcoin’s potential ascent to $500,000 is not solely about Bitcoin “going up,” but also about the dollar “going down.” In this sense, the milestone is as much a reflection of fiat devaluation as it is of Bitcoin adoption.
6. The Supply Dynamics: 80% Already Parked
On‑chain analytics highlight another critical factor: roughly 80% of Bitcoin supply is currently held by long‑term investors in “dormant” wallets, seldom moved or sold. This indicates that a large portion of the supply is illiquid, effectively taken off the market.
When institutions, retail newcomers, or governments try to acquire Bitcoin in size, they will be competing over the thin slice of supply available for trade. This dynamic creates a potential supply squeeze, which historically has been one of the key drivers of Bitcoin’s parabolic price advances.
Conclusion: A Plausible Milestone, But With Volatility Along the Way
Projecting Bitcoin to $500,000 by 2028–2030 is not simply speculation, it is a thesis grounded in identifiable trends: institutional adoption through ETFs, a mathematically capped supply, Bitcoin’s emerging status as digital gold, the potential for sovereign reserve adoption, and macroeconomic tailwinds fueled by dollar debasement.
However, it is important to note that Bitcoin’s journey will not be linear. Volatility, regulatory battles, and shifts in global macro conditions will shape the trajectory. Yet, the combination of structural scarcity and rising global demand makes the possibility of half‑a‑million per coin a credible long‑term scenario.
#crypto #bitcoin #finance #defi #economy #portfolio #digital #blockchain #trading #asset

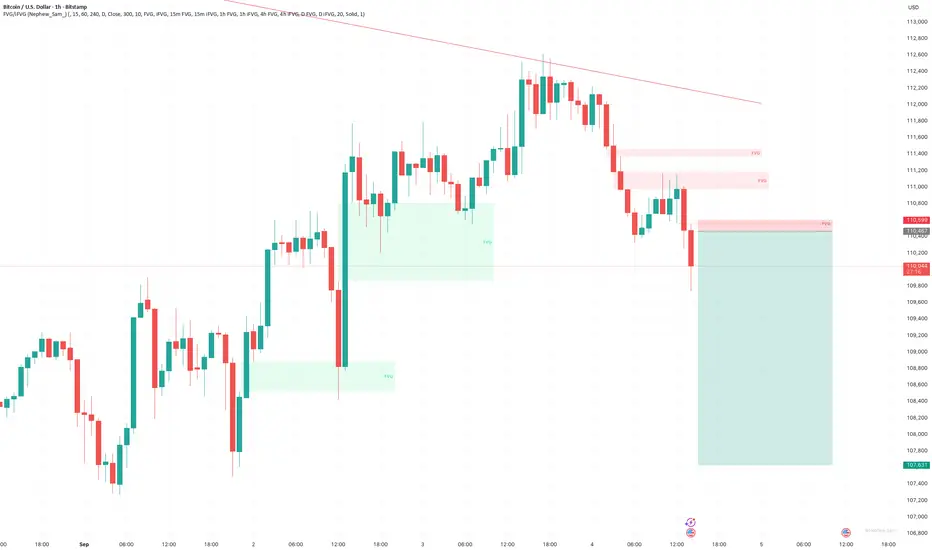
BTC Short Setup ideaLooking to short BTC at 110,400
🎯 Targets:
TP1: 108,000
TP2: 107,620
🛑 Stop Loss: 110,600
Risk/Reward looking solid for this short-term move. Watching price action closely around entry zone for confirmation. Trade safe!
#BTC #Bitcoin #CryptoTrading #ShortSetup #TechnicalAnalysis