BTCUSD eyes bearish bat patternOn the 4-hour chart, BTCUSD rebounded from a low level. Currently, we can pay attention to the resistance near 112770 above. This position is the short position of the bearish bat pattern, and this position is in the previous supply area.
BTCMINI trade ideas

BTCI can see there are 2 chances for execute a trade so i gonna grab it , this seems like support zones are available in my lines

Bitcoin Elliott Wave AnalysisIf the previous peak marked the end of Wave 3, then the current position can be interpreted as Wave 4 in progress.
However, looking at past cycles, Bitcoin’s Wave 3 rallies have historically extended at least three times higher than Wave 1, and in rare cases—such as in 2017—reached as much as 18 times higher. While the recent pattern may suggest a series of lower highs, it is still possible that Wave 3 is ongoing. Further confirmation is needed before drawing a definitive conclusion.

Current outlook of Bitcoin and future projections!BTCUSD which has been bearish atleast some few days ago, seems to be formulating a sell setup. watch closely.

Scalping Buy Trade on BTC/USD (1-Minute Chart)Scalping Buy Trade on BTC/USD (1-Minute Chart)
Description:
I entered a quick scalping long position on BTC/USD from the 1-minute chart.
Entry Price: around 111,178
Target: 111,40 (+395 points / +0.36%)
Risk/Reward Ratio: 1:4.16

BTCwe are looking for BTC impulsive leg after a correction, over time we have seen price create Higher High and lower low. with this we are waiting for price to come to to our POI then we take action.

BTC/USD Short from Resistance Zone BTC/USD Short from Resistance Zone
🔻 Short Position on Bitcoin (BTC/USD)

BTC Long Trade 3BTC Long Bounced off previous resistance, classic set up, had this order for ages and only now just realised it got filled

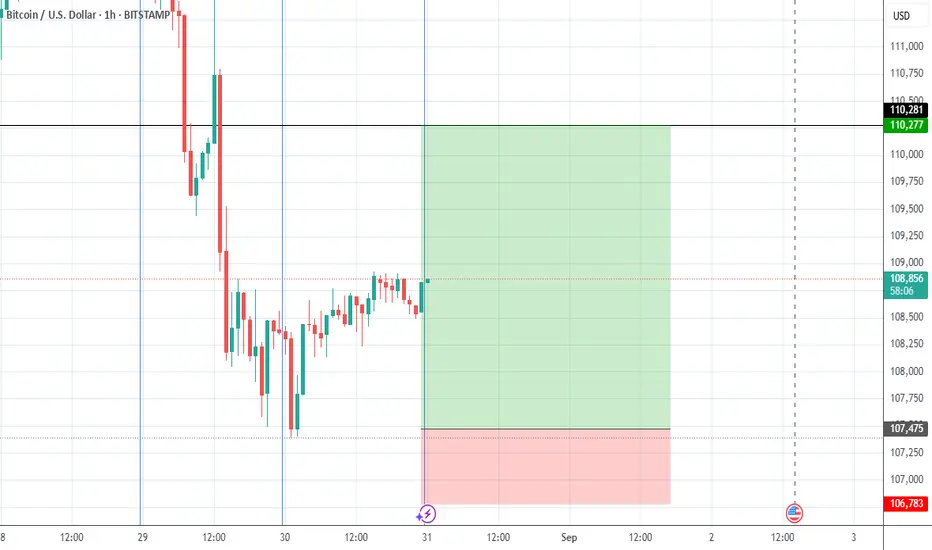
BTCUSD — A Dance at the Edge (Short Setup)As Bitcoin ascends the staircase of resistance, it finds itself knocking on the gates of 110,602— a familiar high, worn and weathered by past struggles. The candles flicker with hesitation, whispering the tale of exhaustion. Sellers, silent until now, stir beneath the surface.
And so, the scene is set
📍 Entry Point: 110,391
Here, the trader steps in — not with haste, but with precision — entering short as price falters beneath the watchful eye of resistance.
📍 Stop Loss: 110,779
A line drawn in the sand above the swing high. Should the bulls break through, the curtain falls early, and the trade bows out with dignity.
📍 Target: 109244
Far below, where demand once sparked a reversal, lies the mark of completion. The price may rest there once more — or simply pause before its next descent.
Risk to Reward: A poetic 1:2 — the delicate balance between courage and caution.
" If there is no managed risk, one cannot take profit "
This is not mere speculation; it is the art of calculated risk. A narrative written not in ink, but in wicks and waves. And in this moment, the short story begins — swift, sharp, and deliberate.
Do comment And For Our thought support please.

Bitcoin – Stoic Equilibrium at the Threshold of Resistance.⊣
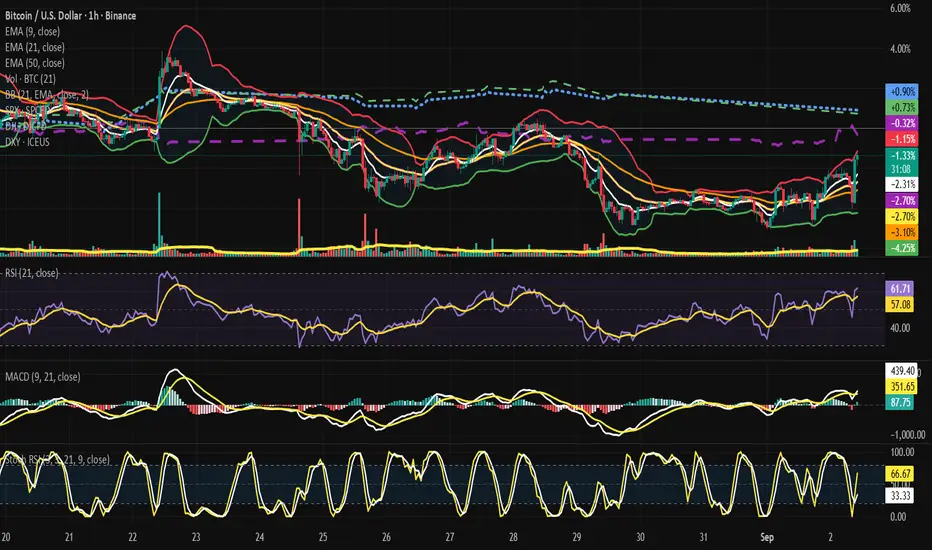
⟁ BTC/USD – BINANCE – (CHART: 1H) – (Sep 02, 2025).
◇ Analysis Price: $111,256.57.
⊣
⨀ I. Temporal Axis – Strategic Interval – (1H):
▦ EMA9 – (–2.78%):
∴ Price trading above EMA9 after recovery;
∴ Short-term bullish tilt, but EMA slope still negative;
∴ Needs sustained closes above to confirm momentum.
✴️ Conclusion: EMA9 = fragile bullish reclaim.
⊢
▦ EMA21 – (–3.06%):
∴ Mid-term intraday resistance;
∴ Price hovering above, but EMA slope negative;
∴ Confirms cautious recovery, not yet trend reversal.
✴️ Conclusion: EMA21 = tactical battleground.
⊢
▦ EMA50 – (–3.40%):
∴ Still trending lower;
∴ Acts as structural resistance in case of rejection;
∴ Price must conquer this line for sustainable recovery.
✴️ Conclusion: EMA50 = resistance wall.
⊢
▦ BB (21,2, basis = EMA9) – (Upper ~ –1.63% / Midline ~ –3.06% / Lower ~ –4.49%):
∴ Price touched upper band after expansion;
∴ Volatility rising, room for extension;
∴ Midline ($~109.7K zone) = key support.
✴️ Conclusion: Bands = bullish expansion but risky near top edge.
⊢
▦ RSI (21, 9) – (60.74 / 55.97):
∴ RSI above 60 = bullish momentum intraday;
∴ Far from overbought;
∴ Momentum supportive.
✴️ Conclusion: RSI confirms bullish bias.
⊢
▦ MACD (9,21,9) – (Line 330.85 / Signal 323.29 / Histogram –7.57):
∴ Slight bearish histogram despite positive lines;
∴ Indicates deceleration of bullish momentum;
∴ Potential for short-term pullback.
✴️ Conclusion: MACD = cautionary divergence.
⊢
▦ Stoch RSI (3,3,21,9) – (K 33.33 / D 21.85):
∴ Rebounding from oversold zone;
∴ Early bullish reset;
∴ Supports continuation if price holds EMA21.
✴️ Conclusion: Stoch RSI = tactical rebound in progress.
⊢
🜎 Strategic Insight – Technical Oracle:
∴ The intraday chart reveals BTC pressing into a critical transition zone, where price action is sustained above EMA9 and EMA21, yet still confronting the weight of EMA50. This structure embodies the conflict between short-term bullish recovery and the inertia of a broader corrective slope;
∴ Bollinger dynamics expose price testing the upper band (~$111.2K), signaling volatility expansion. A close above this band would shift the volatility regime into a breakout posture, yet rejection here would reaffirm the band as containment, pulling Bitcoin back toward the midline ($109.7K);
▦ Momentum oscillators diverge:
∴ RSI at 60.74 projects strength, comfortably above neutrality, implying the market has regained bullish control intraday;
∴ MACD, however, whispers caution: line > signal, yet histogram negative (–7.57). This subtle divergence hints that while price moves upward, the underlying strength of momentum is waning;
∴ Stoch RSI curled upward from oversold (K 33.33 / D 21.85), supporting the probability of a rebound continuation, but only if supported by volume;
∴ Bitcoin stands at the mouth of decision. Supportive global indices and a softer dollar open the door for bulls, but internal momentum signals warn that strength may be brittle unless confirmed with follow-through above EMA50 and sustained beyond ($111.2K).
✴️ Conclusion and Interpretation: The intraday oracle portrays Bitcoin caught between external tailwinds (equities, dollar weakness) and internal hesitation (MACD divergence at resistance). If the structure clears ($111.2K) with conviction, upside extends toward ($112 / $113K). Failure to break transforms ($109.7K) into the next gravitational pull.
⊣
⨀ II. Cross-Market Overlay (H1):
▦ S&P500 Futures (SPX) – (+1.69%):
∴ Strong upward performance, reflecting clear risk-on appetite in equities;
∴ Reinforces the idea that investors are rotating back into risk assets, easing pressure on Bitcoin;
∴ Correlation intraday favors Bitcoin following the equity impulse.
✴️ Conclusion: SPX surge = supportive external catalyst for crypto upside.
⊢
▦ Dow Jones Futures (DJI) – (+1.68%):
∴ Similar bullish posture to SPX, confirming broad equity strength;
∴ Dow’s advance adds structural confirmation: this is not sectorial, but systemic risk-on;
∴ Provides BTC with secondary reinforcement, as both indices align.
✴️ Conclusion: DJI rally = synchronized support, amplifying bullish context.
⊢
▦ US Dollar Index (DXY) – (–0.09%):
∴ Dollar weakening slightly = reduced headwinds for risk assets;
∴ Historically, Bitcoin rallies when DXY softens;
∴ Though the drop is modest, it’s directionally supportive.
✴️ Conclusion: DXY negative = marginal tailwind for Bitcoin’s rebound.
⊢
🜎 Interpretation – Cross-Market Oracle:
∴ With equities (SPX, DJI) rising in tandem and the dollar easing, the macro-intraday environment leans pro-risk;
∴ Bitcoin finds aligned external conditions: equities provide momentum correlation, while the dollar’s decline removes friction;
∴ The confluence strengthens the probability of Bitcoin challenging resistance zones ($111.2K+), provided internal momentum validates the move.
✴️ Conclusion: Cross-markets stand as aligned tailwinds for Bitcoin intraday, granting bulls external reinforcement.
⊣
𓂀 Stoic-Structural Interpretation – Intraday (BTC/USD + Cross-Market, H1):
∴ Structure of Price: Bitcoin advances above EMA9/21, reclaiming short-term control, yet EMA50 remains a slope of resistance; Bollinger bands widen, showing volatility release; Upper band ($111.2K) acts as the gateway: breach signals expansion, rejection returns price toward ($109.7K) equilibrium;
∴ Momentum of Will: RSI (>60) projects renewed strength, Stoch RSI lifts from oversold as tactical breath, yet MACD histogram whispers restraint - momentum falters even as price climbs. The will of the market is not pure force, but effort against inertia;
∴ Flow of Capital: Equities (SPX +1.69%, DJI +1.68%) roar in risk-on alignment, while DXY (–0.09%) softens, easing friction. External streams pour favorable winds upon Bitcoin’s sail, yet the vessel must hold its structure or drift back to harbor.
Fatum – Destiny of Intraday: The path is compressed between structure and external tide:
Break above $111.2K: opens the corridor to ($112 / $113K);
Failure and rejection: gravity returns to ($109.7K / $109.3K) support cluster.
✴️ Conclusion: Bitcoin intraday embodies the stoic lesson: external forces (equities up, dollar weak) favor advance, yet internal momentum is fragile. The outcome rests not in wish but in structure - resistance must yield for fate to shift.
⊢
· Cryptorvm Dominvs · MAGISTER ARCANVM · Vox Primordialis ·
· Dominivm Cardo Gyratio Omnivm · Silence precedes the next force. Structure is sacred ·
⊢
btcusd buy setupTitle: BTC/USD Short from Resistance Zone
Idea:
🔻 Short Position on Bitcoin (BTC/USD)
Entry: 11089
Target: 10807
Stop Loss: 11298
Reasoning: Strong resistance near 11100 with bearish momentum, expecting a retracement toward lower support levels.
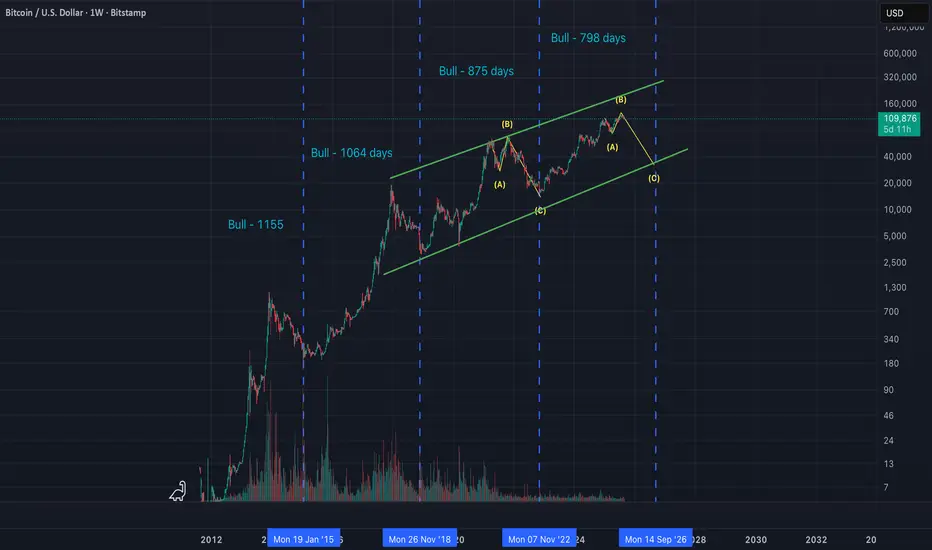
I hate to say it, but BTC is done - !Cycle ended!I've plotted the time in which each bull cycle takes to complete. Each run is getting shorter, not longer.. So looking at the previous run, we can see that we saw an expanded ABC to correct - one more little peak at at ATNH but then down into the inevitable correction. I think exactly the same thing is playing out here. We've seen so much brevado, but almost no new liquidity - there may well be a rate cut or two coming in September but I feel it's already priced in. When Powell inferred there would be cuts a few weeks ago, the market jumped but then dumped. Buy the rumour, sell the news. So - I'm out, cashed in my chips. Off to buy a new car.
Long Opportunity1st break of Market structure after a strong down trend, Strong bullish Divergences forming, we have weekly vwap with previous day median with monthly POC all lining up range 108,500 -109000, Target previous week High

no.1 Swing trade D1 (Trend - Smc - bob volman) - 02/09/20251. EUR/USD: Waiting for Compression to Complete
- Price has already completed the previous liquidity sweep.
- Currently consolidating sideways around the EMA-21.
- Waiting for a Bob Volman-style compression to complete before considering a long entry.
2. XAU/USD: Building Strong Liquidity
- Price swept the previous ATH, generating significant liquidity.
- Waiting for price to retrace and collect that liquidity — once a successful sweep is confirmed, we can look for long opportunities.
3. BTC/USD: Awaiting Liquidity Sweep Confirmation
- Price has completed a valid liquidity setup and is now in the process of sweeping liquidity before a potential bullish reversal.
- We need to see price break above the nearest high to confirm liquidity has been taken.
- Two possible entry scenarios:
3.1 Compression before breakout → a potential Bob Volman setup, allowing an early entry without waiting for sweep confirmation.
3.2 Breakout through the confirmation line:
*** If the breakout leaves a wick → place a limit at the nearest low, SL below the sweep.
*** If the breakout closes above the line with multiple candles → set a limit at the candle with the highest volume prior to breakout, SL below that high-volume candle.

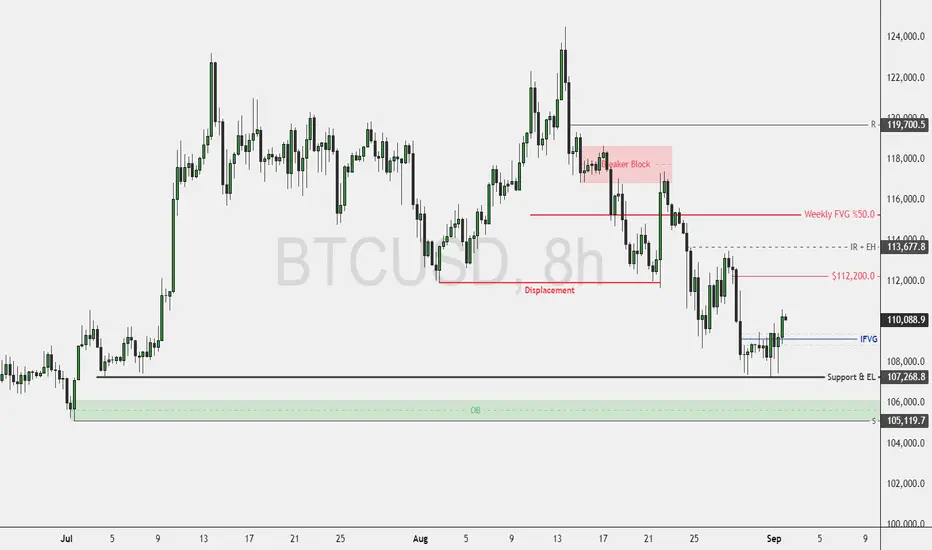
Bitcoin’s Temporary Rebound Targets Key HighsFenzoFx—Bitcoin remains bearish, though the downtrend paused after tapping equal lows at $107,268.0. BTC has since flipped above the recent fair value gap near $110,200.0.
We anticipate the downtrend will resume, targeting the bullish order block at $105,119.0. BTC/USD may rise toward $112,200.0, followed by equal highs at $113,677.0.
Once these levels are swept, the bearish trend is likely to continue. Traders and investors should monitor these key zones for potential bearish setups.
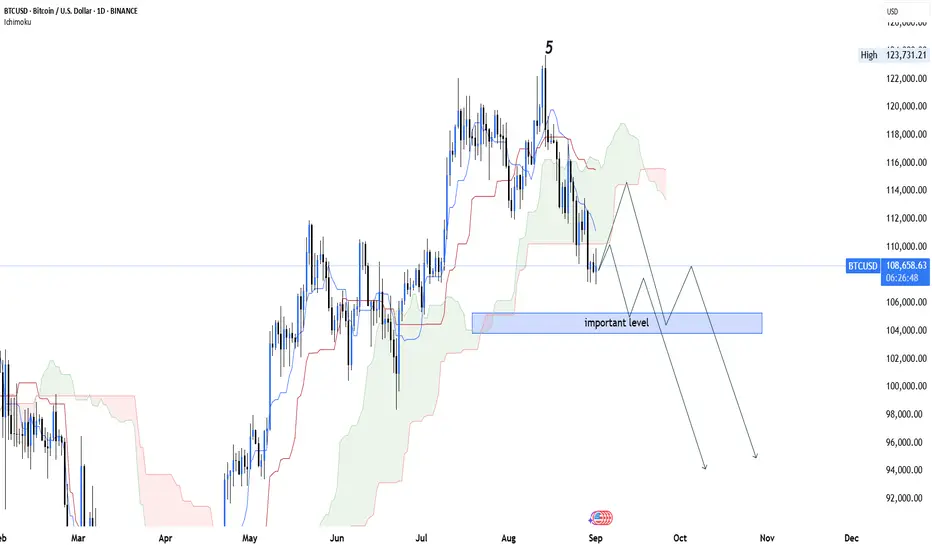
Cup & Handle Done, BTC Correction First Before Another High!The correction itself supported by the Rising Wedge pattern that has been break the support level. So, in the near term let it corrected, supposed to be $87,000-$92,000 areas before we see another record high in the medium term.
The trigger will be Fed starting the rate cut in 17 September 2025.
Caution :
Not recommended for trading purpose! It's too risky!
Better you use the spot for invest, not trading the futures market!
BTC probably will move along with US Stock Indices.. therefore they area getting supported when Fed confirmed the rate cut cycles!

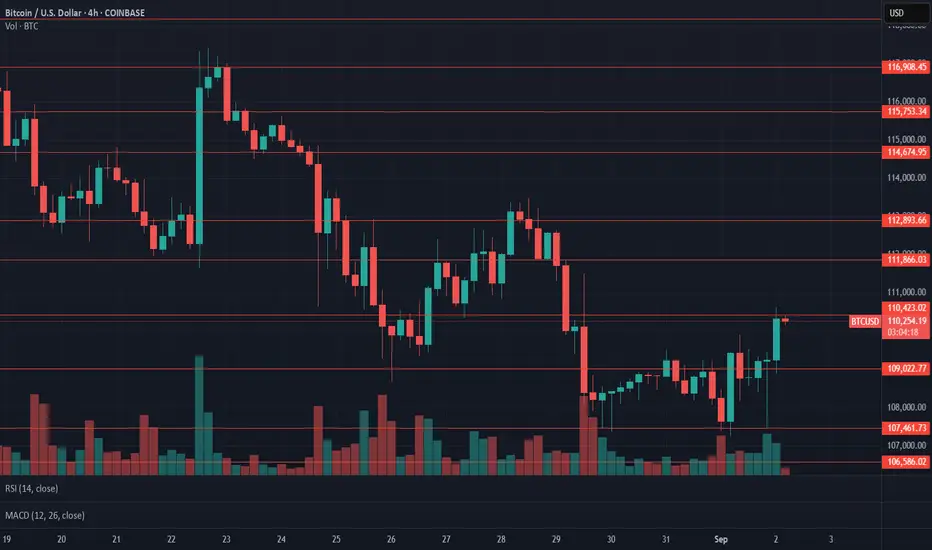
$BTC Daily UpdateCRYPTOCAP:BTC #BTC Very good bullish pin bar on 4h off of $107,461 support, put bullish engulfing following it. $110,423 resistance being tested, $109,022 support in effect and tested, Bullish engulfing on previous daily close too, time to see if it can follow thru. Decline in volume on last 4h close, weakening climb, we gonna be here for a while, support at $107,461 to watch with resistance remaining at $110,423 and key resistance at $115,753.
Lock in profits and go with the trend.As previously analyzed and predicted, Bitcoin has started a pullback as expected after hitting the key resistance level on the 4-hour chart. Looking at the current market, the price has broken below the support of the short-term 5-day moving average, with a MACD death cross signal appearing on the hourly chart. Bearish momentum has initially been released, and the short-term downward trend has become relatively clear.
Friends who entered positions earlier can appropriately reduce some holdings to lock in profits. If the price breaks below 107,000 later, you can continue to enter short positions after a rebound.
Bitcoin at a Generational Crossroads : The $115k Decision Point Chart: BTC/USD, Monthly Timeframe
Bias: Neutral to Bearish if key resistance holds.
Idea: This is a long-term analysis based on historical price action within a multi-year channel.
Summary (The Thesis):
This analysis looks at Bitcoin's price action on the monthly chart, contained within a large, ascending parallel channel that has defined bull and bear cycles for years. We are currently testing the upper boundary of this channel, a historical resistance zone.
My thesis is that the $110,000 - $115,000 zone represents a critical decision point for the entire market. A failure to decisively break above this level could initiate a significant, multi-month pullback to reset market sentiment and gather liquidity before the next major leg up.
The Macro Analysis (The "Why") :
The Ascending Channel: As you can see on the monthly chart, Bitcoin's price has respected this ascending channel since 2017. The upper line has consistently acted as a major distribution zone and cycle top (marked with red arrows), while the lower line has served as a generational buying opportunity (marked with green arrows). We are currently at the upper line.
Historical Resistance: History shows that the first test of this upper channel boundary is rarely successful. The price often requires a significant consolidation or a deep correction before it can muster the strength to break into a new price paradigm.
Market Mechanics & Liquidity: From a market mechanics perspective, a massive number of longs have entered the market since the move up from the $70k-$75k range. A "huge pullback" would serve to liquidate these late, over-leveraged positions, allowing market makers to absorb liquidity and build the necessary foundation for a sustainable break of the all-time high later on.

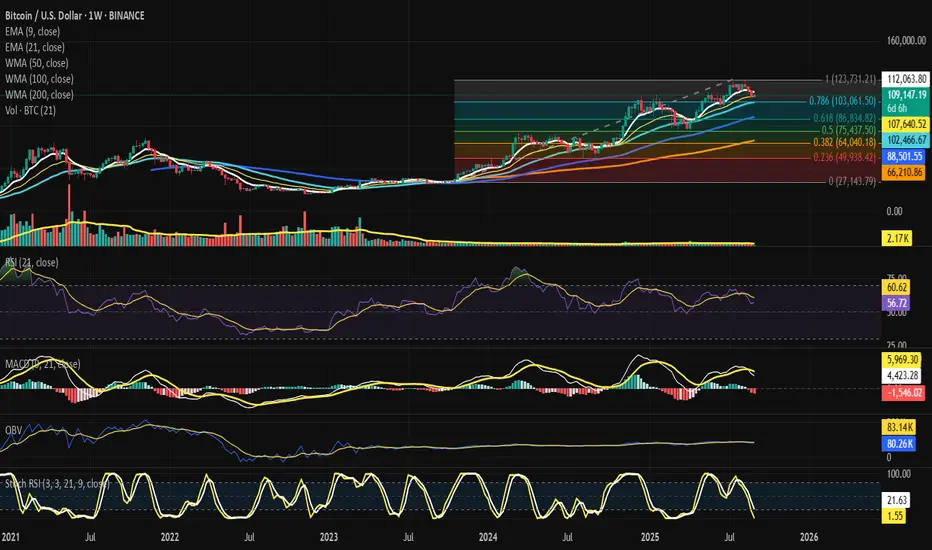
Bitcoin – The Hinge of $108K: CME Gaps Define the Path.⊣
⟁ BTC/USD – BINANCE – (CHART: 1W) – (Sep 01, 2025).
◇ Analysis Price: $108,883.16.
⊣
⨀ I. Temporal Axis – Strategic Interval – (1W):
▦ EMA9 – $112,010.99:
∴ Price trades below EMA9, confirming weekly short-term weakness;
∴ Acts as dynamic resistance aligned with rejection candles;
∴ Bulls require a weekly close > EMA9 to regain strength.
✴️ Conclusion: EMA9 = first ceiling for recovery.
⊢
▦ EMA21 – $107,616.51:
∴ Price currently rests just above EMA21;
∴ EMA21 aligns with tactical support after EMA9 loss;
∴ Confluence with local structure reinforces as battle line.
✴️ Conclusion: EMA21 = current pivot, decisive for weekly trend.
⊢
▦ WMA50 – $102,456.32:
∴ Converges with Fib 0.786 ($103,061);
∴ Forms heavy support cluster;
∴ Break below exposes deeper retracement zones.
✴️ Conclusion: WMA50 + Fib 0.786 = structural shield.
⊢
▦ WMA100 – $88,496.32:
∴ Mid-term support level, far from spot;
∴ Safety net below Fib 0.618 ($86,834);
∴ Historical pivot in previous cycles.
✴️ Conclusion: WMA100 = mid-term structural base.
⊢
▦ WMA200 – $66,208.23:
∴ Ultimate macro support far below current action;
∴ Defines secular trend;
∴ Bears unlikely to reach without systemic capitulation.
✴️ Conclusion: WMA200 = macro foundation.
⊢
▦ RSI (21, close 9) – 56.57 / 60.59:
∴ RSI above 50 = positive bias, but descending from prior highs;
∴ Momentum weakening, approaching neutrality;
∴ No bullish divergence formed yet;
✴️ Conclusion: RSI fading, still positive but fragile.
⊢
▦ MACD (9,21,9) – Line: 4,394.48 / Signal: 5,963.54 / Histogram: –1,569.06:
∴ Bearish crossover confirmed;
∴ Histogram negative, momentum shifting bearish;
∴ Weekly timeframe signals mid-term risk.
✴️ Conclusion: MACD = bearish transition underway.
⊢
▦ OBV + EMA9 – OBV: 83.14K / EMA9: 80.26K:
∴ OBV above EMA9, reflecting prior accumulation;
∴ No expansion, flattening trajectory;
∴ Suggests distribution/neutral flows.
✴️ Conclusion: OBV steady but not supportive.
⊢
▦ Stoch RSI (3,3,21,9) – K: 1.09 / D: 21.48:
∴ In deep oversold (<20);
∴ Early cross attempt between K and D;
∴ Relief rally possible, not yet confirmed.
✴️ Conclusion: Oversold condition signals potential bounce.
⊢
▦ Fibonacci Retracement (0 = 27,143 -> 1 = 123,731):
0.786 -> $103,061 (≈ WMA50);
0.618 -> $86,834 (≈ WMA100);
0.500 -> $75,437;
0.382 -> $64,040;
0.236 -> $49,938.
✴️ Conclusion: $103k region = confluence fortress; loss exposes $86k.
⊢
🜎 Strategic Insight - Technical Oracle:
∴ The weekly structure is compressed between EMA9 ($112K) above and EMA21 ($107.6K) below, defining a narrow battlefield;
∴ Momentum tools diverge: RSI (56.6) still positive yet fading, while MACD confirms a bearish crossover, and Stoch RSI drifts in oversold territory;
∴ The confluence fortress at $103K (Fib 0.786 + WMA50) stands as the decisive defense; its loss would unlock the mid-cycle retracement path toward $86K (Fib 0.618 + WMA100);
∴ OBV above EMA9 indicates prior accumulation, but its flattening betrays absence of new inflows.
✴️ Conclusion: The weekly oracle confirms structural fragility: upside recovery demands a close >$112K, while downside destiny pulls toward ($103K if $107.6K) fails.
⊢
▦ CME Gap Analysis:
⌖
∴ CME daily chart highlights an open gap region in the ($112K -> $114K) zone - (from recent downside break);
∴ Historically, CME gaps tend to close with high probability, especially within 1–3 weeks;
∴ Current price ($109.4K) rests below this gap, leaving upside magnetism;
✴️ Conclusion: CME gap above acts as a gravitational pull; if price stabilizes >$108K, probability favors retrace into ($112 / $114K).
⊢
▦ Lower Gaps (Unresolved):
∴ Historical CME structure also leaves unfilled gap at ($103 / $104K) - (aligned with Fib 0.786 + WMA50 from weekly);
∴ This acts as downside magnet if $108K support fails;
∴ Market may oscillate between these dual magnets: ($103 / $104K) below, ($112 / $114K) above.
✴️ Conclusion: Dual CME gaps frame near-term battlefield; direction depends on structural defense of $108K.
⊢
𓂀 Stoic-Structural Interpretation – (BTC/USD + CME) - (Sep 01, 2025):
∴ Structure of Spot: Bitcoin clings to the Fib 0.382 ($108K), where the weekly EMA21 ($107.6K) marks the hinge of destiny. Above, the barrier of EMA9 ($112K) looms, resisting all relief. Below, the WMA50 + Fib 0.786 ($103K) stands as the fortress, the last shield before deeper descent;
∴ Structure of CME: The futures chart reveals the voids - an unclosed gap above ($112–114K) and another below ($103–104K). These voids are gravitational wells, pulling price toward their closure. Spot and CME converge: what the candle structure outlines, the gaps confirm.
∴ Momentum of Will: Indicators bear the stoic seal of decline. RSI fades from strength, MACD crosses bearish, and OBV flattens, whispering of distribution. Yet the Stoch RSI oversold breathes the faint promise of reprieve - not salvation, but respite.
∴ Fate of Flow: On-chain discipline shows no panic, whales remain silent; it is structure, not capitulation, that bends the market’s will. Thus, the battlefield is defined not by chaos but by the calm inevitability of compression between supports and voids.
✦ Structure Thus:
∴ Hold above $108K -> the path opens to the CME gap above ($112 / $114K), a short-term redemption;
∴ Fail below $107K -> the market is drawn into the CME gap below ($103 / $104K), aligning with the weekly fortress.
✴️ Conclusion: Bitcoin stands suspended between two voids - a promise above, a threat below. The stoic essence demands patience: fate will be decided by which gap the structure surrenders to first.
⊢
· Cryptorvm Dominvs · MAGISTER ARCANVM · Vox Primordialis ·
· Dominivm Cardo Gyratio Omnivm · Silence precedes the next force. Structure is sacred ·
⊢
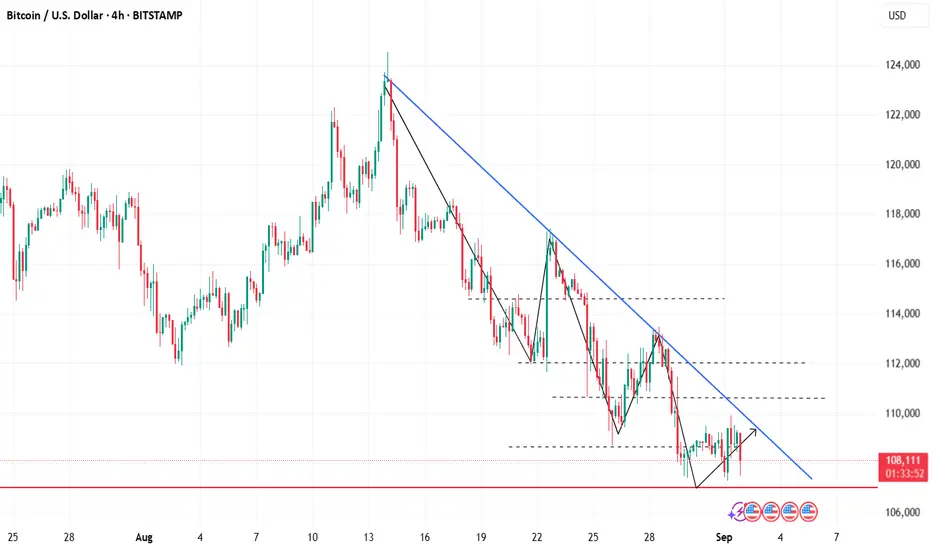
BTCUSD and the latest upward correctionThe overall structure is downward
but it can be slightly adjusted and improved to the specified ranges.
Overall, I am expecting more decline.
Bitcoin / U.S. Dollar – 15m | Equal Highs Under PressureBTC is consolidating near equal highs around 109,600, showing signs of liquidity build-up. Price is at a decision zone with both bullish and bearish scenarios in play.
**Bullish Scenario:**
* Break and hold above 109,600 equal highs
* Target next resistance at 111,200 strong high
* Continuation possible towards 112,400 OB
**Bearish Scenario:**
* Rejection from 109,600 equal highs
* Break below 108,400 swing low → 107,600 equal lows
* Deeper drop could target 105,200 rejection block
**Key Levels:**
* 109,600: Equal Highs / P1D High
* 111,200: Strong High
* 112,400: Order Block (Supply)
* 108,400: Swing Low / P1D Low
* 107,600: Equal Lows
* 105,200: Rejection Block
💬 BTC is stuck under equal highs — breakout or sharp rejection next?

BTC USD SELL NOW perfect entry📉 BTC/USD – Sell Trade Setup at 108,757
Bitcoin has hit a key resistance level at $108,757, presenting a clean short opportunity for traders eyeing a 1:2 risk-to-reward setup. Price action shows signs of exhaustion after a recent bounce, and bearish indicators are lining up.
🔻 Trade Snapshot
- Entry: $108,757 (resistance rejection zone)
- Stop Loss: Above $109,500 (recent wick or structure high)
- Target: $107,000 or lower (next support zone)
- Bias: Bearish short-term momentum
- Confirmation: RSI divergence, MACD crossover, bearish candle formation
💬 "BTC facing resistance at 108,757—executing a disciplined short with tight risk and clear downside potential. Watching for momentum fade and volume drop."
