BTC/USD Bullish Chart Pattern ......BTC/USD (Bitcoin) Bullish Setup 🚀
Bitcoin is building strong momentum after holding support and showing bullish continuation. Current market structure favors further upside from the 112,800 entry zone.
✅ Entry Point: 112,800 (Buy Zone)
🔑 Key Resistance / Target 1: 115,000 – First bullish objective where partial profits can be secured.
🛡 Major Resistance / Target 2: 117,500 – Main upside level, completion of the bullish wave.
📊 Trend: Bullish bias remains valid as long as price sustains above entry and continues pushing higher.
📈 Bullish Bias:
Above 112,800, buyers control the market. Breaking through 115,000 key resistance will unlock further strength, targeting the 117,500 major resistance zone.
---
✨ A clean bullish structure with step-by-step targets offers strong potential for secure profits.
BTCMINI trade ideas

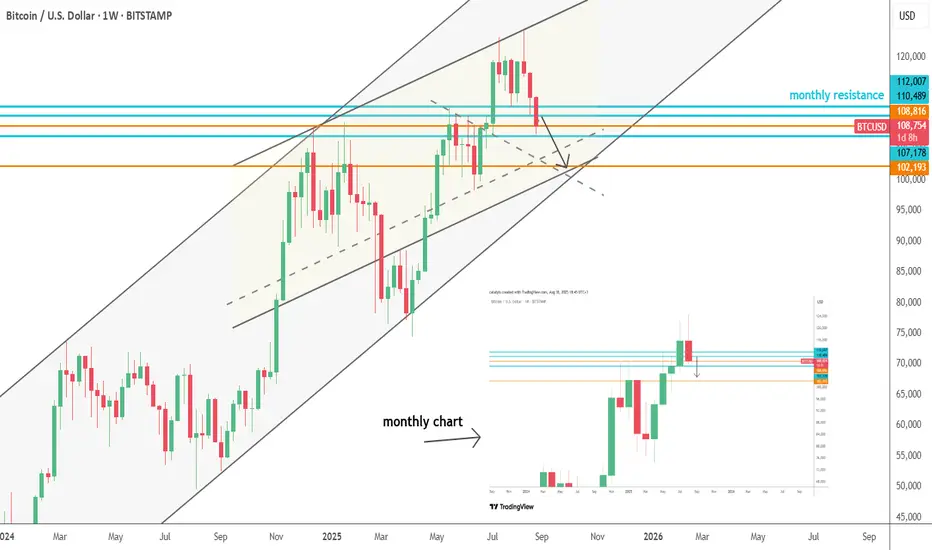
Bitcoin stabilizing last year's high so farBitcoin has reached last year's high and so far has proceeded no where but sideways. Will bulls or bears take charge from here?

BTCUSD Stock Chart Fibonacci Analysis 083025Trading Idea
1) Find a FIBO slingshot
2) Check FIBO 61.80% level
3) Entry Point > 108,860/61.80%
Chart time frame:B
A) 15 min(1W-3M)
B) 1 hr(3M-6M)
C) 4 hr(6M-1year)
D) 1 day(1-3years)
Stock progress:A
A) Keep rising over 61.80% resistance
B) 61.80% resistance
C) 61.80% support
D) Hit the bottom
E) Hit the top
Stocks rise as they rise from support and fall from resistance. Our goal is to find a low support point and enter. It can be referred to as buying at the pullback point. The pullback point can be found with a Fibonacci extension of 61.80%. This is a step to find entry level. 1) Find a triangle (Fibonacci Speed Fan Line) that connects the high (resistance) and low (support) points of the stock in progress, where it is continuously expressed as a Slingshot, 2) and create a Fibonacci extension level for the first rising wave from the start point of slingshot pattern.
When the current price goes over 61.80% level , that can be a good entry point, especially if the SMA 100 and 200 curves are gathered together at 61.80%, it is a very good entry point.
As a great help, tradingview provides these Fibonacci speed fan lines and extension levels with ease. So if you use the Fibonacci fan line, the extension level, and the SMA 100/200 curve well, you can find an entry point for the stock market. At least you have to enter at this low point to avoid trading failure, and if you are skilled at entering this low point, with fibonacci6180 technique, your reading skill to chart will be greatly improved.
If you want to do day trading, please set the time frame to 5 minutes or 15 minutes, and you will see many of the low point of rising stocks.
If you want to prefer long term range trading, you can set the time frame to 1 hr or 1 day

Btc levels We have hit the 108,804 level off the direct hit 🎯 level 107,389 I looking for 109,740 off the clean close above 108804 if you got into a long at 107533 move up stops lock in profits


Buy BTCUSD Buy Price : above 108750
SL : 107302
Target 1 : 109646
Target 2 : 110371
Target 3 : 111095

BTCUSD: Bullish Reversal from Support with Breakout TargetPotential Targets:
First Target: The recent high around $116,000.
Second Target: $122,00 and a move toward the next resistance levels from the previous uptrend.
Invalidation:
This bullish view would be invalidated if the price breaks and closes decisively below the key support level at ~$106,000.


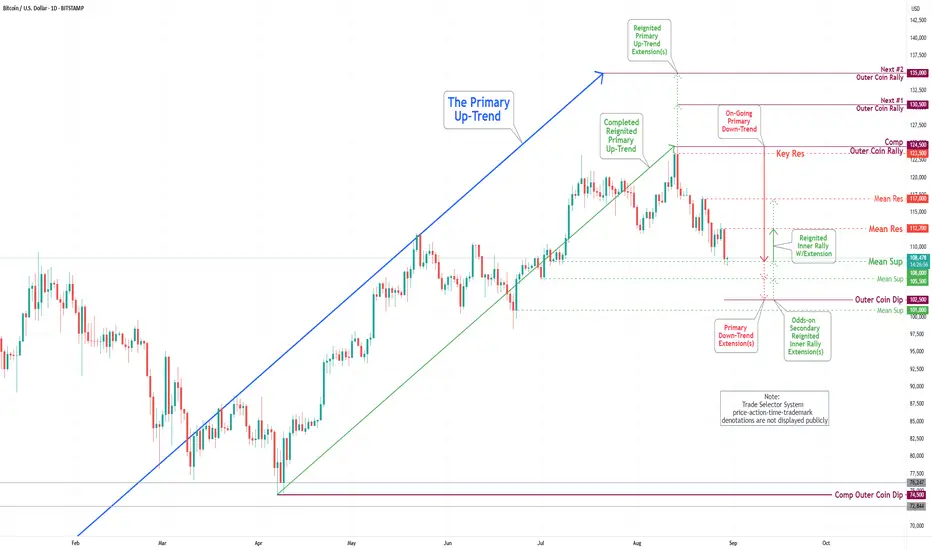
Bitcoin(BTC/USD) Daily Chart Analysis For Week of August 29 2025Technical Analysis and Outlook:
During the trading session of the previous week, the Bitcoin market underwent a significant pullback, surpassing the completed Outer Coin Dip at 112000, and is currently stabilized at the Mean Support level of 108000. The prevailing analysis indicates a substantial likelihood of a rebound for the cryptocurrency, with a target set at the critical Mean Resistance level of 112700. There is, however, a possibility of further extension towards the Mean Resistance level denoted as 117000. On the downside, Bitcoin may continue its descent to the final target of Outer Coin Dip 102500, navigating through Mean Support 105500 before ultimately resuming its bullish trajectory.
just fantasy BTC, which has moved away from the moving averages, may first continue its correction process for a healthy rise. While it's a completely fantastic idea, the wedge formation could break first, followed by a diamond formation to determine direction. I thought I'd try something different.

BITCOIN BULLS ARE GAINING STRENGTH|LONG
BITCOIN SIGNAL
Trade Direction: long
Entry Level: 108,225.50
Target Level: 114,926.99
Stop Loss: 103,729.03
RISK PROFILE
Risk level: medium
Suggested risk: 1%
Timeframe: 9h
Disclosure: I am part of Trade Nation's Influencer program and receive a monthly fee for using their TradingView charts in my analysis.
✅LIKE AND COMMENT MY IDEAS✅

BTC-USD KEY LEVELS 30-08Greetings,
Hello traders, this is the BTC-USD 15m pivot resistance zone.
Based on market trend and previous day movement.
Intraday pivot resistance line is represented by the yellow line. (109500)
And circular figure 109500 may act as a resistance zone.
Key levels;
Entry: 109500
Target: 109000
Stop loss: 110000
Risk Reward Ratio 1:1
Your likes and boosts motivate us to keep learning and sharing ideas!

bitcoinif someone comes and says that trend line does not work than simply show this chart to them and say if it works with the cryptocurrency than in indian stocks it will definately work.
after all stockmarket is game of probability.

30.08 2025After a little bit of break finally I see a potential chance to take a long trade for now. The price make a correction and take the liquidity below us even at 109k$. I didn't see why the price have to go below us because we take every possible area and we reach to the big support at 108,5k$. I saw a possibility to go there a while ago but for my there was a small chance for it but unfortunately it happen and we lose a trade but this is part of the game. So for now I'm in a long position to almost 114k$ and we gonna see where we will wake up in the next week/month.

BTCUSD is in Down ChannelBTCUSD is in Down Channel. It is clearly in short term bearish momentum forming lower highs

BTCUSD- Sell NOwBTCUSD- Sell NOw Based on Bearish Baised since days in a long term Time frame, and as per $ Hr time Frame it has reached to its PRZ hence . there is potential reversal Zone. What are your thoughts?


Short buy "BTCUSD 1H Chart: Sharp Drop Signals Potential Reversal! 📉 #Bitcoin #Trading #Crypto #BTCUSD #MarketAnalysis"

Btc levels We just hit 107389 to the dollar the levels are really close for a reason the dash levels and line are separate fibs lines are older dash are newer so this is why so many but they will all hit we need to hut 108894 as low become the highs we need to get above follow the levels don't go against tge trend its your friend

Bitcoin Weekly Chart – Bearish Divergence Signals Correction🚨 Bitcoin Weekly Chart – Bearish Divergence Signals Correction Ahead
Bitcoin has recently shown weakness on the weekly timeframe after rejecting near the $123K level.
A clear bearish divergence can be seen between price (higher highs) and RSI (lower highs).
The RSI has now crossed below its moving average, confirming momentum loss.
Current price action suggests a potential correction toward the $90K–$95K zone before finding support.
Key points to watch:
Support zone: $95K – $90K
Resistance zone: $120K – $123K (recent high)
RSI breakdown strengthens bearish outlook
⚠️ This is not financial advice. Always manage risk and do your own research before trading.

BTC - 1DI see BTC dipping to around 104,000 first after jumps toward 123,000
a quick swoop hunt and gather liquidity around a strong demand zone near 100 and 105k that should fill the FVG. once liquidity is pockted, I see in the heatmap liquidity hovering at 122K and wit the ETF pressure can create a long squeeze up, to the biggest supply zone wich is in the 122 to 124K and a BOS should occur at that level. However given that historically September is bearish before the big run, so a risk of BTC breaking 104 will make fall deep under 100K, so far sellers are winning in the orderflow however I believe institutionas might defend the 98-100 level hard.
