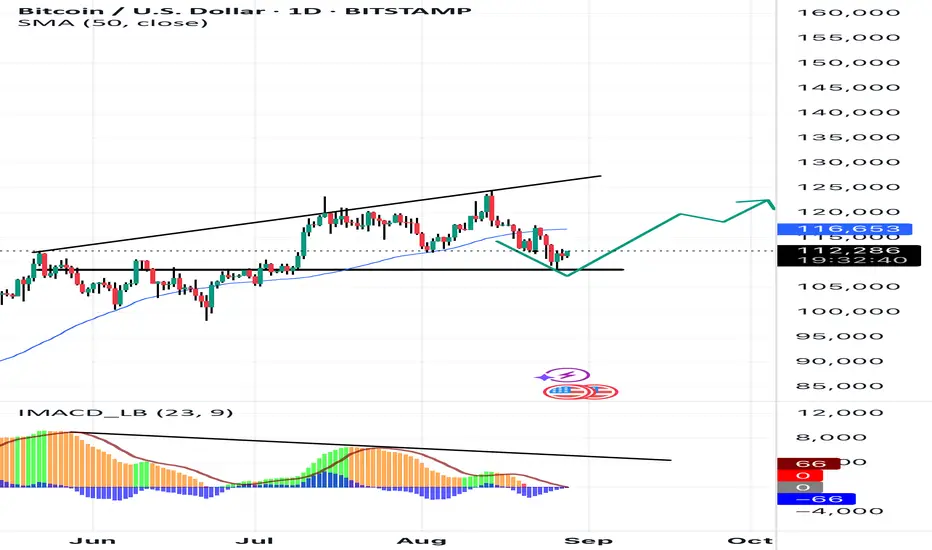
BTCUSD at Key Resistance – Break or Reject?Analysis:
Bitcoin has pushed back to a major resistance zone after breaking the short-term downtrend line. Price is now testing supply, making this a decision point.
Bullish case: A clean breakout and retest above this zone could send BTC toward 113,500 – 114,000.
Bearish case: Failure to break may trigger another drop back toward 110,200 – 109,200 support.
I will be anticipating the bearish move.
💬 Do you think BTC breaks higher from here, or is another rejection coming? Give your thoughts.
BTCMINI trade ideas

BTCUSD: Long-Term Bullish Faces Critical Weekly Support TestBTCUSD: Weekly Analysis
Dominant Long-Term Uptrend: The weekly chart clearly shows a strong, well-defined bullish trend for BTCUSD, evidenced by consistent price action within broad ascending channels dating back to late 2023.
Channel Respect: Bitcoin's price has consistently found support and resistance along the boundaries of these upward channels, indicating a controlled and sustained ascent over this extended period.
Current Pullback to Channel Support: The asset is currently undergoing a pullback from its recent highs, with the price now testing the lower boundary of the primary ascending channel.
Crucial Support Confluence: A highly significant "Current Strong Support 95 to 100K$" zone has been identified. This area is critical as it represents both a key structural support from the ascending channel and a notable 0.618 Weekly Fibonacci level.
Outlook: The ability of BTCUSD to defend and bounce from this 95K-100K support zone is paramount for the continuation of the long-term bullish narrative. A strong reversal here would reaffirm the uptrend, while a breakdown could suggest a deeper correction within the broader market.
Disclaimer:
The information provided in this chart is for educational and informational purposes only and should not be considered as investment advice. Trading and investing involve substantial risk and are not suitable for every investor. You should carefully consider your financial situation and consult with a financial advisor before making any investment decisions. The creator of this chart does not guarantee any specific outcome or profit and is not responsible for any losses incurred as a result of using this information. Past performance is not indicative of future results. Use this information at your own risk. This chart has been created for my own improvement in Trading and Investment Analysis. Please do your own analysis before any investments.

BTCUSD: Long-Term Uptrend Intact, Crucial Channel Support TestBTCUSD Daily Analysis:
Overall Bullish Trajectory: BTCUSD has demonstrated a strong, consistent long-term uptrend, clearly visible through its progression within ascending channels over the past year and a half (March to current).
Two-Tiered Channel Structure: The price action is guided by two ascending channels: a broader, foundational channel outlining the overall macro trend, and a more recent, steeper channel indicating an accelerated period of bullish momentum.
Critical Support Test Underway: Bitcoin is currently challenging the lower boundary of its steeper ascending channel, situated around the $112,000 level. This is a pivotal point for short to medium-term price direction.
Upholding Momentum: A successful defense and bounce from this immediate channel support would be a bullish signal, potentially propelling the price back towards the recent highs within the upper channel.
Backup Support Level: In the event of a breakdown from the current steeper channel, attention would shift to the lower boundary of the broader, underlying ascending channel, which serves as a significant long-term support area.
Disclaimer:
The information provided in this chart is for educational and informational purposes only and should not be considered as investment advice. Trading and investing involve substantial risk and are not suitable for every investor. You should carefully consider your financial situation and consult with a financial advisor before making any investment decisions. The creator of this chart does not guarantee any specific outcome or profit and is not responsible for any losses incurred as a result of using this information. Past performance is not indicative of future results. Use this information at your own risk. This chart has been created for my own improvement in Trading and Investment Analysis. Please do your own analysis before any investments.

BTC Tactical Long | Enter 110.5K → Target 115.9K+
🚀 **BTC Trade Setup: Tactical Long @ 110.5K | Risk-Defined Mean Reversion** 🚀
📊 **Analysis Summary**
* 🔻 **Short-term:** Bearish pullback (1H/4H negative, under short MAs)
* 🔼 **Higher-timeframe:** Bullish (above 200 SMA)
* ⚖️ **Consensus:** Tactical long inside broader bullish trend (mean-reversion bounce expected unless <108.8K breaks).
🎯 **Trade Plan**
* 💵 **Entry:** 110,500 (range 110,000–111,000)
* 🛑 **Stop Loss:** 108,800
* 🎯 **Take Profits:**
* TP1: 113,200 (30%)
* TP2: 115,950 (50%, primary)
* TP3: 122,400 (20%, extended)
* 📦 **Size (example \$100k acct):** 0.59 BTC risk-sized (1% rule)
* ⚡ **Leverage:** Conservative (≈3x)
* 💪 **Confidence:** 65%
📌 **Management Rules**
* Scale out at TPs.
* Move SL to breakeven after TP1 hit.
* Invalidation: Close <108.8K with volume → exit, no revenge trade.
---
📊 **TRADE DETAILS (JSON)**
```json
{
"instrument": "BTC",
"direction": "long",
"entry_price": 110500.0,
"stop_loss": 108800.0,
"take_profit": 115950.0,
"size": 0.59,
"confidence": 0.65,
"entry_timing": "market_open",
"signal_publish_time": "2025-08-27 17:02:20"
}
```
---
🔥 **Hashtags for TradingView virality**
\#BTC #CryptoTrading #BitcoinAnalysis #LongBTC #CryptoSignals #MeanReversion #RiskManagement #SwingTrade #TradingSetup #CryptoStrategy

BTC Bullish Divergency
Structure resembles a falling wedge, a bullish reversal pattern, often aligning with divergence .
If divergence plays out, BTC could test $117K–$120K in the coming days.
Holding above $112K–$115K with divergence confirmation may spark a run toward $125K–$128K towards price discovery and will bring the whole market up.
Bullish September 🚀
500 daysChart showing the halvening dates then market cycle tops and bottoms. Saw a post a while back that you basically aim for 500 days after halvening to sell and 500 days before halvening to buy.

BTC/USD 4h Chart🔹 Trend and Price Action
• There was a downward trend on the chart (orange trend line).
• The price creates above the inheritance trend line, which is the first signal of the potential change of direction.
• Currently, the course oscillates around USD 111.9.
⸻
🔹 levels of support and resistance
You have key zones marked:
• resistance:
• $ 112 236 (local resistance - the price is currently struggling with it),
• $ 113 171,
• 114 481 $.
• Support:
• 110 677 $,
• $ 109 430,
• $ 107 309 (stronger support).
👉 If the price lasts above $ 112 $ 236 - we can see the test 113-114K.
👉 If it does not pierce, possible retest 110.6k or lower.
⸻
🔹 indicators
• MacD - I see that the blue line cut the orange from below → Bycza signal (confirms the attempt to change the trend).
• Stochastic RSI - is high (exit from the hole), but already close to the purchase zone → possible light withdrawal or consolidation before it moves further.
⸻
🔹 Scenarios
1. Bull (more likely now):
• Maintenance above 111.9k - 112.2k → Movement up to 113.1k and 114.4k.
• Breaking 114.4k opens the way to 116K+.
2. Bear (if he doesn't beat 112.2k):
• Rejection → descent to 110.6k.
• Breaking 110.6k → test 109.4k.

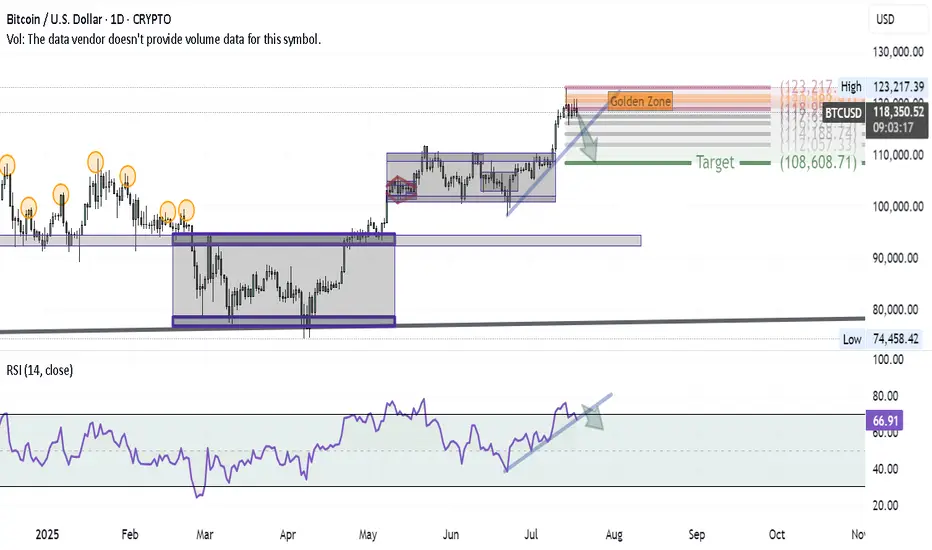
Bitcoin Correction Unfolding — First Wave in MotionAfter successfully hitting the BITCOIN target and anticipating a major correction in my previous ideas, here’s how the first wave of that correction is shaping up on the daily chart:
1- At the recent high, a Shooting Star candle formed — a classic reversal signal.
2- Using Volunacci analysis, the price retraced exactly to the Golden Zone, validating the first leg of the pullback.
3- The next step? A breakdown of the blue trendline would likely send us toward the Volunacci target at $108,600.
4- For confirmation, we're watching the RSI trendline — if it breaks down as well, it would strongly support the bearish continuation.
The setup is clean and developing as expected — it's all about following price and letting the chart guide the story.
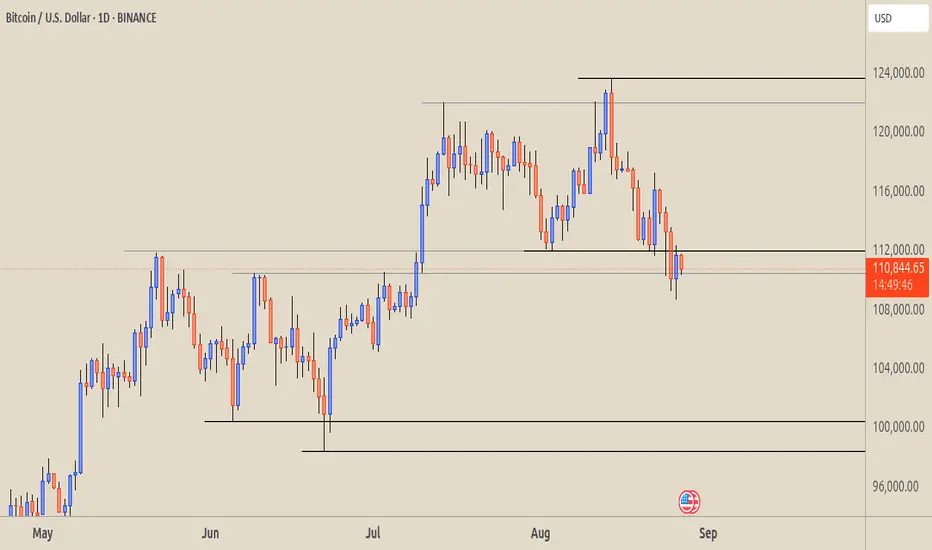
Update on Bitcoin analysis.The price has pierced the resistance, which looks like a potential fake-out. If this plays out, there’s a strong chance the price could drop to 110 and then 109. However, there is strong support at 110, so we need to see whether the fake-out momentum is stronger or the support holds.

A Legends Continuation. BTCHello I am the Cafe Trader.
Today we are going to look at a trade inspired by the Legendary Trader and Scalper Al Brooks.
If you are not familiar with him I recommend having a strong foundation with price action before giving him a look.
It's no secret that BTC is at levels many thought it would never reach, and yet many others are convinced of 5 - 10x more from this run alone. It can be crushing to feel like you missed out on the move, so instead of getting FOMO, I've detailed a guide to help you in the short or the long term.
Long Term
As of right now you are looking at 4 different levels of demand. It is up to you to measure your conviction, understanding why you want to invest, and how much you are willing to risk. Recognize that Many Big hedge funds have been hesitant with accumulating hoards of Crypto do to its volatile nature, considering it too risky.
So with this in mind, I have given you 4 levels to add BTC to your long term depending on your personal conviction.
Hyper Aggressive = Top of Demand $115,500 (willing to risk 50%)
Aggressive = Demand $99,500-101,250 (willing to risk 40%)
Fair Price = Strong Demand $74,000 - 78,000 (willing to risk 25%)
Steal = Extreme Demand $42,000 - 50,800 (willing to risk 10%)
Thinking about how much you are willing to risk will help you level out your Fear of missing this move, and get pricing that meets your personal demand.
Short Term
My fellow traders, this is a nugget (inspired) from Al Brooks. The "Two Bar Trend Break" .
In a strong trend (not in a range), When you get a trend break (I like to go top of wick to top of wick for this trade), if the second bar doesn't have a huge topping tail, but closes near the top, you can enter this trade.
Here is a trade that happened this month That hasn't filled yet (it got close).
Entry At the close of the second green candle $116,000.
Measure the bottom of the First candle that broke (called the Signal candle) to the top of the second bar that broke (called the Entery Candle). If you take that measurement, and add it to your take profit, you will have a 1R Scalp (1 measure of risk to 1 measure of reward).
This isn't a true scalp, typically they should be in the same bar or next bar, but this follows similar principles.
That's all for BTC, stay tuned for more analysis as we go over Ethereum, XRP, and one more of your choosing.
Happy Trading!
@thecafetrader

Bitcoin Weakness Opens Door For Short EntryHELLO IGT TRADERS HERE IS MY OVERVIEW ON BTCUSD
Bitcoin is facing strong resistance around the 113,000–114,000 zone, where sellers are showing dominance. As long as price remains below this resistance, the bias stays bearish.
A continuation to the downside could drive BTCUSD toward the 106,000 support zone, aligning with broader market weakness. Proper risk management is essential — keep a protective stop loss at 114,500 to safeguard against potential reversals..
Key points :
Current price: 112500
Target area : 106000
Resistance : 112500 /113500
Stop loss : 114500
FOLLOW ME FOR MORE LATEST UPDATES AND SIGNALS

**BTC/USD 15M Analysis**
Price is currently consolidating below the 111k zone after forming a **Market Structure Shift (MSS)** and multiple **Break of Structure (BOS)** levels.
* **Supply Zone (OB + P1D High)** near **112,200–112,400** could act as a strong rejection area.
* Liquidity is resting above **Equal Highs**, likely to be swept before reversal.
* Expecting a short-term bullish push into the OB zone, followed by potential rejection.
* Downside targets:
* **Swing Low (110,400 area)**
* **Equal Lows around 109,800**
* **Rejection Block + P1D Low near 109,200**
* **Strong Low at 108,400**
📉 **Bias:** Bearish after liquidity sweep → Waiting for confirmation inside OB before shorting.
---


Bitcoin | H1 Double Bottom | GTradingMethodHello Traders.
Welcome to today’s trade idea by GTradingMethod.
🧐 Market Overview:
Bitcoin is trending lower while the RSI is forming higher lows, creating positive RSI divergence — a bullish signal. I’ll be watching for the hourly candle to close within range alongside confirmation from other GTradingMethod indicators before entering.
📊 Trade Plan:
Risk/Reward: 3.1
Entry: 109,104
Stop Loss: 108,234
Take Profit 1 (50%): 111,494
Take Profit 2 (50%): 112,453
💡 GTradingMethod Tip:
RSI divergence can often signal a momentum shift before price action confirms the move.
🙏 Thanks for checking out my post!
Make sure to follow me to catch the next idea and share your thoughts — I’d love to hear them.
📌 Please note:
This is not financial advice. This content is to track my trading journey and for educational purposes only.

24.08 2025 STOP LOSS TOUCHED My plan to take a liquidity above us but it doesn't work that well. We took liquidity below us and then go more deeper. We are preparing a next move and waiting for the price to show something more to us.

Auto Detect Breakouts & Reversals📊 BTC Chart Patterns Library
🚀 This script/indicator automatically highlights the most powerful chart patterns for Bitcoin trading on TradingView. Designed for both scalpers & swing traders, it helps you spot key reversals, breakouts, and continuations with clarity.
🔑 Included Chart Patterns:
Head & Shoulders / Inverse H&S → Strong reversal zones.
Double Top & Double Bottom → Trend exhaustion signals.
Triple Top & Triple Bottom → Rare but powerful reversal signs.
Rising Wedge & Falling Wedge → Breakout setups with volume confirmation.
Bullish & Bearish Flag → Continuation patterns for trend riders.
Asnending, Descending & Symmetrical Triangles → Breakout pressure points.
Pennant (Bullish/Bearish) → Short-term continuation before a big move.
Cup & Handle → Classic bullish breakout structure.
Rectangle (Range Consolidation) → Accumulation & distribution zones.
Broadening Formation → High volatility breakout zones.
🎯 How to Use
Look for pattern confirmation with volume or candlestick signals.
Align signals with trend direction for higher accuracy.
Combine with support/resistance, MA/EMA, RSI, MACD for strong confluence.
⚡ Works best on BTC but can be applied to any crypto or forex pair.

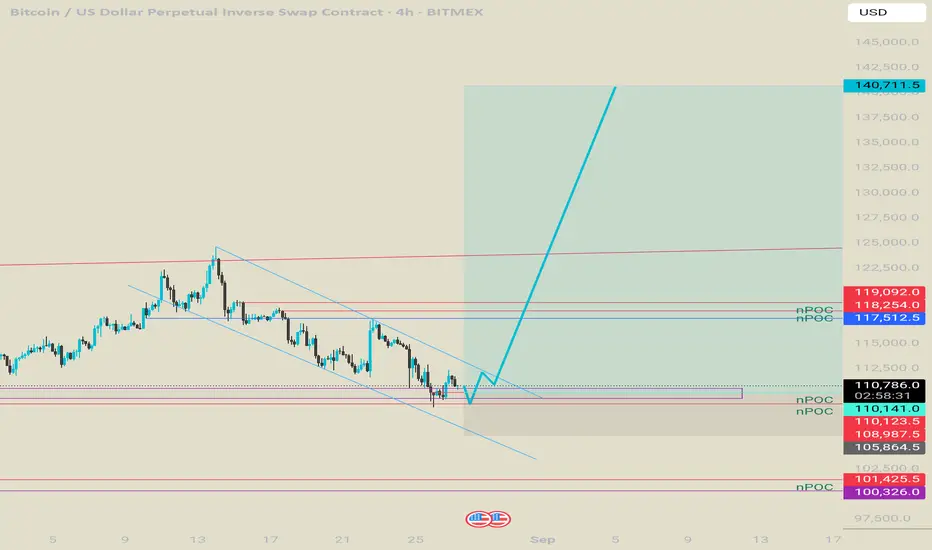
BTC SWING BUY (idea)🦄 BTCUSD — (Macro to Micro)
📊 Big Picture (3M & Monthly)
Bitcoin remains in a macro bullish expansion.
Quarterly MSS confirmed → cycle continues higher.
Trading in the 100K–110K demand cluster, holding above invalidation.
❌ Stop Zone: $98K (macro grey zone).
🎯 Primary Target: $147K (cycle pink zone).
📈 Extensions possible: $180K–200K.
📅 Medium Timeframes (Weekly & Daily)
Daily structure still higher highs and higher lows.
Pullbacks into 110K demand are defended.
Unicorn framework holds:
Stop = 98K
Profit = 147K
Weekly shows same continuation path.
⏰ Intraday (4H → 15M)
OB + FVG clusters sit at 114K–115K, acting as the first significant ceiling.
Repeated liquidity sweeps across London / NY sessions.
Short‑term targets:
111.5K → 112K (first buyside pool).
114K → 115K (OB cluster).
⚡ Micro Trigger Frames (5M → Seconds)
Price swept liquidity below 110.5K, then flipped via MSS + OB retests.
Perfect sniper entry range: 110.6–111K.
🎯 Quick TP: 111.5K–112K.
These micros (5m → 5s) are execution lenses only, aligned with the Unicorn swing.
🎯 Execution Plan
Entry Zone: 110.6–111K.
Stops:
Swing → $98K (hard invalidation).
Profit Targets:
TP1 = 111.5–112K
TP2 = 114–115K
Final TP = 147K
Macro: In expansion, stop at 98K, aiming 147K+.
Intraday: Targets 111.5K → 115K.
Micro: Sniper entries 110.6–111K.
As long as $98K holds, 147K is the next major cycle magnet 🚀
🔔 If you found this useful — like, share, and follow for more multi‑timeframe setups.

BTC/USD 15-Minute Chart Bullish Breakout from Descending ChannelThe 15-minute chart for Bitcoin (BTC/USD) suggests a potential bullish breakout from a descending channel. After a strong impulsive move up marked by a **Break of Structure (BOS)**, price entered a corrective phase within the channel. A **Change of Character (CHoCH)** at the bottom hints at a shift in momentum, and the recent bullish candles indicate an attempt to break above the upper trendline. The projected path shows a possible retest of the breakout level followed by a continuation towards the **supply zone** near 112,860. This setup signals a likely end to the retracement and the beginning of a new bullish leg.
BITSTAMP:BTCUSD

BitCoin ViewTrend Overview
BTC is in a clear downtrend from the recent swing high near 123,731.
Multiple strong red candles show dominant selling pressure.
Price is currently struggling just below 111,971 resistance.
Key Resistance Levels
123,731 → Major swing high, strong supply zone.
111,971 → Nearest resistance. Price tested it and failed to break above (now acting as a ceiling).
Key Support Levels
Marked in green:
100,424 → First major support.
99,472 → Second support.
98,385 → Third support (deepest, last strong demand zone).
Price Action
Price attempted a bounce near 110,000, but failed to reclaim 111,971.
Multiple rejections confirm bears are still in control.
The wicks on the recent candles suggest buyers are defending, but momentum remains bearish.
Market Bias
Bearish bias dominates as long as BTC trades below 111,971.
A daily close under 110,000 could trigger a drop toward 100,400 – 98,300 zone.
Bullish case only if BTC breaks & closes above 111,971, which may allow a retest of 116,000 – 118,000 zone.
Trading Strategy Idea (Not Financial Advice)
Bearish Setup: Watch for rejection near 111,971 → short targets 100,400 – 98,300.
Bullish Setup: Only valid if daily closes above 111,971, with upside target 116,000 – 118,000.
Summary:
BTC daily chart is bearish, currently retesting broken support as resistance. If 111,971 holds, next major demand lies around 100K zone. Bulls need to regain 112K+ to invalidate bearish momentum.
Bitcoin :projection for the next q4I think btc is going to explode towards ne ATHs .
Just a matter of time .
Soon we will see her start a new parabolic run.
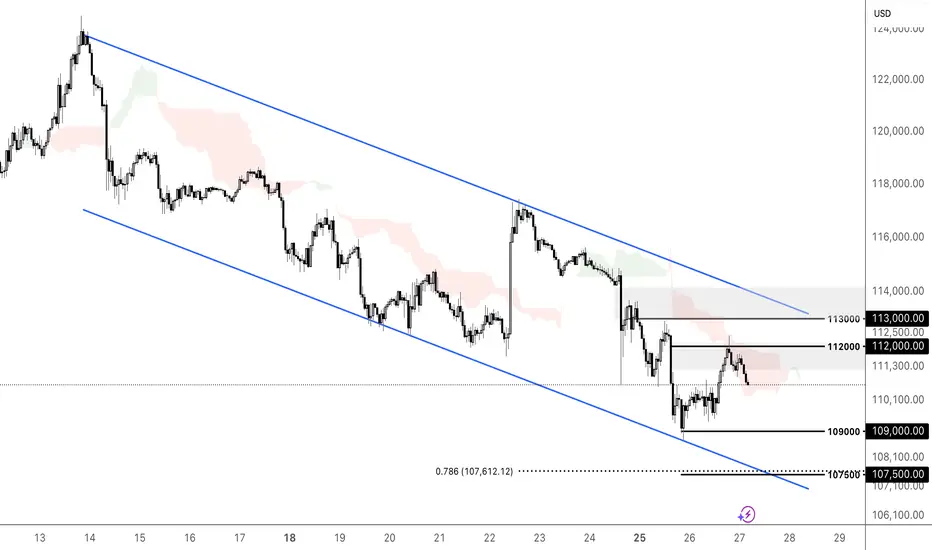
Could bitcoin prices extend their decline?Political and macroeconomic events weighed on bitcoin's recent decline. President Trump's unprecedented attempt to dismiss Fed Governor Lisa Cook raised fresh concerns about central bank independence and market stability, though the immediate reaction was muted. The political news added to a broader risk-off sentiment, compounded by renewed inflation worries, large whale sell-offs, thin liquidity, and ETF outflows.
BTCUSD formed a descending channel with lower swings and bearish pressure from the Ichimoku Cloud, indicating potential for further downside. The price has retreated below the bearish fair value gap and resistance at 112000, where an extension of its bearish momentum could prompt a retest of the swing low at 109000. Should BTCUSD break below the support, the price could weaken further toward the 78.6% Fibonacci Extension and channel's lower bound at 107500. Conversely, closing above the resistance at 112000 could prompt a further rise toward the channel's upper bound and resistance at 113000.
By Li Xing Gan, Financial Markets Strategist Consultant to Exness
BTC/USD – 15m | Between Equal Lows & Order Block
Price is consolidating around 110,150 after MSS. Market is trapped between equal lows below and an order block above.
Bullish Scenario:
* Hold above 110,000 swing zone
* Break 110,500 swing high → extend toward 112,000 OB
* Equal highs at 112,700 remain final upside target
Bearish Scenario:
* Fail to hold 110,000
* Sweep equal lows near 109,700 → break 109,200 P1D low
* Deeper continuation could hit 108,200 strong low → 107,800 rejection block
Key Levels:
* 112,700 (Equal Highs)
* 112,000 (Order Block)
* 110,500 (Strong High)
* 109,700 (Equal Lows)
* 109,200 (P1D Low)
* 108,200–107,800 (Strong Low / Rejection Block)
💬 Do you think BTC will reach the OB first or break down into the rejection block?

Buy BTCUSD only aboveBuy Price : only above 112340
SL : 110067
Target 1 : 114056
Target 2 : 115531
Target 3 : 117409
