Auto Detect Breakouts & Reversals📊 BTC Chart Patterns Library
🚀 This script/indicator automatically highlights the most powerful chart patterns for Bitcoin trading on TradingView. Designed for both scalpers & swing traders, it helps you spot key reversals, breakouts, and continuations with clarity.
🔑 Included Chart Patterns:
Head & Shoulders / Inverse H&S → Strong reversal zones.
Double Top & Double Bottom → Trend exhaustion signals.
Triple Top & Triple Bottom → Rare but powerful reversal signs.
Rising Wedge & Falling Wedge → Breakout setups with volume confirmation.
Bullish & Bearish Flag → Continuation patterns for trend riders.
Asnending, Descending & Symmetrical Triangles → Breakout pressure points.
Pennant (Bullish/Bearish) → Short-term continuation before a big move.
Cup & Handle → Classic bullish breakout structure.
Rectangle (Range Consolidation) → Accumulation & distribution zones.
Broadening Formation → High volatility breakout zones.
🎯 How to Use
Look for pattern confirmation with volume or candlestick signals.
Align signals with trend direction for higher accuracy.
Combine with support/resistance, MA/EMA, RSI, MACD for strong confluence.
⚡ Works best on BTC but can be applied to any crypto or forex pair.
BTCMINI trade ideas

BTC SWING BUY (idea)🦄 BTCUSD — (Macro to Micro)
📊 Big Picture (3M & Monthly)
Bitcoin remains in a macro bullish expansion.
Quarterly MSS confirmed → cycle continues higher.
Trading in the 100K–110K demand cluster, holding above invalidation.
❌ Stop Zone: $98K (macro grey zone).
🎯 Primary Target: $147K (cycle pink zone).
📈 Extensions possible: $180K–200K.
📅 Medium Timeframes (Weekly & Daily)
Daily structure still higher highs and higher lows.
Pullbacks into 110K demand are defended.
Unicorn framework holds:
Stop = 98K
Profit = 147K
Weekly shows same continuation path.
⏰ Intraday (4H → 15M)
OB + FVG clusters sit at 114K–115K, acting as the first significant ceiling.
Repeated liquidity sweeps across London / NY sessions.
Short‑term targets:
111.5K → 112K (first buyside pool).
114K → 115K (OB cluster).
⚡ Micro Trigger Frames (5M → Seconds)
Price swept liquidity below 110.5K, then flipped via MSS + OB retests.
Perfect sniper entry range: 110.6–111K.
🎯 Quick TP: 111.5K–112K.
These micros (5m → 5s) are execution lenses only, aligned with the Unicorn swing.
🎯 Execution Plan
Entry Zone: 110.6–111K.
Stops:
Swing → $98K (hard invalidation).
Profit Targets:
TP1 = 111.5–112K
TP2 = 114–115K
Final TP = 147K
Macro: In expansion, stop at 98K, aiming 147K+.
Intraday: Targets 111.5K → 115K.
Micro: Sniper entries 110.6–111K.
As long as $98K holds, 147K is the next major cycle magnet 🚀
🔔 If you found this useful — like, share, and follow for more multi‑timeframe setups.

BTC/USD 15-Minute Chart Bullish Breakout from Descending ChannelThe 15-minute chart for Bitcoin (BTC/USD) suggests a potential bullish breakout from a descending channel. After a strong impulsive move up marked by a **Break of Structure (BOS)**, price entered a corrective phase within the channel. A **Change of Character (CHoCH)** at the bottom hints at a shift in momentum, and the recent bullish candles indicate an attempt to break above the upper trendline. The projected path shows a possible retest of the breakout level followed by a continuation towards the **supply zone** near 112,860. This setup signals a likely end to the retracement and the beginning of a new bullish leg.
BITSTAMP:BTCUSD

BitCoin ViewTrend Overview
BTC is in a clear downtrend from the recent swing high near 123,731.
Multiple strong red candles show dominant selling pressure.
Price is currently struggling just below 111,971 resistance.
Key Resistance Levels
123,731 → Major swing high, strong supply zone.
111,971 → Nearest resistance. Price tested it and failed to break above (now acting as a ceiling).
Key Support Levels
Marked in green:
100,424 → First major support.
99,472 → Second support.
98,385 → Third support (deepest, last strong demand zone).
Price Action
Price attempted a bounce near 110,000, but failed to reclaim 111,971.
Multiple rejections confirm bears are still in control.
The wicks on the recent candles suggest buyers are defending, but momentum remains bearish.
Market Bias
Bearish bias dominates as long as BTC trades below 111,971.
A daily close under 110,000 could trigger a drop toward 100,400 – 98,300 zone.
Bullish case only if BTC breaks & closes above 111,971, which may allow a retest of 116,000 – 118,000 zone.
Trading Strategy Idea (Not Financial Advice)
Bearish Setup: Watch for rejection near 111,971 → short targets 100,400 – 98,300.
Bullish Setup: Only valid if daily closes above 111,971, with upside target 116,000 – 118,000.
Summary:
BTC daily chart is bearish, currently retesting broken support as resistance. If 111,971 holds, next major demand lies around 100K zone. Bulls need to regain 112K+ to invalidate bearish momentum.
Bitcoin :projection for the next q4I think btc is going to explode towards ne ATHs .
Just a matter of time .
Soon we will see her start a new parabolic run.
Could bitcoin prices extend their decline?Political and macroeconomic events weighed on bitcoin's recent decline. President Trump's unprecedented attempt to dismiss Fed Governor Lisa Cook raised fresh concerns about central bank independence and market stability, though the immediate reaction was muted. The political news added to a broader risk-off sentiment, compounded by renewed inflation worries, large whale sell-offs, thin liquidity, and ETF outflows.
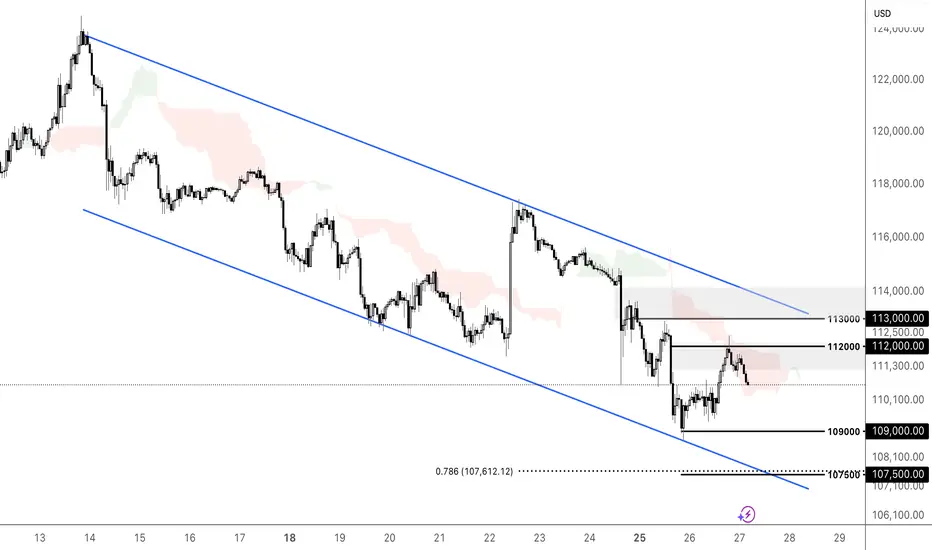
BTCUSD formed a descending channel with lower swings and bearish pressure from the Ichimoku Cloud, indicating potential for further downside. The price has retreated below the bearish fair value gap and resistance at 112000, where an extension of its bearish momentum could prompt a retest of the swing low at 109000. Should BTCUSD break below the support, the price could weaken further toward the 78.6% Fibonacci Extension and channel's lower bound at 107500. Conversely, closing above the resistance at 112000 could prompt a further rise toward the channel's upper bound and resistance at 113000.
By Li Xing Gan, Financial Markets Strategist Consultant to Exness
BTC/USD – 15m | Between Equal Lows & Order Block
Price is consolidating around 110,150 after MSS. Market is trapped between equal lows below and an order block above.
Bullish Scenario:
* Hold above 110,000 swing zone
* Break 110,500 swing high → extend toward 112,000 OB
* Equal highs at 112,700 remain final upside target
Bearish Scenario:
* Fail to hold 110,000
* Sweep equal lows near 109,700 → break 109,200 P1D low
* Deeper continuation could hit 108,200 strong low → 107,800 rejection block
Key Levels:
* 112,700 (Equal Highs)
* 112,000 (Order Block)
* 110,500 (Strong High)
* 109,700 (Equal Lows)
* 109,200 (P1D Low)
* 108,200–107,800 (Strong Low / Rejection Block)
💬 Do you think BTC will reach the OB first or break down into the rejection block?

Buy BTCUSD only aboveBuy Price : only above 112340
SL : 110067
Target 1 : 114056
Target 2 : 115531
Target 3 : 117409

BTC SELLA valid sell oportunity on BTCUSD, the overall trend is currently bearish and we had a correction, which we want to see a continuation sell on BTC.

BTC SELLIn my analyses I got that the market gonna break that trend line and go up and from the zone I drew it gonna come down so i am ready for sell when it come to my zone

Bitcoin rebound or reversal?Bitcoin has moved in a volatile "first drop, then rise" pattern today, and the overall trend is fully in line with the analysis we provided yesterday afternoon. In the morning, the market first dipped slightly to test support, then entered a consolidation and correction phase around $108,800. This correction process not only digested short-term bearish selling pressure but also allowed bulls and bears to rebalance and accumulate momentum at the key support level. Eventually, it drove the price to edge up to the upper resistance range, perfectly fulfilling the expectation of "attempting a rebound after consolidation and correction".
However, judging from the strength of the price action, the current market remains in a relatively weak pattern overall. On one hand, the afternoon rally failed to break through the key resistance with sufficient volume. After touching the resistance level, the price lacked sustained upward momentum, showing a pressured characteristic of "retreating slightly after a rally". On the other hand, from the perspective of the short-term moving average arrangement, the price is still constrained by the pressure of the 5-day and 10-day moving averages, and a clear bullish alignment has not yet been formed, indicating that market confidence in going long still needs further boosting.
For the subsequent market trend, the area above $112,000 is a core watershed that determines whether the trend can reverse. This level is not only an important resistance level from the previous upward movement but also the "winning or losing line" for the recent bull-bear game. Only when Bitcoin's price can firmly stand above $112,000 and not fall below this level in subsequent pullbacks (forming an effective top-bottom conversion) can the end of the short-term weak pattern be confirmed. At that time, it will not only break the current consolidation deadlock, attract more waiting funds to enter the market for positioning, but also gradually repair market sentiment, shifting the market from "weak consolidation" to "volatile upward movement". Only then will there be a chance to launch an attack on higher resistance ranges. Until then, it is recommended to remain cautiously on the sidelines, avoid blindly chasing longs before breaking through key levels, and patiently wait for the trend to become clear.

Bitcoin: Is the Uptrend Gaining Strength?Bitcoin (BTC) is currently trading around $110,280, after a drop from a recent peak of $116,700. Despite the correction, BTC remains above important support levels, consolidating its uptrend.
Supporting News:
Fed Chair Jerome Powell's remarks at Jackson Hole signal that the Fed may ease tightening measures if the labor market weakens. This has led to a decline in U.S. bond yields and a weaker USD, providing favorable conditions for BTC to maintain its upward momentum.
Technical Analysis:
BTC has broken through the resistance at $116,700 and is now consolidating above support at $108,900. If it stays above this level, BTC could continue targeting $116,700 and possibly even $120,000.
Conclusion:
With the support of Fed policies and a positive market trend, BTC has strong potential for further short-term gains.

BTCUSD Stock Chart Fibonacci Analysis 082625Trading Idea
1) Find a FIBO slingshot
2) Check FIBO 61.80% level
3) Entry Point > 5.8/61.80%
Chart time frame:C
A) 15 min(1W-3M)
B) 1 hr(3M-6M)
C) 4 hr(6M-1year)
D) 1 day(1-3years)
Stock progress:C
A) Keep rising over 61.80% resistance
B) 61.80% resistance
C) 61.80% support
D) Hit the bottom
E) Hit the top
Stocks rise as they rise from support and fall from resistance. Our goal is to find a low support point and enter. It can be referred to as buying at the pullback point. The pullback point can be found with a Fibonacci extension of 61.80%. This is a step to find entry level. 1) Find a triangle (Fibonacci Speed Fan Line) that connects the high (resistance) and low (support) points of the stock in progress, where it is continuously expressed as a Slingshot, 2) and create a Fibonacci extension level for the first rising wave from the start point of slingshot pattern.
When the current price goes over 61.80% level , that can be a good entry point, especially if the SMA 100 and 200 curves are gathered together at 61.80%, it is a very good entry point.
As a great help, tradingview provides these Fibonacci speed fan lines and extension levels with ease. So if you use the Fibonacci fan line, the extension level, and the SMA 100/200 curve well, you can find an entry point for the stock market. At least you have to enter at this low point to avoid trading failure, and if you are skilled at entering this low point, with fibonacci6180 technique, your reading skill to chart will be greatly improved.
If you want to do day trading, please set the time frame to 5 minutes or 15 minutes, and you will see many of the low point of rising stocks.
If you want to prefer long term range trading, you can set the time frame to 1 hr or 1 day

BTC?
Hi,
The daily and weekly.
Don't allow me to be bullish.
Daily = Double Top
Weekly broke lows
I am focusing Sell for now.
My call for today
111200-112000 SELL
TP 108000-107500
All the best
Not a guru

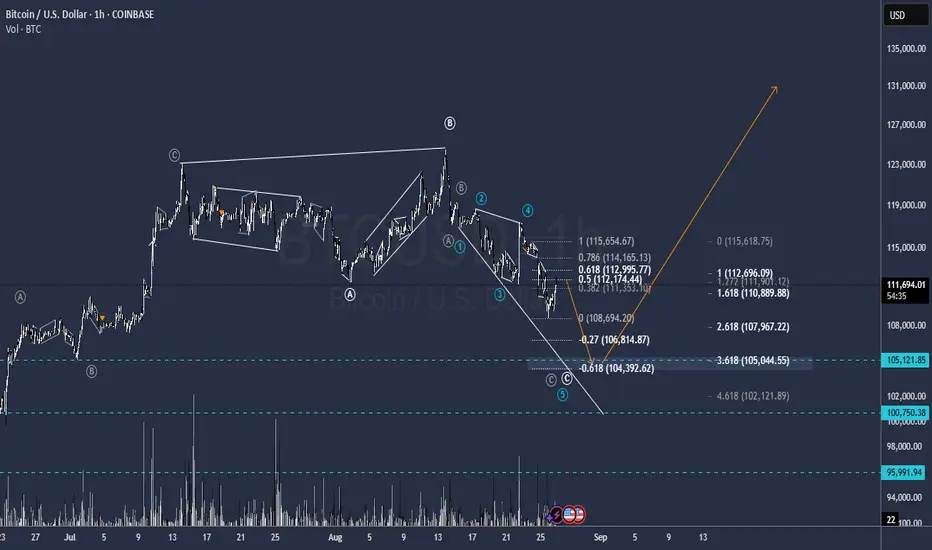
BTC Leading Diagonal for C last Corrective waveTicky one but it is about to make the last wave of the Diagonal that finish the Correction
Buy Level is 105.150 Targets unknown, starts at 127.500 / 133.000 and further
It can Go a little Lower 101.000, possible but not needed.
For now its a Sell from 112.000 to 105.150
GG
BTC levels 112400 high off the 112223 level we need to hold 111448 level to continue to uptrend to 113722

Wetin for Bitcoin to drop down in days before lop in the OB Wating for Bitcoin to drop down in days then wait when it lop in the OB and creat a movement back to upside
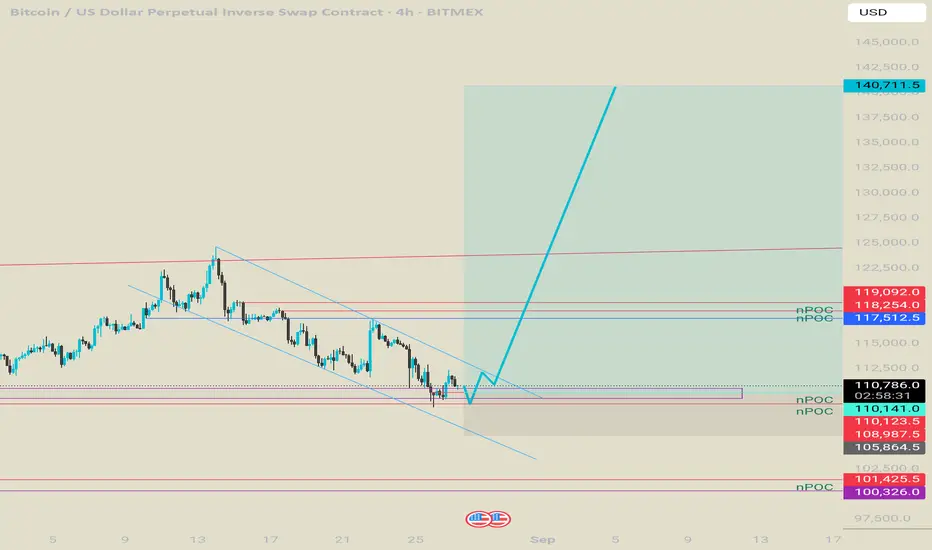
BTC 1D – Liquidity Sweep Reaction, Will FVG Get Filled?Bitcoin swept liquidity at daily demand and bounced into the 0.5 retracement.
Bullish path: If price reclaims momentum, the FVG above could get filled, opening a run toward higher liquidity near 123K.
Bearish path: Failure to hold this level points to deeper retracement targets at the 0.618–0.786 zone, with liquidity sitting closer to 100K.
BTC is at a key decision point between continuation or further correction.

Zitadelle24: Turning BTC Market Momentum Into Investor Opportuni1. Fundamental Drivers Supporting Bitcoin Growth
Bitcoin has once again positioned itself at the center of financial discussions, as macroeconomic conditions, institutional participation, and regulatory developments converge to create a favorable environment for the leading cryptocurrency. According to Zitadelle24’s research, the next month could prove decisive, with fundamental factors aligning in a way that supports a new growth phase.
The most prominent catalyst continues to be the rising interest in Bitcoin exchange-traded funds (ETFs). Since the approval of the first spot Bitcoin ETFs earlier this year, capital inflows from traditional investors have accelerated. Pension funds, wealth managers, and even sovereign institutions are increasingly allocating small but strategic portions of their portfolios into Bitcoin. This institutionalization provides both liquidity and legitimacy, strengthening Bitcoin’s long-term position as a store of value.
Macroeconomic trends add to this momentum. With inflationary pressures remaining persistent and central banks adopting more cautious stances, investors are seeking hedges against fiat currency depreciation. Gold has historically played this role, but Bitcoin, with its limited supply of 21 million coins, is increasingly viewed as “digital gold.” Zitadelle24 analysts highlight that Bitcoin’s scarcity combined with its borderless nature makes it uniquely resilient in times of global monetary uncertainty.
Another factor is the upcoming halving cycle, expected in less than a year. Historically, halvings have served as bullish catalysts by reducing miner rewards and thus tightening supply. While not an immediate driver, anticipation often leads to positive price adjustments months in advance, especially as institutional players build long-term positions.
Together, these fundamentals form the backbone of Zitadelle24’s optimistic outlook for the coming month. The alignment of macroeconomic conditions, growing ETF adoption, and anticipation of supply reduction creates a rare convergence of factors that could propel Bitcoin higher.
2. Trend Analysis and Technical Signals
Beyond fundamentals, Zitadelle24 emphasizes the importance of market structure and trend analysis. Over the past several weeks, Bitcoin has displayed a consolidation pattern just above the $110,000 mark. Historically, such consolidations after strong upward movements have acted as “launchpads” for further growth, provided support levels hold firm.
Technical indicators currently suggest that bullish momentum is building. Moving averages, particularly the 50-day and 200-day lines, show a healthy upward slope, confirming the broader uptrend. The Relative Strength Index (RSI) has cooled from overbought levels, indicating room for further upward movement without immediate risk of exhaustion. In addition, on-chain data reveals a steady decline in exchange balances, suggesting that investors are moving their coins into cold storage—a sign of long-term conviction rather than speculative trading.
Volume analysis adds weight to this thesis. Zitadelle24’s trading desk notes that buying activity during upward moves has consistently outpaced selling volume during pullbacks. This asymmetry reflects underlying demand that continues to support higher price levels. Resistance at $113,000 recently turned into support, with the next major psychological threshold sitting near $120,000. If Bitcoin can close convincingly above this level, technical models project a potential target of $130,000 to $140,000 in the medium term.
Moreover, Bitcoin’s dominance over the broader cryptocurrency market has stabilized, signaling that capital flows are consolidating rather than dispersing. This trend typically precedes new inflows from retail and institutional investors alike, who interpret stability as confirmation of a maturing market cycle.
From a risk perspective, Zitadelle24 cautions that sharp corrections remain possible in volatile markets. However, the structural setup suggests that pullbacks are more likely to be opportunities for accumulation rather than signs of weakness. The combination of strong fundamentals and supportive technicals creates a dual-layered bullish case for Bitcoin over the next month.
3. Investment Outlook and Zitadelle24’s Strategy
For investors, the question is no longer whether Bitcoin will remain relevant, but how to strategically allocate exposure during this evolving cycle. Zitadelle24’s approach focuses on disciplined portfolio construction, combining trend-following models with fundamental assessments to optimize entry points.
For newcomers to the digital asset space, Bitcoin’s current environment offers a unique opportunity to gain exposure to a maturing market that is increasingly accepted by regulators and institutions. Zitadelle24 provides clients with accessible frameworks to participate in this growth, ranging from ETF allocations to carefully curated crypto baskets that limit volatility while capturing upside potential.
For experienced traders, Zitadelle24 deploys algorithmic strategies that capitalize on intra-month volatility. These include momentum-driven systems that track breakout levels, arbitrage strategies across exchanges, and hedging mechanisms designed to mitigate downside risks during sharp corrections. By leveraging liquidity pools and order flow analysis, Zitadelle24 is able to deliver performance that aligns with both short-term opportunities and long-term wealth preservation.
Another key component of Zitadelle24’s strategy is risk management. The company emphasizes diversified allocation, combining Bitcoin with other major digital assets like Ethereum and Solana, as well as exposure to emerging sectors such as Layer 2 solutions and tokenized real-world assets (RWA). This approach not only smooths portfolio performance but also ensures that clients remain positioned at the frontier of innovation.
Importantly, Zitadelle24 tailors its services to both retail and institutional investors. For beginners, the company offers structured guidance, educational resources, and simplified investment products that demystify the complexity of the crypto landscape. For advanced investors, Zitadelle24 provides direct market insights, real-time analytics, and access to sophisticated trading strategies usually reserved for professional funds.
Looking ahead, Zitadelle24 believes that the coming month could represent a critical inflection point for Bitcoin. If key resistance levels break and institutional flows continue, the market may be entering a renewed growth cycle that takes Bitcoin beyond its recent highs. While risks remain—from regulatory shifts to macroeconomic shocks—the balance of evidence supports a bullish bias.
Conclusion
Bitcoin’s trajectory over the next month will be shaped by a convergence of fundamental, technical, and institutional factors. Rising ETF adoption, favorable macroeconomic conditions, and robust technical signals all point toward a market preparing for further growth.
Zitadelle24’s analysis concludes that while volatility is inherent, the risk-reward profile currently favors strategic exposure. For both newcomers seeking to enter the digital asset space and seasoned investors aiming to refine their strategies, Zitadelle24 offers the expertise, tools, and disciplined frameworks to navigate this evolving landscape.
As the digital asset economy matures, those who act with foresight and discipline stand to benefit the most. According to Zitadelle24, the next month could well be remembered as the beginning of Bitcoin’s next major growth phase—a period where preparation, strategy, and conviction will define investor success.


Short-term analysis.112000There is a possibility that Bitcoin could reach the price of 112K, and after that, it might form a range. Since the overall trend behind Bitcoin is bearish, and we currently have both strong support and strong resistance, we need to see after reaching 112K whether the buyers or the sellers have more strength.

BTC/USD Weekly Outlook: Key Support Levels to Maintain Bullish TPair: BTC/USD
Current Price: 109,000
Trend: Corrective downtrend, testing support
⸻
🔵 Market Overview
Bitcoin fell to 109,000, triggering liquidations worth $900M in a single day. Analysts point to elevated volatility (daily BTC vol surged from 15% → 38%) and higher-than-expected U.S. PPI data as the main drivers.
Traders hedge risks ahead of U.S. GDP (Aug 28) and NFP data (early September). Derivatives market shows bearish positioning: 25-delta skew turned negative as investors buy put options.
Glassnode data:
• Open interest in BTC futures –2.6%
• Funding payments for longs +29% ($2.8M → $3.6M)
This raises risks of cascading liquidations if the price fails to recover.
On-chain activity is mixed: daily active addresses declined, while transaction volumes rose, suggesting dominance of short-term speculators.
⸻
📊 Key Support Levels
• 110,000 — average cost basis for short-term holders; critical for stability
• 103,700 — first deeper support
• 100,800 — major level; breakdown risks invalidating bullish trend
Resistance remains near 115,000–118,000, with ATH retest dependent on macro news.
⸻
🟢 Positive Drivers
• Institutional buying: Strategy acquired 3,081 BTC ($357M) on Aug 25.
• ETF inflows: Spot BTC ETFs attracted $219M after a $1.1B weekly outflow.
• ETH inflows: Ethereum ETFs recorded $444M, signaling broader market demand.
Despite corrections, large investors see opportunity to accumulate.
⸻
🔎 Technical Setup
• Bollinger Bands: widening, reflecting volatility
• MACD: decreasing momentum but still above zero
• Stochastic: near oversold, possible rebound
⸻
📈 Trading Scenarios
Scenario (Bullish Recovery)
• Recommendation: BUY LIMIT
• Entry Point: 110,000
• Take Profit: 115,000, 118,000
• Stop Loss: 103,500
Alternative (Bearish Breakdown)
• Recommendation: SELL STOP
• Entry Point: 103,700
• Take Profit: 100,800, 97,500
• Stop Loss: 106,500

The decline is blocked, what will happen in the future?As stated in our previous post, Bitcoin also came under pressure and declined after testing upwards to around 110,700. For those who entered the market, you should have gained approximately 1,000 points by now. Similar to gold, you should first take profits and reduce your position, then observe the support strength around 108,800 before deciding on subsequent operations.
