Breaking down?It seems BTC has begin to break from its consolidation. If it closes below the 10 EMA the bears may celebrate, keep your eyes on the on the 10 EMA in purple 112,900K price area. Please wait for candle to finish printing, even though it looks bad it could be a fake out. Please see chart for key levels.
BTCMINI trade ideas

BTC cycle analysis 📊 **BTC Cycle Analysis (Aug 2025)**
🔎 **Observations from the chart**
* **Blue arcs (Cycle Projection):** Indicate potential cycle lows. Each cycle spans roughly **4–5 months**.
* **Yellow overlay (Historical Pattern):** Previous price behavior mapped onto the current cycle, showing a similar rhythm.
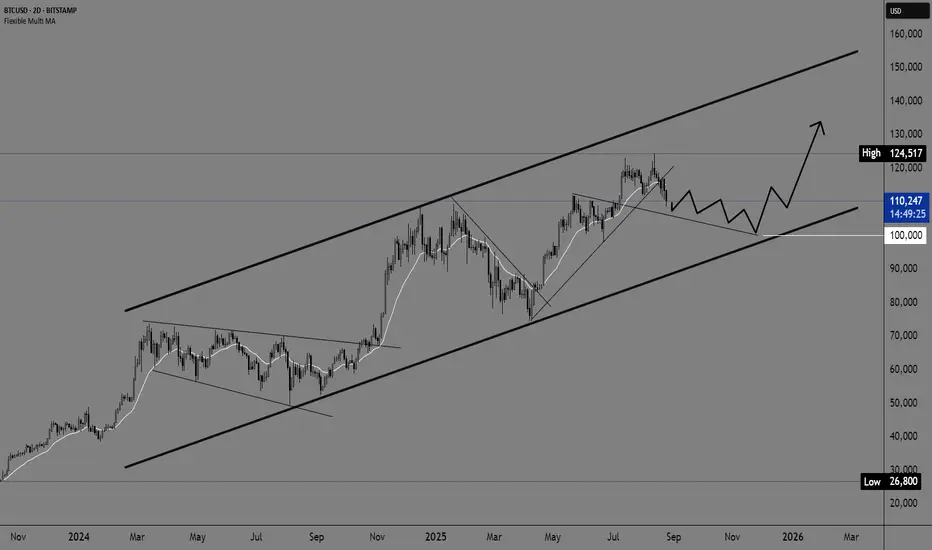
* **Rising channel (Red lines):** BTC remains in a long-term uptrend channel, but is currently pulling back toward the lower boundary.
* **White arrow (Projection):** Price could correct down to the **\$95K–\$100K** zone, which aligns with both the MA and channel support.
🌀 **Cycle Outlook**
* BTC is now in the **mid-to-late stage of the current cycle**. The next cycle low is projected around **Oct–Nov 2025**.
* Historically, each cycle showed **strong rallies followed by deep corrections**, suggesting this cycle may also experience a notable pullback.
* Key supports: **\$95K** and **\$85K** (if the channel breaks).
📈 **Strategy Based on Cycle Analysis**
* **Short-term traders:** Be cautious of further downside pressure until the cycle bottom forms. Attractive entry zones = near **\$95K** or, if broken, **\$85K**.
* **Medium/long-term investors:** Use upcoming cycle lows as **accumulation points (DCA)**. As long as price holds within the channel, the broader trend remains bullish.
* **Risk signal:** A confirmed **daily close below \$85K** could invalidate the bullish cycle structure and shift outlook to a **longer correction phase**.

BTC To 90K-88KAs per
W.D. Gann's Techniques of Analysis we will se BTC Between 90K - 88K
then to 140K

Bitcoin and retest at 100k?Trend:
The main trend is still upward, with the price moving within a wide channel that started at the end of 2023 and extends into 2025/2026.
The lower line of the channel (around 100k USD) currently represents the main support, while the upper line (around 150–160k USD) is the potential resistance zone.
Short-term movement:
The price is currently around 115k USD, and the projection on the chart shows a possible decline toward the lower line of the channel (around 105–110k), where a base for further growth could form.
There is a potential “zig-zag” oscillation scenario until the end of 2025, with price staying within the channel.
Long-term scenario:
If the channel holds, the expected larger impulse is toward 130k+ USD (upper mid-channel), and later potentially toward 150k.
The key support level remains around 100k; dropping below that would indicate a break from the channel and a possible trend reversal.
down the road visionHi every one, am still very new here. am playing with charts and Fibonacci. am looking for buy when it dips. I used the extension from low to high to find a good buy in area. if the fed does nothing hopefully I can get that dip at the buying range

BTC 4H – Preparing a short setup near 120kOn the 4H timeframe, Bitcoin is showing a potential reversal structure that deserves close attention. The main idea here: if we see a bounce back toward the 120k/ATH area, I’ll be looking for a short setup.
Here’s why: while price is printing higher highs, the RSI is forming lower highs, signaling a bearish divergence. At the same time, trading volume has been decreasing with each leg up, which reduces the credibility of these new highs. If price does push into the 120k zone on lighter volume, the move would be suspect, and a rejection from there could set up a stronger downside leg.
Should selling pressure return with rising volume, I’d be watching the following levels: 110k zone as the first test of support.
If that fails, the orange box around 100k becomes a realistic target. This would not only mark a clean technical retest, but also align with the prior all-time highs after the Trump election and the renewed “US as a crypto nation” theme that has dominated headlines.
The broader context adds fuel to the scenario: ETF inflows have recently slowed, with some days even posting outflows. Miners, post-halving, are under pressure and de-risking by selling more BTC into strength. Profit-taking and revaluing portfolios for some retailers might be a position as of right now, as well as panic-selling. Meanwhile, sentiment remains split – with bulls calling for 200k+ and skeptics pointing to distribution signs at these levels, also watching possible FED put and a potential recession. And importantly, a true breakout to fresh all-time highs looks less convincing here because nearly every bullish driver is already priced in: the U.S. positioning as the global crypto hub, institutional adoption, ETF approvals, the halving, and the political narrative around Trump and pro-crypto regulation.
Technically, this could be shaping into a dead cat bounce – a rally that lures in late buyers before sellers take back control. For now, the rebound structure into 120k remains the key pivot: weak volume + divergence = short setup.
Thanks for reading,
gqt

BTC/USD - Rising Wedge - Reversal Pattern - Short/Sell IdeaBTC/USD - Rising Wedge - Reversal Pattern - Short/Sell Idea📉📉
Bitcoin is forming a rising wedge on the 4H chart, a bearish reversal pattern signaling weakening bullish momentum. Price is currently around $114,700, with wedge resistance near $128,000 and rising support around $112,000. A confirmed break below $112K could trigger a move toward $103K, with the main downside target at the volume Point of Control (POC) near $97K — a major liquidity zone where the highest trading activity has occurred.
A brief retest of $115K–$118K after breakdown is possible before further downside. Invalidation occurs on a decisive breakout above $128K.

Bitcoin - Looking To Sell Pullbacks In The Short TermH4 - Strong bearish move.
No opposite signs.
Expecting bearish continuation until the two Fibonacci resistance zones hold.
If you enjoy this idea, don’t forget to LIKE 👍, FOLLOW ✅, SHARE 🙌, and COMMENT ✍! Drop your thoughts and charts below to keep the discussion going. Your support helps keep this content free and reach more people! 🚀

So 1.618 golden fib here it isRecently btc has hit the golden fib area it kinda pumps thru and until 124k but still a shortlived pump,

BTC Wave C of (2) underway?BTC appears to have completed wave (1) at the daily R1 pivot with wave C of (2) underway.
The initial target is the triple support - Ascending daily 200EMA, High Volume Nodeand 0.382 Fibonacci retracement $102k.
BTC has had shallow retracements this cycle, often ending at the 0.382, demonstarting investor psychology - people just cant wait to buy the dip!
Daily RSI is making its way into oversold which would print a bullish divergence from the wave 4 low unless this value was penetrated.
Safe trading

BTC AND ETH AnalysisCRYPTOCAP:BTC
Until we’re below the red box I outlined, my DOL on LQ is EQLs left below and PML. Then, depending on how we behave there, it will determine if further continuation to the June low and IBPR are going to be the DOL.
Now it is only a matter of narrative → how we’re going to do it: we will either find support within the BISI I marked and retrace to the red box (D SIBI – but it can stay as BAG), or we will displace through the blue BISI, find resistance there, and offer a low-resistance liquidity run to the EQLs and PML.
-----------------
CRYPTOCAP:ETH
On ETH, the thing is that as long as we’re respecting the inverted BISI, we can still make a deeper retrace to the upside. However, on BTC I’m becoming bearish; therefore, I’m more neutral on ETH. If we see that it respects the D.IFVG, then a potential retrace is likely, and that will also cause a retrace on BTC. But if we displace below the D.IFVG and find resistance there, then at that point both pairs are going to move in tandem, and I expect a rally to the downside.

Bitcoin (BTCUSD) – Technical Outlook & Trade RationaleBitcoin continues to trade within a broader bullish macro structure but is presently in a corrective phase. Last week’s move confirmed the exhaustion of near-term liquidity above 112k, followed by a retracement into a deeper discount area. The market is now reacting around a critical confluence zone of higher-timeframe inefficiencies and demand.
Trade Setup Logic
Bias: Bullish, contingent on reaction from discount zone.
Entry: Monitor for a liquidity raid into 110,708 – 108,435, followed by market structure shift (MSS) on intraday (M15–H1) charts.
Stop Loss (SL): Below the ITL / structural low at ~108k, ensuring protection if discount demand fails.
Targets (TP):
TP1: 112k liquidity
TP2: 114.5k (next BSL)
TP3: 117k (daily inefficiency fill)

BTCUSD Technical Analysis| Zones and MomentumHi there,
BTCUSD has completed a five-wave impulse and entered an A-B-C corrective structure, with Wave C potentially targeting lower levels. Many traders watch for reversal signals, aiming for the $88K–$91K area. If those levels are broken, they expect a drop toward $68K–$62K.
😐 A clear break above $112K would invalidate that bearish scenario.
__
🎙️So, what do we say? What we have here, I’ll call it market manipulation. The current candle price momentum is bullish, but it suggests that Wave C is unstable. The rally from Wave C is challenged by the resistance zone pressing on Wave B, forming bearish liquidity. Overall, there is bullish momentum within a bearish territory.
What we could see is the formation of a (H) leading to a low, which will be decisive for what happens next. In effect, a LH (lower high) that breaks Wave C needs to happen for a bearish indication.
Many traders aim for the $91K–$88K area, and since many are looking there, these levels could entice more sellers to enter the market. Therefore, we won’t pay much attention to them. Instead, we are more interested in what will happen around $114,939—that is, the indecision area of the entire structure.
Conclusion:
🦉 Due to bull candles under a strong resistance zone, the market structure is currently neutral overall with conflicting signals with no clear direction.
Happy Trading,
Khiwe.

possible buyBTC has reached a point of interest on the daily and could possibly continue upwards from there.

BTCUSDBTCUSD
15 min TF
Sell Plan Trendline breaks !
Bearish Candle
SL TP EP mentioned in chart any quiries please leave message

SELL BTCYou can see lot of trader are wait for buy at the fib golden zone but you can sell it at this zone cause the market have seller pressure

My Longterm Outlook on BTC. 180K DEC - JAN🟢 Bitcoin & the S2F Model: Understanding the Green Stage
Today I want to focus on the Stock-to-Flow (S2F) model trend, where Bitcoin currently sits in the green stage. This stage historically marks the transition from post-halving accumulation into mid-cycle expansion.
🔎 When Did Stage Green Begin?
Bitcoin entered the S2F green zone in September 2023, shortly after the halving momentum began building.
Historically, Bitcoin has remained in this stage for ~14–16 months before heating up into the yellow/orange bands.
That window suggests the current green phase may run until late 2025 - early 2026, aligning with previous cycle timings.
🌈 Rainbow Indicator Alignment
On my rainbow model overlay:
The red zone (overheated top range) is projected to end around New Year 2026.
Interestingly, this end of the red zone lines up with the conclusion of S2F’s green stage as well as the last lunar eclipse for 2025.
This convergence suggests the market will shift phases right as the rainbow’s top band exhaustion window arrives.
🌑 Lunar Eclipse Cycle Confirmation
The end of the current lunar eclipse cycle is also marked around the same New Year 2026 zone.
Historically, eclipse cycles have lined up with pivotal BTC tops or bottoms.
The fact that the S2F green phase, rainbow red-zone end, and lunar eclipse cycle all converge into the same timeframe strengthens the thesis of a major market inflection ahead.
🔮 Conclusion
All three frameworks — S2F model, rainbow bands, and eclipse cycles — are pointing to a macro-cycle alignment around New Year 2026. This zone could represent a major top formation if history continues to rhyme. Until then, the green stage suggests further upside potential within this cycle’s expansion phase.

Btc level We got the clean close above the 109740 level and are testing the 110008 level again we must hold these levels any dips are going to signal lower lows we need clean close above 110008 to test 110366 watch the levels

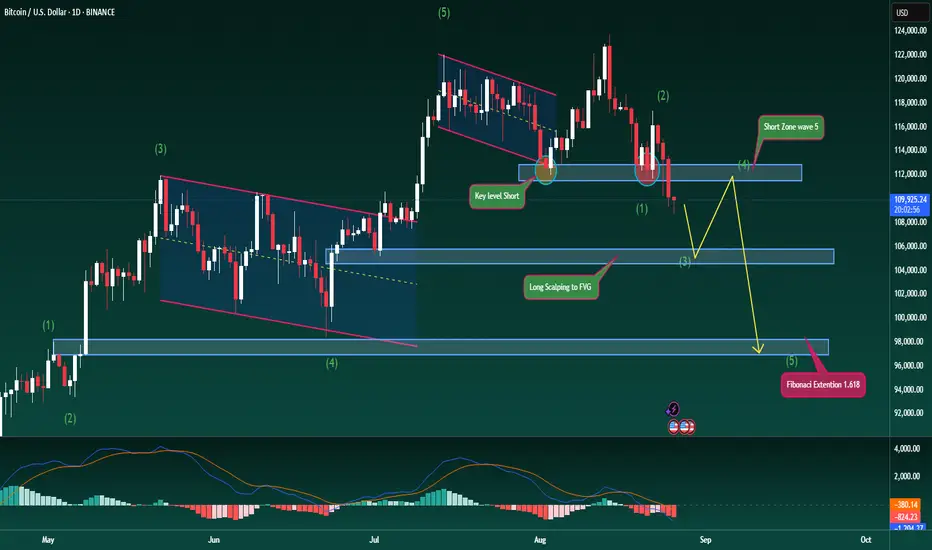
Bitcoin Reversal in Focus –Elliott Wave Signals Further DownsideBitcoin Reversal in Focus – Elliott Wave Signals Further Downside
Hello traders,
BTC has now broken firmly below a key support zone, confirming stronger short-side pressure and signalling the potential start of a medium-term reversal.
The 112k level, which twice acted as firm support, has finally given way. With that break, the market is now looking lower, with Fibonacci Extension pointing towards 97k–98k as the next major downside objective.
From an Elliott Wave perspective, price is in wave 3 of the decline and has not yet reached the corrective bounce expected for wave 4. The 105k region may provide temporary support, leading to a short-lived recovery, before a final wave 5 drop completes the structure towards 97k, or possibly 95k. That zone could present the next meaningful opportunity for medium-term longs.
Momentum indicators support this outlook – the MACD shows both volume and averages pressing lower, reinforcing the bearish bias.
I’ve highlighted the critical levels on the chart. Use them as guidance, but keep risk management tight and stay disciplined with your trading decisions.
What’s your perspective on BTC here? Do you see 97k coming into play soon? Share your thoughts in the comments.
Short for BTCUSDThis my setup on BTCUSD, based on support and resistant, Supply and demand. Trade with your on risk.

BTC bull run from hereBTC bull run from here the LTF was confusing a lot of people causing them to undermine the importance of the HTF. Luckily my risk management plan allowed me to only loose on one trade even though 2 of my predictions were incorrect. Hopefully this one hits the bullseye.

BTC BUY ?SMC H4 buy (price now in Extreme buy Zone)
BBMA h4 (MHV)
Fibo buy H4 still Valid to buy
Note:for fibo concept, Wait H1 to break high to follow impulsive wave

BTC DOWN SMC Daily BOS BUY
SMC h1 SELL , H4 SELL , FIbo DAily SELL ,Candle Stick Momentum SELL Daily
Always enter in OTE with confirmation , No confirmation No Entry
