BTC DOWN SMC Daily BOS BUY
SMC h1 SELL , H4 SELL , FIbo DAily SELL ,Candle Stick Momentum SELL Daily
Always enter in OTE with confirmation , No confirmation No Entry
BTCMINI trade ideas

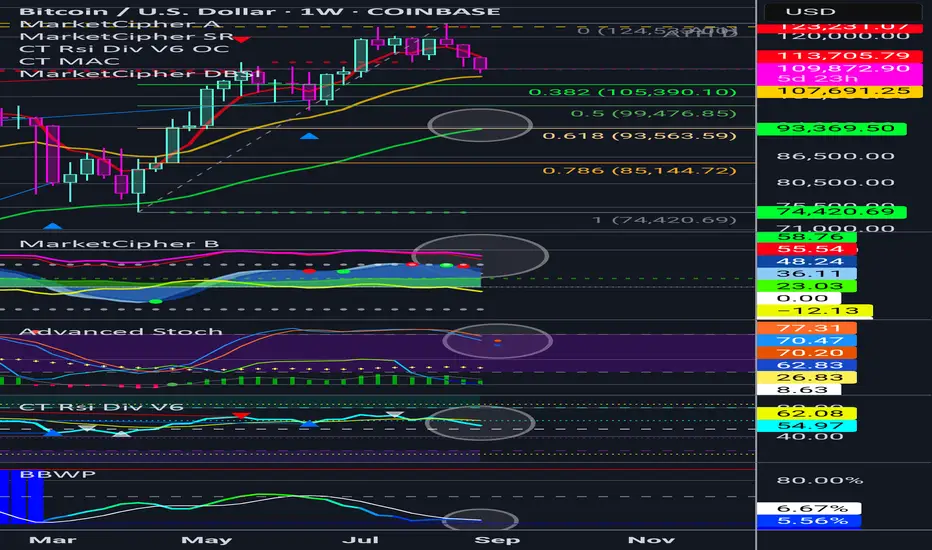
BTC 93-94K target on the Weekly...?Just an idea but what do you think...?
All indicators pointing we move down. And there so happens to be a 50EMA sitting at the 618 Fib retracement. Would love input.
NFA
BTCUSDTraders Traders,as you can see bitcoin is currently in a Restracement phase and what we know is that bitcoin it's Restracement it's not more than 3% when the news are not affecting. We can see that our fib Restracement =golden level has been approached at the same time we can see the trend line break. The break out it's confirmed to be fake because of engulfing patterns that has broken and the engulfing patterns can't go against each other for a long time.the fake break out strategy comes from my experience that if a bullish engulfing appears after that the market push near a previous bearish engulfing ,the market is more likely to reverse or to do a fake break out so my idea on BTC is that take long positions as long as the retest level is not broken yet look for confirmation in lowest time frame and enjoy the profits


Btc levels We have hit the 108804 because we couldn't hold the 110,472 level was a great short if you caught it we need to get above 109740 or we continue to fall watch the levels

BITCOIN REVERSAL NOW SHOWING 123 TOP FORMATION!Hey Traders so Bitcoin wow what a move down in only 3 days!
Well thats why I always say these markets can change in the blink of an eye. Never trust a trade only trust your trade plan to get in and get out with a profit!
Ok so well what do we have here?
So I think last week I might have said if this thing can't hold 112,000 we could be heading lower. But I also had thought that the charts were looking more bullish with support levels be rejected 3 times. Oh well sometimes our compass if off that is trading sometimes we get it right and other times we are completely off! 😁
I was bullish which support holding however now that support of 112,000 has been broken on a daily close to me it's looking bearish now. As a technical analyst I can't ingnore that 123 top formation on the charts. Just like I can't ignore the 123 bottom formation on the US Dollar chart from a week ago.
Scenario Time!
Bullish- I would say only buy this thing if it breaks above the 3 point with a daily close of 118,000.
Bearish- watch for retest back to 112,000 then sell the rally and you a risk stop I would say above the 2 point at 119,00. Its a wide stop but sometimes you gotta give the market room to breathe especially if this is the beginning of a large move down, Also with the US Dollar showing a bottom formation on the chart that also signals more weakness ahead for Metals, Commodities, Crypto etc...
COT- Commitment of Traders report still showing the funds short. The Large Specs have been short this whole time on the way up but as you can see they were starting to close short positions giving an illusion of more buyers entering the market. But seems to me like now they might increase short positions on the next rally which could be bearish I will watch to see what happens this friday when the new report is released.
Good Luck & Always use Risk Management!
(Just in we are wrong in our analysis most experts recommend never to risk more than 2% of your account equity on any given trade.)
Hope This Helps Your Trading 😃
Clifford
RISK DISCLOSURE
TRADING IN THE FUTURES AND FOREX MARKET INVOLVES SIGNIFICANT RISK. ALWAYS CONSULT A FINANCIAL ADVISOR AS HIGH RISK ASSET CLASSES MAY NOT BE SUITABLE FOR ALL INVESTORS. THIS IS NOT A RECOMMENDATION TO BUY OR SELL ANY ASSETS. ALL IDEAS ARE MADE FOR EDUCATIONAL PURPOSES. PAST PERFORMANCE DOES NOT GUARANTEE FUTURE RESULTS.
CFTC RULE 4.41 – HYPOTHETICAL OR SIMULATED PERFORMANCE RESULTS HAVE CERTAIN LIMITATIONS. UNLIKE AN ACTUAL PERFORMANCE RECORD, SIMULATED RESULTS DO NOT REPRESENT ACTUAL TRADING.

Bitcoin Eyes Reversal from Key Support Near \$109,30The 30-minute Bitcoin (BTC/USD) chart shows a bearish move followed by a potential reversal setup. Price is currently hovering around \$110,155, approaching a key support level at \$109,305. The chart suggests a bullish recovery could occur from this support zone, targeting the resistance level around \$112,860. The blue arrow indicates a projected bounce and continuation to the upside if support holds.
BITSTAMP:BTCUSD

BTC PRICE TECHNICAL OUTLOOK ON BTCLook out for any of the pattern price decides to print. If price goes lower with a choch we go long which is option A.

Btc levels Btc levels are holding up we got a low 109283 off the 109310 level we are trying to break the 110472 level we need to get above this level to continue uptrend to 111111 or we going to 108804 hope all is well

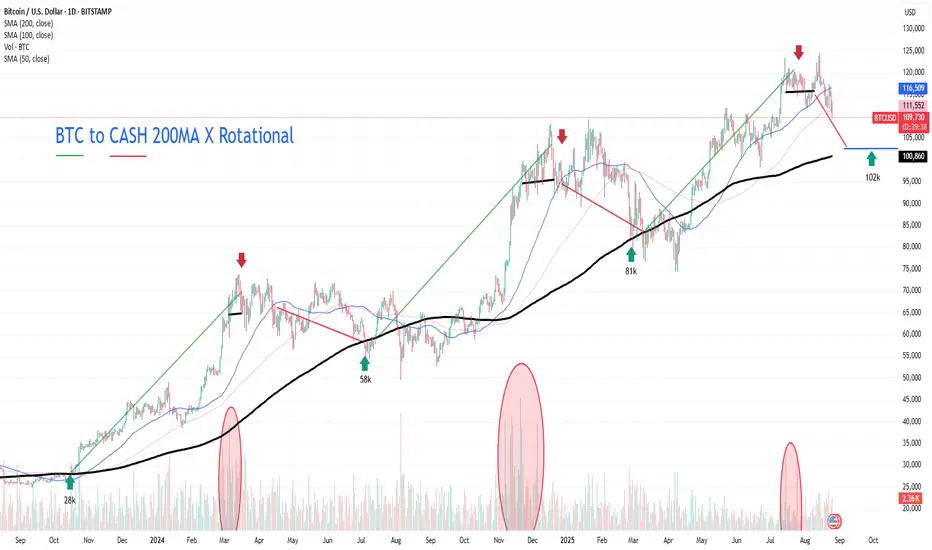
Bitcoin to revisit the 200 Moving Average?It has previously exhibited a tendency to revisit the Mean, then consolidating around it before moving to new pivot highs. These have been at approximately equally spaced price intervals.
There is currently evidence of large investors rotating out of BTC into ETH and/or Alt coins.
BTC August UpdateDip into August and mid September and start resuming the up-trend after Oct.
Typical summer price actions. Patience is the key.

BTC/USD – At Range Support🟢 LONG above $113,650 – target $112,900 → $114,500+
Bitcoin is trading at $111,557, holding just above $110,593 support. RSI at 38 signals weak momentum, but potential for bounce. A breakout above the 200 SMA at $113,650 could drive price toward $114,500+.
📊 Keywords: #BTCUSD #RangeSupport #CryptoLong #BitcoinSetup #PriceAction

Bitcoin – Bulls Hold the Edge After 110k BounceBitcoin – Trading Plan Update
Hello traders,
BTC has followed the scenario well, reacting strongly at 110.4k and bouncing higher. This level effectively cleared short-side liquidity, while the H4 candle failed to close below the 111.8k support. As such, long entries around 110k remain valid, with upside targets towards 115.5k.
The bias stays on the long side as long as price does not confirm a decisive bearish break. Long positions remain in play until price moves firmly below 110k.
For those who closed longs or missed the earlier move, watch for a retest of the FVG zone near 111.5k. If price reacts higher, fresh longs can be taken around 113k.
Short opportunities may also arise at resistance levels near 115.5k and 117.2k.
My BTC strategy continues to align with current market action. However, this is my personal view based on my trading approach. Always remain disciplined, manage risk, and follow your own plan.
What’s your outlook on BTC at this stage? Share your perspective in the comments below.

Bitcoin long from 112kLooks like bitcoin is heading toward 116k .
Longs look good from this region.
Let us see what this week unfolds.

25.08.25 BTC/USD: Bitcoin Balances at Critical SupportBitcoin is trading near 111,600, under pressure after a series of bearish waves. The key support at 111,000–111,900 is holding for now, but the overall structure remains bearish.
Technical Signals:
A descending channel is forming.
EMA acts as resistance, confirming weak buying power.
Demand zone: 111,000–111,900.
Potential downside target: 107,300.
Key Levels:
Support: 111,000, 107,300
Resistance: 114,800, 115,800
Scenarios:
Primary (bearish): a breakdown below 111,000 may open the way toward 107,300.
Alternative (bullish): if the price holds above 111,900 and breaks 114,800, a rebound toward 115,800 is possible.
Conclusion:
Bitcoin is standing at the edge. The primary outlook remains bearish, and the coming days will decide whether the market is ready for a deeper decline.

BTCUSD 8/25/2025Come Tap into the mind of SnipeGoat, as he gives you a Full Top-Down Analysis of Bitcoins Price Action as we come into the last week of Qt. 3 What is Price doing?? I got the answer!
_SnipeGoat_
_TheeCandleReadingGURU_
#PriceAction #MarketStructure #TechnicalAnalysis #Bearish #Bullish #Bitcoin #Crypto #BTCUSD #Forex #NakedChartReader #ZEROindicators #PreciseLevels #ProperTiming #PerfectDirection #ScalpingTrader #IntradayTrader #DayTrader #SwingTrader #PositionalTrader #HighLevelTrader #MambaMentality #GodMode #UltraInstinct #TheeBibleStrategy

August 19 Bitcoin Bybit chart analysisHello
It's a Bitcoin Guide.
If you "follow"
You can receive real-time movement paths and comment notifications on major sections.
If my analysis was helpful,
Please click the booster button at the bottom.
This is the Nasdaq 30-minute chart.
There are no separate indicators released.
Roughly speaking,
the strategy is to switch from short to long at the light blue finger, or to wait long at the bottom.
The bottom is today's major support line and the 6+12 pattern recovery point.
If the price moves along the light blue finger path,
there's a possibility that it will eventually fall to touch the 6+12 level again.
Please note this.
I applied this directly to Bitcoin.
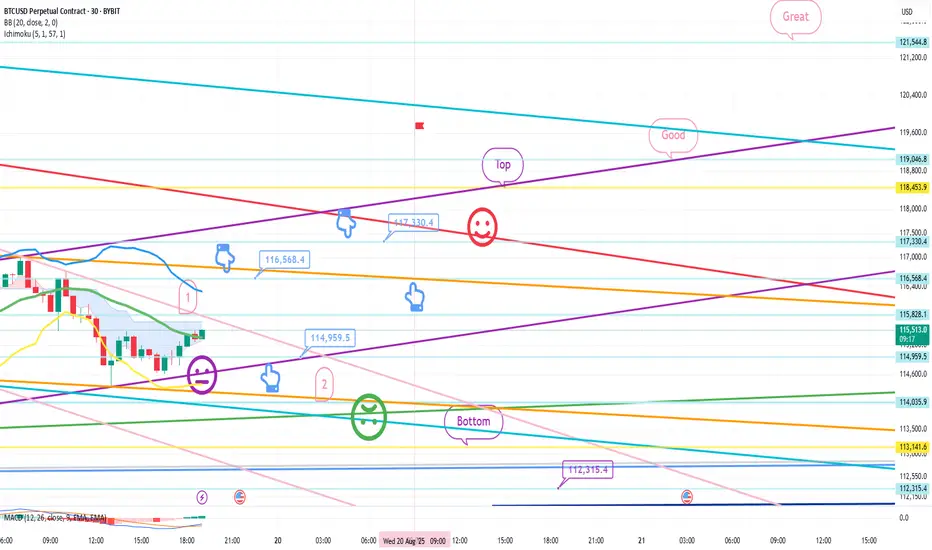
This is a 30-minute Bitcoin chart.
The Nasdaq is moving sideways in a downward trend,
while Bitcoin has continued its vertical decline after hitting a new high.
*If the blue finger moves along the path,
switch from short to long. Or, if it immediately declines, wait long in the second section.
This is a two-way neutral strategy.
1. $116,568.4 short position entry point / Stop loss price if the orange resistance line is broken.
2. $114,959.5 long position switch / Stop loss price if the purple support line is broken.
3. $117,330.4 long position first target / 116.5K long position re-entry point.
After this, long position target prices are listed in order of Top, Good, and Great.
The first point above is the best short position entry point for today.
If the price declines around the first touch, hold long at the second point.
Stop loss price if the green support line is broken.
In the case of Bitcoin, the candlestick is breaking out of the 12+ daily pattern,
and the downside is open.
If the bottom point is maintained, the mid-term uptrend will be broken.
-> If the bottom point is broken out, the mid-term uptrend will be broken. A medium-term downtrend may be forming.
(MACD dead cross on weekly chart)
If the Nasdaq only moves sideways, that's good,
but if it declines, BTC could fall even more sharply.
Due to low participation, I decided to take a break this week,
but I've had some free time, so I'm sharing this with everyone for the first time in a while.
Please use my analysis for reference only.
I hope you operate safely, with a focus on principled trading and stop-loss orders.
Thank you.
No Fuel Left: Short Setup Points to 100,000When we strip away the news flow and look only at the chart, we see a clear downward move:
the price is trading below the moving averages, already breaking through support levels, and opening the way for a decline down to 100,000.
Bringing back the broader context — commodities, equities, Treasuries, and FX pairs — the picture also favors the short side. Powell’s speech has already been priced in, there’s no fresh fuel for growth, so the market looks set for further downside.
📝Trading Plan
🟢Entry: Short from the current level
🔴Stop: 114,000
🎯Target: 100,000

BTCUSDT SHORTDONT SAY I DIDNT WARN YOU..... btc is going down call it a retest i call it a drop catch it if you can or wait for the revers ....

Bitcoin - Will Bitcoin reach its previous ATH?!Bitcoin is below the EMA50 and EMA200 on the four-hour timeframe and is in its long-term ascending channel. If it moves up, we can look for a short-term position to sell Bitcoin from the specified supply zones.
It should be noted that there is a possibility of heavy fluctuations and shadows due to the movement of whales in the market and observing capital management in the cryptocurrency market will be more important. If the downward trend continues, we can buy in the demand range.
The total market capitalization of cryptocurrencies has once again surpassed the $4 trillion mark, a development that signals a renewed wave of investor confidence in the sector. This key psychological threshold could attract a fresh influx of both institutional and retail capital. At present, the market appears to be in a phase of “stabilization supported by structural demand,” where current price levels are sustained not by short-term hype, but rather by steady institutional inflows, declining exchange reserves, and disciplined behavior from long-term holders.
On the capital flow front, the latest weekly report from CoinShares shows that after early-month volatility, inflows into digital asset investment products have regained momentum. In the week ending August 18 alone, approximately $3.75 billion was recorded as net inflows. While the majority of these funds were directed toward Ethereum, Bitcoin also saw $260 million in net inflows the previous week, reinforcing the narrative of “organized demand.”
Exchange-based data further indicates that Bitcoin reserves held on trading platforms continue to trend lower, now standing around 2.52 million BTC—the lowest level since October 2022. Importantly, part of this reduction reflects transfers of coins to ETF custodians rather than outright withdrawals from the market. As such, the net effect is a reduction in immediate selling pressure without necessarily triggering a traditional “supply shock.” Meanwhile, metrics such as long-term holders’ realized price and the MVRV ratio suggest the market is currently in a phase of reasonable profitability, though it still remains some distance from historically overheated zones.
From a broader “capital markets” perspective, one contributing factor has been recent U.S. policy adjustments regarding retirement funds’ access to alternative assets. Combined with a temporary weakening of the U.S. dollar, this has provided fuel to sustain current price levels.
Nevertheless, last night a major Bitcoin whale disrupted the supply-demand balance by selling roughly 24,000 BTC, causing Bitcoin’s price to tumble by $4,000. The concerning aspect is that this whale still holds another 153,000 BTC, and should these coins also be sold, it could present a significant bearish overhang for the market.

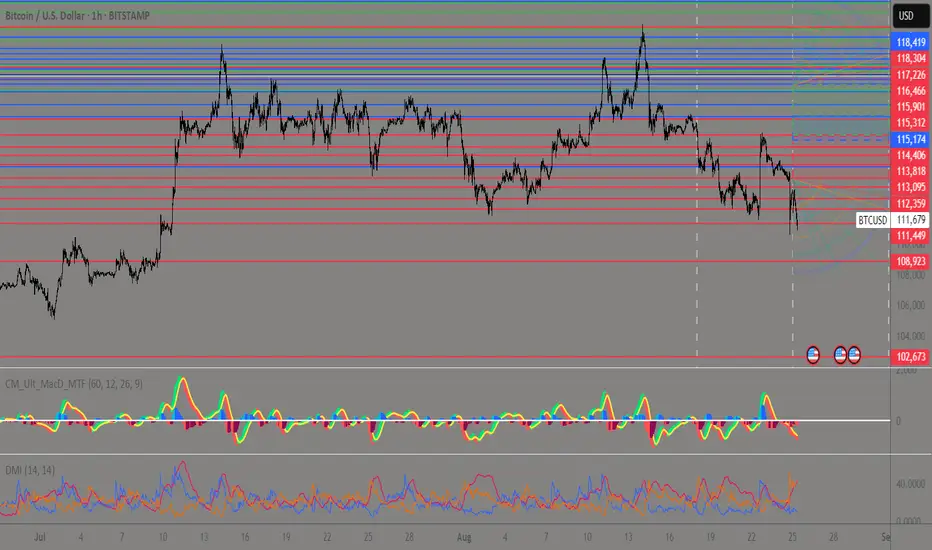
Key Levels for the Week 25-31/08/2025 ∷BitCoin∷🐍Key Levels Overview for the Week🐍
__________________________
BreakoutUpZone🐂120542🐂
117245
🏛116922-118509🏛
117125
BreakoutDownZone🐻114397🐻
__________________________
Upper Support-Resistance🔀
132173
130951
129753
129268
128824
128512
128137
127585
127216
126630
125926
125283
124173
123482
121827
121424
120172
Mids∷∷∷
115174
118419
119240
120062
120580
120887
121222
121598
121873
122217
122584
122906
123678
126018
126930
Lower Support-Resistance🔀
124308
123479
121686
120940
120261
119243
118304
117226
116466
115901
115312
114406
113818
113095
112359
111449
108923
102673
BTC USD LONG RESULTBitcoin price dumped under a straight bearish trendline to the support zone and consolidated in a falling wedge pattern, which is a bullish sign, and in confluence with holding the Support.
Price moved as predicted also with in support of Powell's Speech on Friday, straight to the resistance zone and trendline, hitting our TP.
_THE_KLASSIC_TRADER_.💪🔥

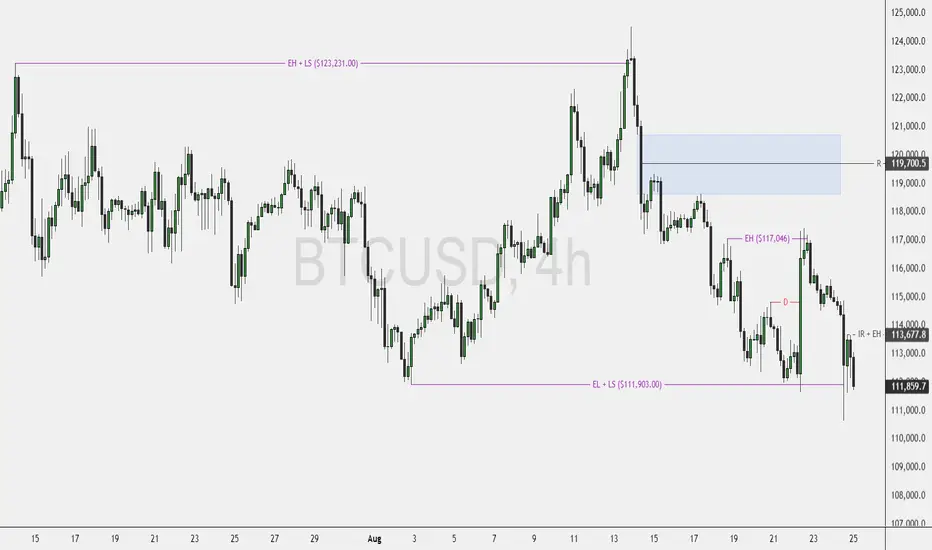
Bitcoin Holds Bullish StructureFenzoFx—Bitcoin formed equal highs after sweeping liquidity above $117,046.00 on Friday. Technically, Bitcoin remains bullish due to Friday’s price displacement.
Immediate resistance lies at $113,677.00. If bulls close and stabilize above this level, the uptrend may resume, targeting the equal highs at $117,046.00. A further rise could fill half of the bearish fair value gap toward $119,700.00.
Currently, no bearish setup is expected unless BTC reaches the premium price zone of $119,700.00 and above.