BTCUSD: The Market Is Looking Up! Long!
My dear friends,
Today we will analyse BTCUSD together☺️
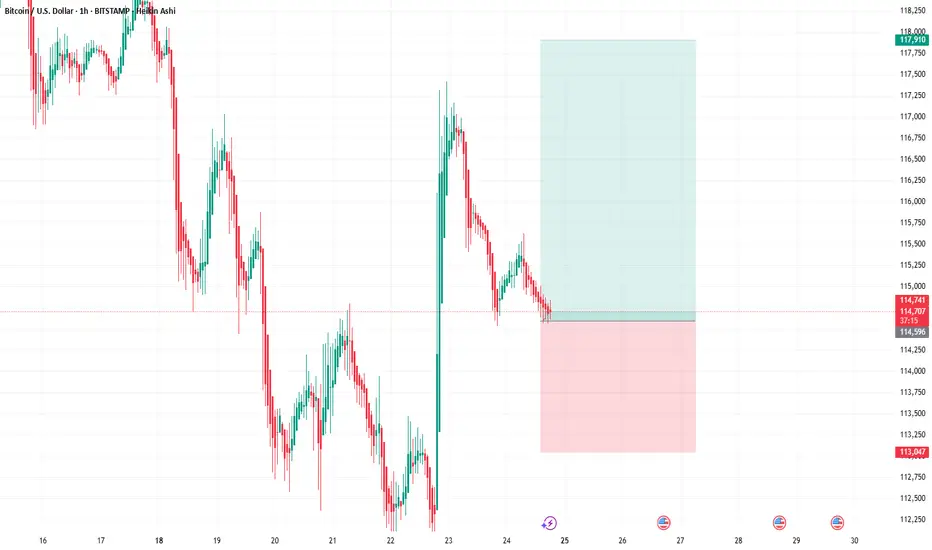
The price is near a wide key level
and the pair is approaching a significant decision level of 114,444.82 Therefore, a strong bullish reaction here could determine the next move up.We will watch for a confirmation candle, and then target the next key level of 114,761.95.Recommend Stop-loss is beyond the current level.
❤️Sending you lots of Love and Hugs❤️
BTCMINI trade ideas

No Doubt... Bitcoin Pull BackBitcoin is making it's move down for a massive explosion in 2026. watch this and let's see if it plays out perfectly. Follow for more!

BTC Long Setup15min SFP of the outstanding level (dashed line).
Price has with this pump pushed above what was previous resistance, meaning that I think there's now no resistance anymore. So we can probably buy for the HL.
Ofcourse I don't know if price pulls back this far. But just looking at the 1H (to not get smoked by 15min TF again) the structure of my entry level should get retested.
Maybe it will only retest the top of the structure. Will think about it and update if I'm changing entries.

Bitcoin is expected to be volatile this week.Bitcoin is expected to be volatile this week.
🔔BTC/USD🔔
Direction: BUY
Entry Price: 114600.00
TP1 115800.00
TP2 116800.00
TP3 117900.00
SL 113046.00
BTCUSDBTCUSD have some more upside, wait for correction and look for buys.
Disclosure: We are part of Trade Nation's Influencer program and receive a monthly fee for using their TradingView charts in our analysis.

BTCUSD BUY LIMITDaily Sellside liquidity swept
H1 CHoCH
Target next Daily Buyside liquidity.
This process always repeat itself at least twice weekly on every pair.

Possible target for the 2025 BTC cycleA possible target for the BTC medium term based on Elliot's Waves. Not very deep tho, just something I was looking at...

Bitcoin 4H Chart | Trend is My Best Friend – Smart Money Points Bitcoin 4H Chart | Trend is My Best Friend – Smart Money Points to 119K 🚀🔥”
Market Structure
The price recently rejected the key resistance zone (120,000 – 123,000 USD), which acted as a strong supply area.
After the rejection, BTC experienced a sharp decline forming lower highs and lower lows, indicating short-term bearish momentum.
Multiple Break of Structure (BOS) levels confirm bearish pressure, but the price is now approaching a significant demand zone.
2. Liquidity & Demand Zones
A clear liquidity sweep occurred near the 123,000 zone, where buyers were trapped before the drop.
The Demand Zone and Bullish Order Block (OB) around 112,000 – 114,000 USD serve as the primary area of interest for institutional buying.
This zone overlaps with previous support, strengthening its validity as a high-probability reversal point.
3. Entry & Targets
Entry Zone: Highlighted between 114,000 – 115,500 USD, where demand is expected to absorb sell orders.
First Target: 119,000 USD – this aligns with the chart’s projection and acts as a liquidity grab zone before further moves.
Second Target: If bullish momentum sustains, BTC may retest the 120,000 – 123,000 resistance range.
4. Risk Factors
If BTC breaks below 112,000 USD, the demand zone will be invalidated, potentially opening downside continuation toward 110,000 USD.
Strong rejection at 119,000 USD could also bring sellers back into control.
📌 Conclusion
BTC is currently in a bullish accumulation phase after a heavy correction. Price is sitting at a high-probability demand zone where institutional buying interest is expected. The next impulsive move is projected toward 119,000 USD, with potential continuation toward 120,000 – 123,000 USD, but rejection at resistance remains a risk.

Bitcoin – Medium-Term AnalysisBitcoin – Medium-Term Analysis
Hello traders,
BTC made a strong breakout recently, reacting precisely at the 117k level as anticipated. At the moment, price is undergoing a correction, clearing liquidity from last Friday’s bullish candle. The firm rejection at 117k suggests we should reassess the medium-term structure.
The main scenario still favours the upside. The 113.4k zone is an attractive level for long entries, as buyers previously dominated this area and short-side liquidity remains in play. From a market psychology perspective, this could trigger short covering and push price towards 115.7k. A confirmed break above 117k would strengthen the medium- to long-term bullish outlook, opening the way for further long positions.
Alternatively, if price reacts lower from 115.7k, it may offer a medium-term short opportunity. Should support at 111.7k give way, BTC could extend down to 110k, a level that has seen multiple strong rejections in the past and could provide a solid base for renewed long positions.
This outlook is guided by support/resistance dynamics and major liquidity zones. Always trade with discipline and keep risk management as your priority.
What’s your perspective on BTC right now? Share your thoughts in the comments so we can refine our strategies together.

Key zones of BTC / RTM"Important Bitcoin levels on the 1-hour timeframe. A bounce from any of these zones, combined with proper confirmations, could provide potential entry opportunities."

BTCUSD: Short Trade with Entry/SL/TP
BTCUSD
- Classic bearish pattern
- Our team expects retracement
SUGGESTED TRADE:
Swing Trade
Sell BTCUSD
Entry - 11665
Stop - 11763
Take - 11484
Our Risk - 1%
Start protection of your profits from lower levels
Disclosure: I am part of Trade Nation's Influencer program and receive a monthly fee for using their TradingView charts in my analysis.
❤️ Please, support our work with like & comment! ❤️

Bitcoin Is Still Bearish (4H)This analysis is an update of the analysis you see in the "Related publications" section
As we mentioned in the previous analysis, Bitcoin remains bearish, and our view has not changed.
We had considered two scenarios for Bitcoin, and both were bearish
Nothing has changed now either | from the current price or slightly higher, Bitcoin may see a serious correction. If the 103k zone is broken to the downside, Bitcoin’s price could correct down to the 93k area or even 86k.
Remember: when good news is released but the price cannot rally and make higher highs, the trend is bearish. It means market giants are selling to buy back at lower levels.
For risk management, please don't forget stop loss and capital management
When we reach the first target, save some profit and then change the stop to entry
Comment if you have any questions
Thank You

24.08 2025Today is sunday and it's time to made a plan for the next week. After few hours of analysis I can see a big chance for the price to go higher to 119,300$. This is the plan for the whole next week I expect the price to be a little bit slow. This is the last week of august and the next month is september the month where eth/btc is always bearish so also I expect the money from eth should go to the btc and it should made a little pump on btc. I opened a long position at 114,850$.

Buy BTCUSDBTCUSD will see some bearish movement today up towards 117000. A double bottom pattern with a broken neckline and a retest confirms this move. A bullish flag can also be seen on the 1hr chart

Bitcoin will record the price of 11500, the next part will be 18Bitcoin will record the price of 11500, the next part will be 18900 and 30,000

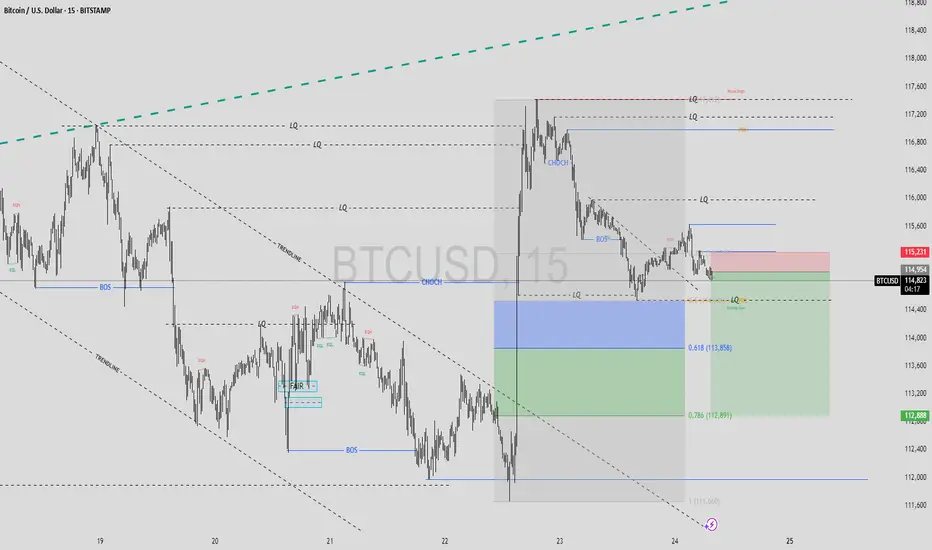
BTC/USD Targets Lower Support After Structure BreakLooking at this BTC/USD 15-minute chart, price recently broke structure and shifted with a change of character (CHOCH), now trading below a key trendline. After retesting resistance near 115,231, BTC is starting to slip lower, with eyes on liquidity zones and Fibonacci retracement levels around 113,858 and 112,891. If selling pressure continues, the next strong support could be found in this area. Watch for reactions at these zones, as a bounce might trigger a reversal, but until then, bearish momentum looks dominant.
This analysis is for educational purposes only and does not constitute financial advice. Trading involves risk, and you should conduct your own research or consult a financial advisor before making any trading decisions.
BTCUSD trading plan Hi traders i decided to share few i deas today for possible gains,as you can see BTCUSD breakout from last week temporary pull back to the down side on Friday wen fed speaks of possible rate cut in September,soo bitcoin after spike decided to come back for retest as you can see,am expecting bounce from current price 114900_114600 targeting 121000 as first target,as always we dont control the market but we predict n learn to use tools exactly the way we studied,I will try by all means to give point of interest soo that you can counter it easily,note that amstil bullish n very strong,I haven't see any strong reversal yet by that we stick to trend,I wish you all profitable week ahead God bless you all.

FOMC and Market Reactions – Simple Logic Explained💎 MJTrading:
The Federal Open Market Committee (FOMC) guides U.S. interest rates. Their decisions ripple through all major markets, not just the dollar.
🔑 How It Works (Simple View):
- When the Fed signals higher rates, the USD demand rises (investors seek higher returns), while gold, stocks, and crypto often fall because money becomes “more expensive.”
- When the Fed signals lower rates or slows tightening, the USD loses demand, and money flows into assets like gold, stocks, and crypto.
🔍 Why a Rate Cut Weakens the Dollar:
* Cutting rates means borrowing money becomes cheaper.
* Investors earn less return by holding USD in banks or bonds.
* This lowers demand for the dollar, making it cheaper in global markets.
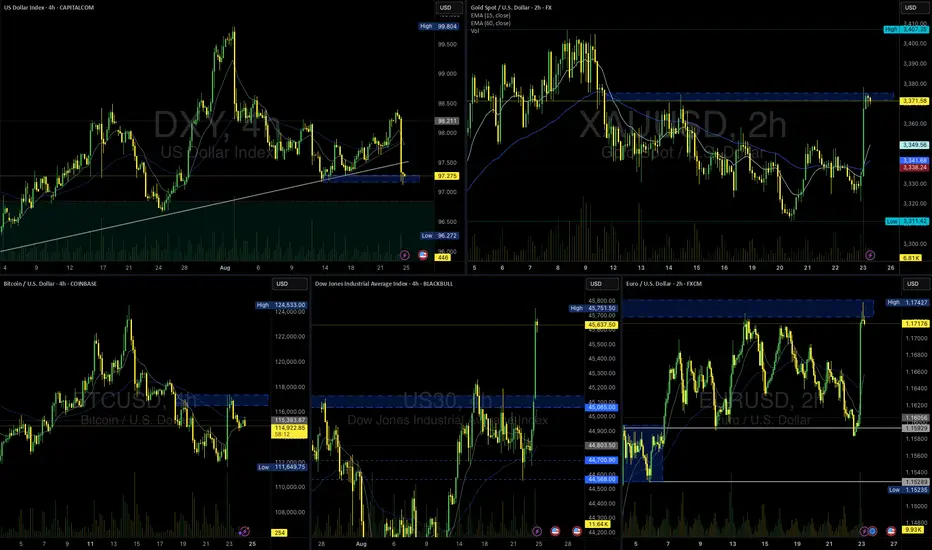
📊 What the Current Charts Show:
DXY (Dollar Index): Sharp drop → less demand for USD.
XAUUSD (Gold): Demand rises as an alternative store of value.
EURUSD: Euro strengthens against weaker dollar.
BTCUSD: Risk appetite returns, lifting crypto.
US30 (Dow Jones): Stocks benefit as liquidity shifts from USD into equities.
⚡ The Core Reason – Demand & Supply
Weaker dollar = reduced demand for USD, so supply flows into gold, stocks, euro, and crypto.
🔮 Looking Ahead – Will the Rally Continue?
The rally may extend if the dollar remains under pressure and the Fed stays dovish.
But caution: after the first strong impulse, markets often retrace to test demand zones before continuing.
Next week’s momentum will depend on whether buyers can sustain demand beyond the initial FOMC reaction.
👉 Takeaway for Traders:
FOMC moves aren’t random. They’re driven by where capital finds the best return. Understanding this demand–supply flow helps explain why all charts move together in these moments.
#MJTrading
#FOMC #DXY #XAUUSD #EURUSD #BTCUSD #US30 #Forex #Gold #TradingEducation #Rally
Psychology Always Matters:
Click on the image to read the caption.
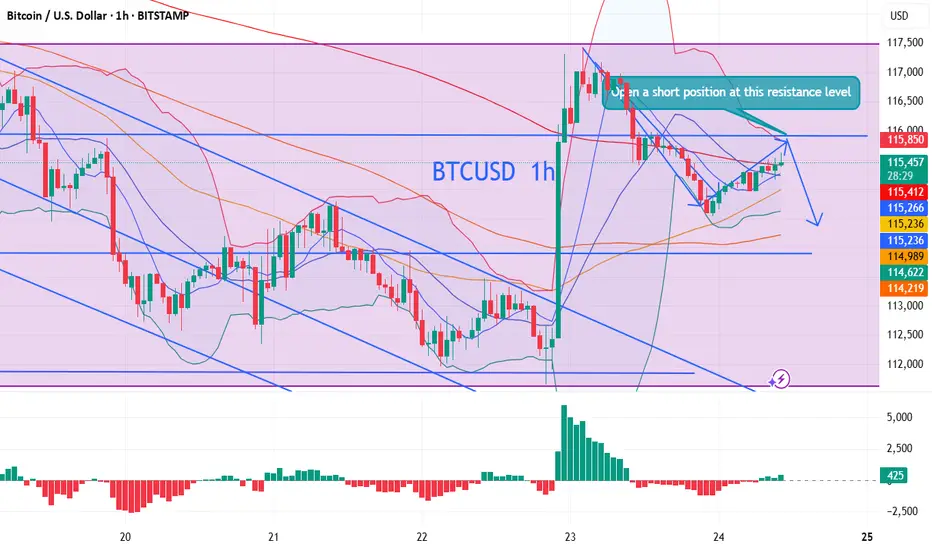
Open a short position after Bitcoin reboundsBitcoin's short-term bulls and bears are evenly matched. Light weekend trading has kept the market stable, with little movement. The current trend is a correction after Friday's bullish candlestick pattern.
Bitcoin's Today's Strategies
Short-term bull and bear opportunities exist.
If Bitcoin rebounds to around 115,800, open a short position with a target of 114,500.
Long position opportunities will be discussed based on support levels. Follow my updates.
If you have questions about the direction of gold, crude oil, Bitcoin, and Ethereum, you can follow me.
I share my trading ideas and strategies daily for your reference. Feel free to follow my updates.

A possible buy on BTCUSDPric bouncing from a proven support a bullish FVG supporting a continuation to the upside.


BITCOIN LOCAL LONG|
✅BITCOIN went down to retest
A local horizontal support of 114,6k
While trading in a strong uptrend
Which makes me locally bullish biased
And I think that a move up
From the level is to be expected
Towards the target above at 115,6k
LONG🚀
✅Like and subscribe to never miss a new idea!✅
