BTC NEXT IMPULSIVE MOVES Impulse then correction, and then Impulse. That's what is about to happen. Don't miss it
BTCMINI trade ideas

BTC OUTLOOKWith price taken out liquidity, this could only mean one thing for sellers to come in once supply is validated at 122,800.
There’s also chance for buyers at demand at 113,000 after minor structural phase shift for a potential retracement to 122,800.


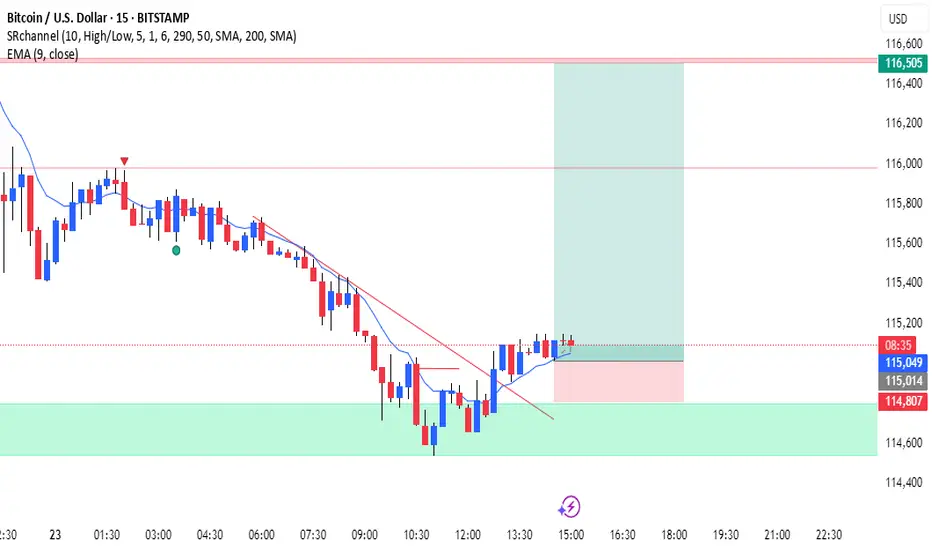
Bitcoin (BTC/USD) – 15m Chart Analysis & Signal📊 Bitcoin (BTC/USD) – 15m Chart Analysis
🔹 1. Trend & Price Action
Previous downtrend with lower highs and lower lows.
Price found support around 114,600–114,800 (green demand zone).
Bullish breakout above descending trendline → early sign of reversal.
Formation of higher lows after bounce → shift in momentum.
🔹 2. EMA (9) Signal
Price is currently above EMA 9.
EMA is curving upward, signaling short-term bullish momentum.
As long as candles stay above EMA, buyers are in control.
🔹 3. Trade Setup
✅ Bullish (Long) Signal
Entry Zone: 115,050 – 115,150
Stop-Loss: 114,800 (below support)
Take-Profit: 116,500 (previous resistance)
Risk-Reward Ratio: ~1:4
🔹 4. Risk / Invalidation
If price closes back below EMA 9 and 114,800, bullish setup is invalid.
In that case, expect continuation toward 114,400 or lower.
📌 Summary
BTC is showing a bullish reversal signal on the 15m chart.
Support held at 114,600–114,800.
Price broke the trendline and trades above EMA 9.
As long as it stays above 114,800, upside toward 116,500 is favored.
BTC Short Long Term (Bear Incoming)BTC has been on a run for three years now. We have seen the halving uptrend. Fundamentals are strong. USA support is strong alongside other nations. Despite there being good narrative, technicals suggest a bear market. ETH has started to make massive moves to the upside, ETH/BTC is also creating waves after bleeding for several months during the last year of this run. All suggesting a top as traders start rolling, preparing for a bear market.


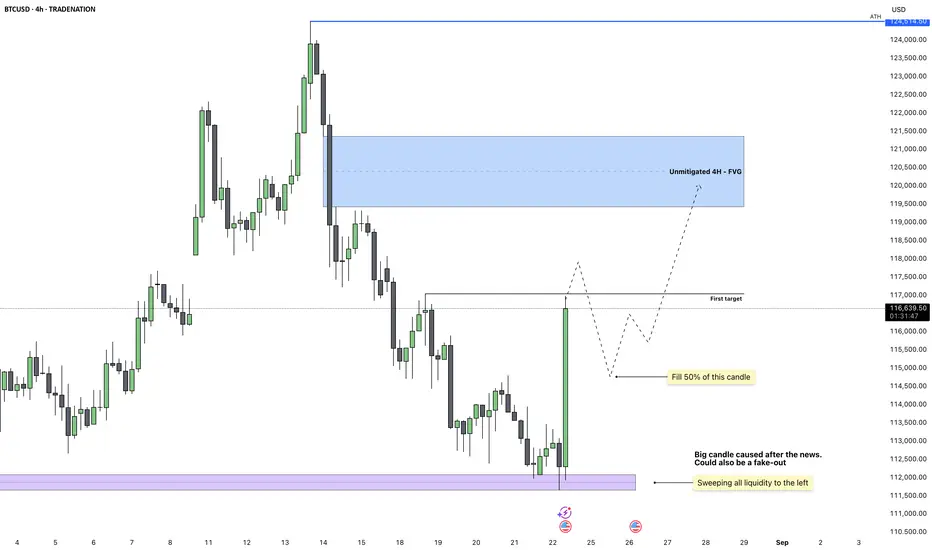
Bitcoin - A Deep Sweep Setting Up the Next ExpansionBitcoin just swept the monthly low of August as well as the previous day’s low. This was a clear liquidity grab that lined up with today’s bullish momentum in the market. The strong reaction from this zone shows that buyers were waiting for these liquidity levels to get cleared before stepping in.
Liquidity Sweep and Reaction
The sweep was significant because it cleared out resting sell-side liquidity to the left. This kind of move usually sets the stage for a reversal, and the large impulse candle confirms strong demand stepping in. While some might see this as just a reaction to external events, the technical picture supports continuation higher.
Immediate Target
The first target is sitting around 117,000. This level lines up with short-term inefficiencies and is a logical magnet for price in the coming sessions. I expect this liquidity pool to be swept before any meaningful retracement.
Retracement Expectation
After hitting the first target, I anticipate a move back down to fill around 50% of the large green impulse candle. Big candles like this often retrace partially before continuing their main direction. That retracement will provide a cleaner structure and a chance for re-entries on lower timeframes.
Higher-Timeframe Objective
Once the retracement plays out, the bigger objective sits higher at the unmitigated 4H fair value gap around 120,500. This area remains untouched and is likely to act as a price magnet as the market seeks balance.
Conclusion
The sweep of key lows combined with the strong impulsive move is a bullish development. I expect price to first tag 117,000, then retrace into the large candle before resuming higher towards the 4H FVG.
Disclosure: I am part of Trade Nation's Influencer program and receive a monthly fee for using their TradingView charts in my analysis.
___________________________________
Thanks for your support!
If you found this idea helpful or learned something new, drop a like 👍 and leave a comment, I’d love to hear your thoughts! 🚀
**BTC/USD – 15M | Market Structure, Liquidity & Live Outlook**
This chart shows how institutional concepts like BOS, MSS, breaker blocks, and liquidity zones shape market direction.
📌 **Educational Notes:**
* **Equal Highs:** Liquidity builds when candles close at the same price (trap for breakout traders).
* **Equal Lows:** Same concept but at the bottom; liquidity pools for future sweeps.
* **MSS (Market Structure Shift):** First sign of reversal, trend shifting direction.
* **BOS (Break of Structure):** Confirms continuation after pullback.
* **Breaker Block:** Failed order block flipped into a breaker zone.
* **Rejection Block:** Price repeatedly rejects from this zone = strong supply/demand.
* **P1D High / Low:** Yesterday’s high/low = liquidity magnets.
📈 **Bullish Idea**
* If BTC holds above **Equal Lows (114,400)**, price can target **115,600 Swing High → 117,200 P1D High / liquidity zone**
📉 **Bearish Idea**
* If Equal Lows break, BTC may revisit **113,000 swing low → 112,000 rejection block (P1D Low)** before reversal
💡 **Key Takeaway:**
Smart money follows liquidity. Watch how price reacts at equal highs & lows — that’s where the real moves start.

BTCUSD Massive Short! SELL!
My dear followers,
I analysed this chart on BTCUSD and concluded the following:
The market is trading on 11665 pivot level.
Bias - Bearish
Technical Indicators: Both Super Trend & Pivot HL indicate a highly probable Bearish continuation.
Target - 11505
Safe Stop Loss - 11748
About Used Indicators:
A super-trend indicator is plotted on either above or below the closing price to signal a buy or sell. The indicator changes color, based on whether or not you should be buying. If the super-trend indicator moves below the closing price, the indicator turns green, and it signals an entry point or points to buy.
Disclosure: I am part of Trade Nation's Influencer program and receive a monthly fee for using their TradingView charts in my analysis.
———————————
WISH YOU ALL LUCK

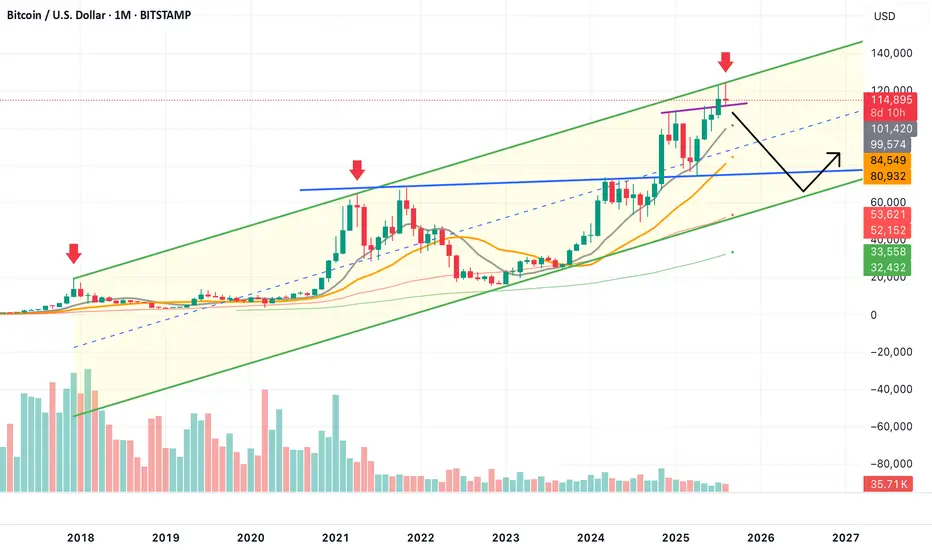
The monthly chart is signaling cautionThe price has touched the upper edge of the green channel for the third time.
Currently, the monthly candle is forming a doji resting on the purple support level.
The monthly doji was also the turning point during the previous reversal.
A break below this support—under $110—could trigger a decline toward the next blue support level.
Is Btc going lower? Aug 9th- As Btc was approaching a break of the trendline, I anticipated the usual % "fakeout" and set my T1 (green box) accordingly. Asking the question, "Is Btc doing what it always does?"
Because if it did, then setting my bearish targets (and their probabilities), was a matter of simple calculations.
Aug 12h - As my green T1 was confirmed, I became confident we were in a very common bearish pattern and with the highest probability, my bearish T2 would be hit.
Aug 16th- Once I ruled out the 12% chance of a Btc parabolic move (without a retrace into either bearish target), I was able to recalculate the probabilities of my bear targets. These were udated as seen on the chart below. I wanted my followers to understand WHY I had increased the probailities in each of T1 and T2 targets.
Aug 23rd - As of today, my bear T2 target has been hit and the entire anticipated bearish pattern has been confirmed. I wanted to offer a bit of an explination on how I came to determine price action once Btc broke trend.
But the question remains, will Btc go lower into my T2 target ($108K - $112K)? I believe the answer is yes. And that would be my ideal buy zone for Btc and my favorite alt coins.
May the trends be with you.

Please may we have a double bottom?Is it possible that BTC can consolidate and break through the 10 EMA(in purple) 116,400$ price area, or will it fail the 21 EMA(in yellow) 114, 370$ price area and head to the 112K$ support? The EMA stack is still intact. We have price between the 10 EMA and 21 EMA. Price is also on the support of a channel. Hopefully we do not get a head and shoulders formation that will drop price to the 50 EMA!

BTCUSD: Target Is Down! Short!
My dear friends,
Today we will analyse BTCUSD together☺️
The price is near a wide key level
and the pair is approaching a significant decision level of 115,102.46 Therefore, a strong bearish reaction here could determine the next move down.We will watch for a confirmation candle, and then target the next key level of 113,674.18.Recommend Stop-loss is beyond the current level.
❤️Sending you lots of Love and Hugs❤️

BTCUSD AnalysisBTC is retracing down to 114252 level and then expected to rise again towards 124000 ATH.
Buying opportunity at 114000- 114252 area.
See the detailed chart in this link.

Bitcoin Eyes $100K Re-Entry: Retest, Support Zone,Then Push 130kChart Analysis
1. Price Structure & Trendlines
The chart displays a former upward trendline that has been broken, leading to a corrective pullback.
Following that, price is perched within a “retest zone” (the red-shaded rectangle), which aligns with both historical horizontal resistance—now turning into support—and an area of previous consolidation. This is a classic setup: price often retests key breakout levels before resuming its move.
2. Support Levels
The main support is clearly drawn around the $100K zone, highlighted by a grey bar below the retest zone. This is a psychological and structural area to watch for potential strong buying.
Immediate support appears near $110K–$112K, as noted by the lower edge of the red retest area—this zone has shown to catch corrections before in technical analysis and news reports
AInvest
Mudrex
Barron's
.
3. Resistance & Upside Targets
If the retest holds, the chart charts a potential bounce toward the upper rising trendline and beyond, potentially aiming for the $126K–$130K region, as marked by Fibonacci retracement levels.
This aligns with several external forecasts suggesting resistance or target zones in that range
AInvest
Mudrex
Barron's
.
4. Potential Price Path & Scenarios (Denoted by Red Arrows)
Bearish Scenario: Price may dip down into the retest zone, test support, and—if the breakdown occurs—continue lower toward $100K—a key area of interest.
Bullish Scenario: The support holds, leading to a V-shaped recovery that propels price back above $115K, potentially triggering a rally toward $122K–$130K.
Summary Table
Key Zone / Level Significance & Note
$110K–$112K Critical near-term support; breakdown risks move toward $100K
AInvest
Mudrex
Retest Zone (~$114K–$115K) Area combining horizontal support and trendline; serves as pivot for next move
Mudrex
AInvest
$120K–$123K Major resistance where a breakout could fuel continuation toward $127K–$130K
Mudrex
Barron's
Broader Context & Market Sentiment
Bitcoin is currently consolidating after setting new highs near $124K
MarketWatch
The Economic Times
Barron's
Cointribune
.
Analysts observe that sustaining above the $110K–$112K band is essential to the bullish case; falling below it could invite deeper downside
Barron's
Cointribune
AInvest
.
Conversely, a decisive move above $120K–$123K could validate continuation toward $127K–$130K, and even higher—some forecasts extend to $135K and beyond
Mudrex
Indiatimes
Barron's
CoinCodex
.
Final Thoughts
Your chart beautifully illustrates the classic “retest after breakout” dynamic:
Hold above the retest zone? Look for a rebound toward $120K+, with the potential for a full bullish revival aiming for $130K.
Break below $110K–$112K? Watch for a possible move toward $100K—a critical support level.
Stay alert to macro catalysts too—like Federal Reserve interest rate signals, institutional inflows (ETFs), and regulatory developments—which could steer the next leg substantially

BTC/USD Bullish Breakout Toward 124K🔎 Chart Analysis
1. Support & Resistance Zones
Support Zone: Around 113,600 – 115,000, holding price from further downside.
Resistance Zone: Around 116,000, where price faced rejection previously.
2. Trend Structure
The price has broken out of the descending channel (rejection line & support line).
This breakout suggests a bullish reversal signal.
3. Moving Averages (EMA)
EMA 70 (~115,080) and EMA 200 (~116,182) are converging.
If the price sustains above EMA 200, it will confirm a bullish continuation.
4. Candlestick Price Action
Recent bullish engulfing from support zone strengthens the case for upward momentum.
Consolidation near resistance indicates accumulation before a breakout.
5. Target Projection
If breakout above resistance is successful, target lies around 124,449 – 124,484 (next major resistance level).
📌 Trading Plan (Example)
Entry: Around 115,260 – 115,600 (after confirmation above EMA 200).
Stop Loss: Below 113,600 (support zone).
Target: 124,449 – 124,484.
⚡ Summary
Bitcoin is showing signs of a bullish breakout from a descending channel. If price sustains above the resistance and EMA 200, a strong move toward 124K is likely. The support at 113,600 remains a critical invalidation level.

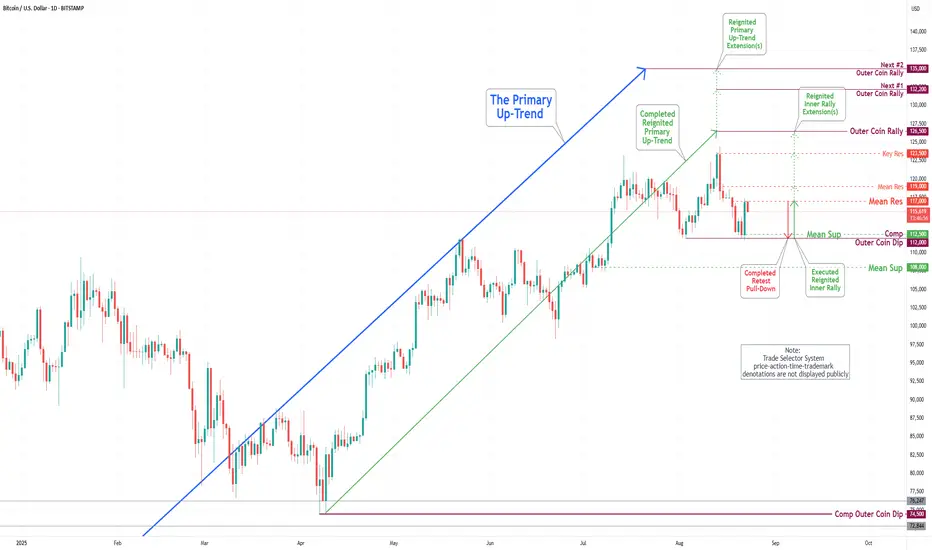
Bitcoin(BTC/USD) Daily Chart Analysis For Week of August 22 2025Technical Analysis and Outlook:
During the current trading session, the Bitcoin market has experienced a noteworthy pullback to the completed Outer Coin Dip at 112000, and as a result, has demonstrated considerable resilience, reaching the Mean Resistance (the inverse of Mean Support) at 116600 as detailed in the Daily Chart Analysis for the week of August 15. The prevailing analysis suggests that the cryptocurrency may revisit the Mean Support at 116500, as well as the completed Outer Coin Dip at 112000, before resuming its bullish trend.
Bitcoin Price Prediction: $112K Support Bounce Eyes $130KBTC is rebounding from $112K support, trading near $116.6K. Key resistance sits at $116.8K and $119.3K. A breakout could open $121.8K–$124.4K, with momentum aiming for $130K.

Expect beariah leg in M15 .we have internal beariah structureSells valid here .first targer consider as 1/3 and the last profite lvl could be 98k.

Leverage in Crypto: The Sexy Lie vs. The Boring TruthLet’s be honest: the vast majority of crypto traders don’t come with a trading background. Not in stocks, not in futures, and definitely not in leveraged Forex.
Most enter crypto because of hype, the dream of fast money, and stories of overnight millionaires.
That’s why leverage in crypto is so dangerous. It’s not just a tool — it’s a trap for the unprepared.
________________________________________
What leverage really means
To keep it simple: with 100× leverage, every 1% move in your favor doubles your account, but every 1% move against you wipes it out completely.
👉 No matter the asset — Forex, Gold, Bitcoin, or meme coins — at 100× leverage you only have 1% room to be wrong.
________________________________________
Yesterday’s market moves – a perfect example
Yesterday, markets exploded across all asset classes:
• EURUSD → +1%
• Gold (XAUUSD) → +1.5%
• Bitcoin (BTC) → +4%
• Ethereum (ETH) → +8%
• PEPE, other coins and meme coins → +10%+
Now imagine trading them with 100× leverage, catching the bottom and selling at the top:
• EURUSD → +100% (account doubled)
• Gold → +150%
• BTC → +400%
• ETH → +800%
• PEPE → +1000%
Sounds incredible, right?
But here’s the other side: with 100× leverage, a –1% move against you = instant liquidation.
________________________________________
Effective Leverage – The Hidden Concept
Effective leverage — you rarely see it explained. Why?
Because it’s not sexy, not marketable, and most of all… exchanges and brokers don’t want this to be very clear.
Nominal leverage (the 50×, 100×, 200× banners you see everywhere) sells dreams. Effective leverage, on the other hand, shows the brutal reality: how much exposure you actually control compared to your account size.
Formula:
Effective Leverage=Position Size/Account Equity
• Example 1 (Forex): $1,000 account, $5,000 EURUSD position = 5× effective leverage.
• Example 2 (Crypto): $100,000 account, BTC at $100k, controlling 5 BTC ($500,000 position) = 5× effective leverage.
👉 Nominal leverage is the ad. Effective leverage is the invoice.
And once you understand it, the marketing magic disappears.
________________________________________
A concrete example – Solana trade
Let’s take a real setup I shared recently on Solana:
• Entry: buy at $200
• Stop Loss: $185 → risk on the asset = -7.5%
Case 1 – 100× leverage
From 200 → 198 (–1%), you’re liquidated. You never reach your stop at 185.
Case 2 – 10× effective leverage
Every 1% move = 10% account swing. You could survive down to 180, but you’d be under constant stress.
Case 3 – 2× effective leverage (my choice)
Let’s say you control $2,000 worth of SOL, effectively $4,000 exposure.
• If Solana falls to 185 (–7.5%), that’s a –15% hit to your account. Painful, but survivable.
• If Solana rises to 250 (+25%), with 2× leverage you make +50% on allocated capital.
• Risk–reward ratio: ~1:3.3 — sustainable, worth taking.
________________________________________
The psychological factor
This is where leverage breaks most traders.
• With 100× leverage, every 0.2% fluctuation moves your account by 20% (≈ $400 on a $2,000 account). Every 1% move = liquidation. How do you stay calm? You don’t.
• With 2× effective leverage, a 1% fluctuation only moves your account 2% (≈ $40). Boring? Maybe. Survivable? Absolutely.
Now imagine: you enter SOL at 200 with 100× leverage.
• At 202, you’ve doubled your account.
• At 210, you’ve made 5×.
But will you hold? No. Because:
1. If you’re awake, the stress of watching wild swings (in money, not in price) forces you to close early.
2. If you do hold, it’s usually because you were asleep — or the move happened in a single violent candle.
Markets never move in a straight line. They go 200 → 202 → 201 → 203 → 201 → 205…
At 100× leverage, every retracement feels like life or death. At 2× leverage, it’s just noise.
________________________________________
Conclusion
Leverage isn’t evil. It’s just a tool. But in crypto, with insane volatility and inexperienced traders, it becomes a weapon of mass destruction.
• At 100×, you’re gambling on the next 1% very small move.
• At 10×, you’re constantly stressed and one bad move away from ruin.
• At 2×–5× effective leverage, you can actually follow your plan, respect your stop, and let your targets play out.
Trading isn’t about adrenaline. It’s about survival.
High leverage destroys accounts — and discipline. Small, controlled leverage gives you the one thing you need most in trading: time.
P.S.
Of course, the choice is yours — what leverage you decide to use, whether you take into consideration the concept of effective leverage, or how you handle the psychological impact of high leverage.
But at least now, you know. 🙂

Liquidity Grab Strategy | Smart Money ConceptHave you ever had your stop loss hunted before price moved in your direction?
That’s called a Liquidity Grab — one of the most powerful setups in Smart Money Concept (SMC).
In this video, I break down:
What Liquidity Grab really means 📊
How institutions use stop hunts to fuel big moves 🏦
Step-by-step guide to trade liquidity grabs profitably
Real chart example on XAUUSD with 1:5 Risk-Reward setup 💰
📌 Why Watch This Video?
Stop chasing false breakouts 🚫
Learn to spot liquidity pools (double tops/bottoms) ✅
Understand confirmation entries after the grab 🎯
Trade with Smart Money, not against it ⚡
🔗 Watch Full Video Here: Liquidity Grab Strategy | Smart Money Concept
📈 Chart Highlight (From Video)
Equal highs formed → liquidity pool created
Price spiked above → retail stops hunted
Market reversed with momentum → clean entry after structure shift
This is exactly how institutions move the market. Knowing this gives you the edge most retail traders miss.
⚡ Key Takeaway
Liquidity Grabs are not manipulation against you — they’re opportunities.
Flip the script: enter with institutions, not against them.
📌 Tags
#SmartMoneyConcept #LiquidityGrab #ForexTrading #XAUUSD #SMC #SupplyAndDemand

BTC/USD Eyes Bounce to Liquidity ZoneLooking at this BTC/USD 15-minute chart, after a clear change of character (CHOCH) signaling potential shift in momentum, price is currently consolidating near a support zone. If buyers step in and hold above this level, BTC could aim for the liquidity zone around 117,154. This setup suggests a possible bounce and recovery, so it’s worth watching for buying momentum to confirm a bullish reversal.
This analysis is for educational purposes only and does not constitute financial advice. Trading involves risk, and you should conduct your own research or consult a financial advisor before making any trading decisions.

20.08 2025 TARGET DONEAnd we've get what we wanted and the price left a small wick below our target at 111.900 We had a opened short position from 113.900 and closed it at 111.900 price stops at 111.700 and then made a big pump which was my next target to catch more of lq above us. I can't do anything now except waiting for the next occasion to open a good position. Enjoy the money.
