Leverage in Crypto: The Sexy Lie vs. The Boring TruthLet’s be honest: the vast majority of crypto traders don’t come with a trading background. Not in stocks, not in futures, and definitely not in leveraged Forex.
Most enter crypto because of hype, the dream of fast money, and stories of overnight millionaires.
That’s why leverage in crypto is so dangerous. It’s not just a tool — it’s a trap for the unprepared.
________________________________________
What leverage really means
To keep it simple: with 100× leverage, every 1% move in your favor doubles your account, but every 1% move against you wipes it out completely.
👉 No matter the asset — Forex, Gold, Bitcoin, or meme coins — at 100× leverage you only have 1% room to be wrong.
________________________________________
Yesterday’s market moves – a perfect example
Yesterday, markets exploded across all asset classes:
• EURUSD → +1%
• Gold (XAUUSD) → +1.5%
• Bitcoin (BTC) → +4%
• Ethereum (ETH) → +8%
• PEPE, other coins and meme coins → +10%+
Now imagine trading them with 100× leverage, catching the bottom and selling at the top:
• EURUSD → +100% (account doubled)
• Gold → +150%
• BTC → +400%
• ETH → +800%
• PEPE → +1000%
Sounds incredible, right?
But here’s the other side: with 100× leverage, a –1% move against you = instant liquidation.
________________________________________
Effective Leverage – The Hidden Concept
Effective leverage — you rarely see it explained. Why?
Because it’s not sexy, not marketable, and most of all… exchanges and brokers don’t want this to be very clear.
Nominal leverage (the 50×, 100×, 200× banners you see everywhere) sells dreams. Effective leverage, on the other hand, shows the brutal reality: how much exposure you actually control compared to your account size.
Formula:
Effective Leverage=Position Size/Account Equity
• Example 1 (Forex): $1,000 account, $5,000 EURUSD position = 5× effective leverage.
• Example 2 (Crypto): $100,000 account, BTC at $100k, controlling 5 BTC ($500,000 position) = 5× effective leverage.
👉 Nominal leverage is the ad. Effective leverage is the invoice.
And once you understand it, the marketing magic disappears.
________________________________________
A concrete example – Solana trade
Let’s take a real setup I shared recently on Solana:
• Entry: buy at $200
• Stop Loss: $185 → risk on the asset = -7.5%
Case 1 – 100× leverage
From 200 → 198 (–1%), you’re liquidated. You never reach your stop at 185.
Case 2 – 10× effective leverage
Every 1% move = 10% account swing. You could survive down to 180, but you’d be under constant stress.
Case 3 – 2× effective leverage (my choice)
Let’s say you control $2,000 worth of SOL, effectively $4,000 exposure.
• If Solana falls to 185 (–7.5%), that’s a –15% hit to your account. Painful, but survivable.
• If Solana rises to 250 (+25%), with 2× leverage you make +50% on allocated capital.
• Risk–reward ratio: ~1:3.3 — sustainable, worth taking.
________________________________________
The psychological factor
This is where leverage breaks most traders.
• With 100× leverage, every 0.2% fluctuation moves your account by 20% (≈ $400 on a $2,000 account). Every 1% move = liquidation. How do you stay calm? You don’t.
• With 2× effective leverage, a 1% fluctuation only moves your account 2% (≈ $40). Boring? Maybe. Survivable? Absolutely.
Now imagine: you enter SOL at 200 with 100× leverage.
• At 202, you’ve doubled your account.
• At 210, you’ve made 5×.
But will you hold? No. Because:
1. If you’re awake, the stress of watching wild swings (in money, not in price) forces you to close early.
2. If you do hold, it’s usually because you were asleep — or the move happened in a single violent candle.
Markets never move in a straight line. They go 200 → 202 → 201 → 203 → 201 → 205…
At 100× leverage, every retracement feels like life or death. At 2× leverage, it’s just noise.
________________________________________
Conclusion
Leverage isn’t evil. It’s just a tool. But in crypto, with insane volatility and inexperienced traders, it becomes a weapon of mass destruction.
• At 100×, you’re gambling on the next 1% very small move.
• At 10×, you’re constantly stressed and one bad move away from ruin.
• At 2×–5× effective leverage, you can actually follow your plan, respect your stop, and let your targets play out.
Trading isn’t about adrenaline. It’s about survival.
High leverage destroys accounts — and discipline. Small, controlled leverage gives you the one thing you need most in trading: time.
P.S.
Of course, the choice is yours — what leverage you decide to use, whether you take into consideration the concept of effective leverage, or how you handle the psychological impact of high leverage.
But at least now, you know. 🙂
BTCMINI trade ideas

Liquidity Grab Strategy | Smart Money ConceptHave you ever had your stop loss hunted before price moved in your direction?
That’s called a Liquidity Grab — one of the most powerful setups in Smart Money Concept (SMC).
In this video, I break down:
What Liquidity Grab really means 📊
How institutions use stop hunts to fuel big moves 🏦
Step-by-step guide to trade liquidity grabs profitably
Real chart example on XAUUSD with 1:5 Risk-Reward setup 💰
📌 Why Watch This Video?
Stop chasing false breakouts 🚫
Learn to spot liquidity pools (double tops/bottoms) ✅
Understand confirmation entries after the grab 🎯
Trade with Smart Money, not against it ⚡
🔗 Watch Full Video Here: Liquidity Grab Strategy | Smart Money Concept
📈 Chart Highlight (From Video)
Equal highs formed → liquidity pool created
Price spiked above → retail stops hunted
Market reversed with momentum → clean entry after structure shift
This is exactly how institutions move the market. Knowing this gives you the edge most retail traders miss.
⚡ Key Takeaway
Liquidity Grabs are not manipulation against you — they’re opportunities.
Flip the script: enter with institutions, not against them.
📌 Tags
#SmartMoneyConcept #LiquidityGrab #ForexTrading #XAUUSD #SMC #SupplyAndDemand

BTC/USD Eyes Bounce to Liquidity ZoneLooking at this BTC/USD 15-minute chart, after a clear change of character (CHOCH) signaling potential shift in momentum, price is currently consolidating near a support zone. If buyers step in and hold above this level, BTC could aim for the liquidity zone around 117,154. This setup suggests a possible bounce and recovery, so it’s worth watching for buying momentum to confirm a bullish reversal.
This analysis is for educational purposes only and does not constitute financial advice. Trading involves risk, and you should conduct your own research or consult a financial advisor before making any trading decisions.

20.08 2025 TARGET DONEAnd we've get what we wanted and the price left a small wick below our target at 111.900 We had a opened short position from 113.900 and closed it at 111.900 price stops at 111.700 and then made a big pump which was my next target to catch more of lq above us. I can't do anything now except waiting for the next occasion to open a good position. Enjoy the money.

BTC/USD – Bears Active Below 116,534BTC/USD Analysis
Price is currently trading around 115,950 after a rejection from the resistance zone at 116,534. The market structure shows lower highs forming, with sellers maintaining control below resistance.
If price continues to hold under this level, we could see a move back into the 114,625 demand zone, where buyers may attempt to step in. On the upside, a clean breakout above 116,534 would invalidate the bearish setup and open the door for further gains.
📌 Key Levels to Watch
Resistance: 116,534
Support: 114,625
Trend Bias: Bearish while under resistance

BTC BULL TRAP! 127k before 30% correction!What Does Richard Wyckoff Say?
We are currently deep inside a Wyckoff Distribution Schematic on BTC. The structure is clear:
- PSY → BC → AR → ST → UT → SOW are all marked.
- BTC has retested support around 112K, bouncing higher before the expected UTAD.
- Distribution suggests supply > demand, with the next major phase likely the UTAD (Upthrust After Distribution) — a sharp fake-out rally into resistance before a larger correction.
Key Levels
- UTAD target zone: 125K–127K (liquidity grab, local top)
- Support zone: 112K
- Downside targets after distribution resolves: CME gap at 92K, possibly 89K (≈30% correction)
Macro Overlays
- Mercury Retrograde: Historically volatile — 75% of the time BTC exits retrograde near the price it entered. Now we’re in the shadow period, which is most commonly bearish. ✔️ Confirmed!!!
- New Moon: Sparked fear & uncertainty — exactly what the market maker wants.
3 Reasons Why September Is Bearish:
1)Lunar Eclipse / Blood Moon / Harvest Moon (Sep 6)
2)FED cutting rates → potential violent correction
3)Seasonality: September is historically BTC’s worst month (average -5.3%).
- Rotation signal: BTC dominance is set to fall further → BTC bleeds, alts rise → alt season continuation.
Summary
We’re in late-stage distribution. Expect a bull trap rally into 125K–127K (UTAD), then a sharp correction into CME gap of 92K, could see 89K. Meanwhile, watch BTC dominance — the alt season rotation is just beginning!

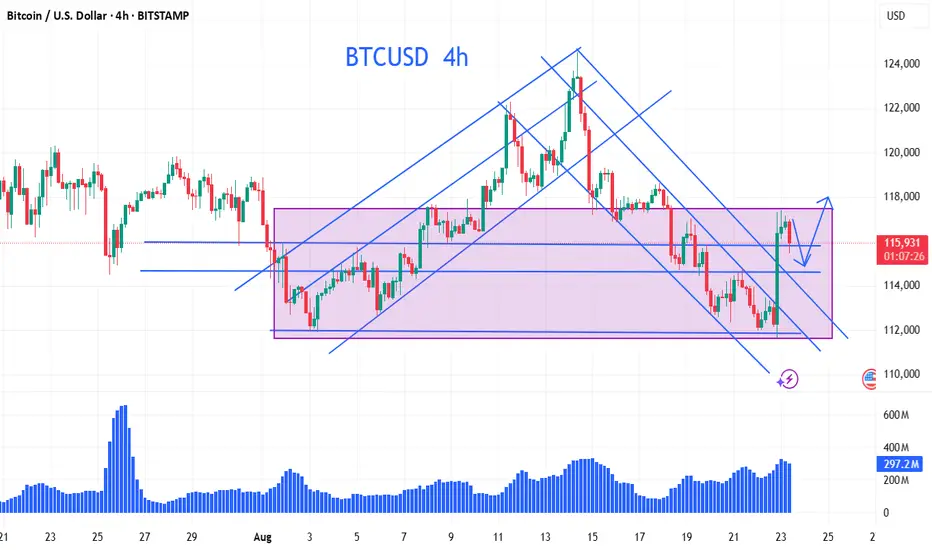
BTCUSD is consolidating in narow rangeBTCUSD is consolidating in narow range. Likely to breakdown, since price is on left side of Trendline

BTCUSD Outlook: Fibonacci Levels to New HighsPlan 1 – Bullish Scenario (Fed Rate Cut Support)
With the Federal Reserve signaling a rate cut, the probability of continued bullish momentum in BTCUSD remains strong. A corrective move may first test the Golden Ratio Fibonacci zone (0.618–0.786), drawn from the swing high 117,390.57 to the swing low 111,659.94, located between 112,908 – 113,846. If buyers step in from this zone, price could extend higher toward the supply zone at 120,818 – 121,730, which also aligns with the golden ratio retracement of the larger swing 124,501.31 – 111,659.94.
Plan 2 – Bearish Scenario (Break of Golden Ratio Support)
If the Fibonacci Golden Ratio support at 112,908 – 113,846 fails and price breaks down decisively, bearish pressure could intensify, targeting the 1.618 Fibonacci extension around 108,157. This would confirm sellers regaining control after buyers failed to defend a key retracement level.
Plan 3 – Bullish Continuation (Toward a New ATH)
If the supply zone at 120,818 – 121,730 is broken with a solid candle body—a strong sign of buyer dominance—BTC could enter a more aggressive bullish phase. In this scenario, momentum may drive price into uncharted territory, opening the door to a new All-Time High (ATH).
Conclusion
BTCUSD is currently positioned at a critical juncture. A healthy pullback into Fibonacci support could provide buyers with the setup to retest the 120k–121k supply zone. Conversely, a break below 113k may expose deeper downside toward 108k. On the flip side, a strong breakout above 121k would shift the market outlook toward a potential new ATH.

When Bitcoin pulls back, you should open a long positionPowell's comments accelerated volatility across financial markets. He stated that "evolving" economic risks strengthen the case for the Federal Reserve to cut interest rates, signaling that he may support a 25 basis point rate cut at the Fed's next meeting in September. While acknowledging that the impact of the administration's trade war on consumer prices is now "clearly visible," Powell hinted that this effect is unlikely to persist and may instead be a one-time shock that the central bank can ignore. He stated, "Given the labor market is not particularly tight and faces increasing downside risks, this outcome (of persistently rising inflation) seems unlikely." He added, "The risks to inflation are upside, while those to employment are downside, creating a challenging situation."
The market has broken out of its range due to news headlines, and the short-term trend is strong. Strategies should follow the trend.
Bitcoin Personal Strategy
Open a long position in Bitcoin around 115,500, with a target of 117,600.
If you have questions about the direction of gold, crude oil, Bitcoin, and Ethereum, you can follow me.
I share my trading ideas and strategies daily for your reference. Feel free to follow my updates.
Bitcoin Outlook – Breakout from the Downtrend ChannelBitcoin Outlook – Breakout from the Downtrend Channel
Hello traders,
BTC has broken out of its descending channel with a strong impulsive candle, in line with the corrective rally scenario. At present, price is reacting around 117k, confirming a clear structural shift. For the medium term, the dominant trend should now be viewed as bullish. Pullbacks towards 114.5k – 113k may provide attractive opportunities to add long positions.
From an Elliott Wave perspective, BTC appears to be in the final ABC sequence. The current leg is wave B, and traders should look to position long as wave C develops.
Upside targets: 120k – 121k, where a mild correction is likely as liquidity is cleared.
This is my personal perspective on Bitcoin. Stay disciplined, monitor price closely, and manage risk carefully.
What’s your outlook on BTC at this stage? Share your thoughts in the comments so we can refine our trading together.
BTC 1H – Supply Rejection, Will Key Level Hold?BTC pushed sharply from the 112K demand zone and ran into supply around 117.2K–117.6K, where sellers stepped in. Price is now pulling back.
Key structure to watch:
Holding above 116K could give another test of the 117.2K–117.6K supply zone.
A breakdown through 116K would likely open the way toward the 113,278 key level, and possibly a deeper retest into the 112K demand zone.
This level will decide if bulls keep momentum or if the move unwinds back toward liquidity.

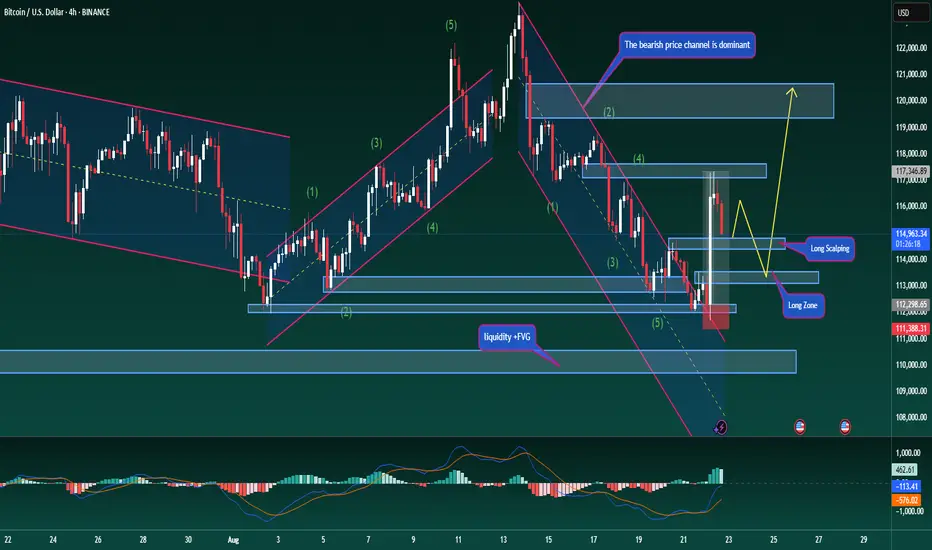
Bitcoin – Medium-Term Outlook for Long/Short TradersBitcoin – Medium-Term Outlook for Long/Short Traders
Hello traders,
BTC continues to respect the descending channel structure. Recently, price bounced strongly from the solid support around 112k, and it is now only about 2k away from the swing long target zone.
If BTC can break above the 114.8k resistance, a short-term reversal could unfold, with potential to extend towards 117.5k before resuming the broader downtrend. This scenario may also act as a trap for those holding longer-term short positions.
The structure is showing early signs of change: price is trading above the descending channel trendline, while MACD indicates rising volume and its moving averages are curving upward. These signals point to a possible corrective rally in the near term.
Strategy: Consider long entries near current levels, with the option to scale in if price breaks 114.8k.
Medium-term short positions from around 115k remain valid, targeting the 110k zone, which could also serve as a new accumulation area.
This is my personal view of the BTC market. Stay disciplined and manage risk accordingly.
What’s your outlook on Bitcoin here? Share your perspective in the comments below.

Bitcoin: America’s New Monetary Power Play🇺🇸🧠 Bitcoin: America’s New Monetary Power Play 💥📈
Today, Jerome Powell showed his hand — and it wasn’t a rug pull (yes, we were worried).
While many feared the Fed would stall Bitcoin’s momentum, Powell flipped the switch to “Support Mode” 🟢 right at the key technical level.
And let’s not forget: Trump has been quietly supportive all along .
From his early hints to broader pro-Bitcoin policies, the message is getting louder:
Bitcoin is aligning with American power.
📊 On the chart:
BTC has reclaimed the ascending channel and bounced from key support near 116K . The structure is intact, and the next levels in play are:
➡️ 122K test
➡️ 138K–140K zone
Wave 3 in motion — rocket path activated 🚀
But this breakout goes beyond the chart.
Why Bitcoin is Great for America 🇺🇸:
🛡️ 1. Fiscal Firepower Through Reserve Revaluation
The Fed already hinted at the power of marking reserves to market. Bitcoin, like gold, can unlock fiscal liquidity — without printing or taxing.
Volatility = Fiscal Ammunition.
🌐 2. It’s Already the Rails
Stablecoins are useful. But when they move globally, they do so via Bitcoin’s Lightning Network .
Bitcoin is becoming America’s invisible monetary infrastructure.
📉 3. Digital Gold in a Multipolar World
While rivals hoard gold, America integrates Bitcoin — programmable, neutral, unstoppable.
The dollar doesn’t have to die for Bitcoin to win.
Together, they can extend U.S. influence deeper into the 21st century.
⚡ 4. Real Yield, Protocol-Native
The Lightning node by C= now earns 9.7% APR in Bitcoin — non-custodial, no tokens, no middlemen.
That’s monetary throughput , not speculation.
🔧 5. Built With American DNA
From open-source roots to decentralized ideals — Bitcoin was born from American innovation.
This is not foreign tech. It’s digital sovereignty, made in the USA.
The Big Picture 🧭
Trump's symbolic backing and Powell's real-time support are not coincidences.
BTC isn’t just breaking out — it’s becoming the financial backbone of the next American era.
📈 Target zones :
122K retest in progress
138K–140K = technical extension of Wave 3 🚀
This is not just a rally.
It’s a realignment. And Bitcoin is wearing red, white, and blue. 🇺🇸✨
One Love,
The FXPROFESSOR 💙
Disclosure: I am happy to be part of the Trade Nation's Influencer program and receive a monthly fee for using their TradingView charts in my analysis. Awesome broker, where the trader really comes first! 🌟🤝📈

$BTCUSD buying continues
based on supply adding and absorbing at the lows, a large buy could drive price higher

Bitcoin · A Beautiful Sight · $200,000 Cancelled?Hello my dear friend,
Yesterday Bitcoin managed to close below a bunch of moving averages and people started to freak out; What is happening? Is this the end? The world was wondering. Many succeeded in missing the previous all-time high and EMA89 as support, a price tag of $112,000.
Today, the bullish bias is confirmed; support holds.
Bitcoin ignored testing the lower boundary of the sideways range, $100,000-$110,000, and remains really strong. People are saying that yes, it is possible now; Bitcoin can hit $155,000 in the coming months.
Trading volume is rising. With rising volume and this strong momentum we can expect additional growth. Yesterday Bitcoin was trading below EMA55, EMA34, EMA21, EMA13 and EMA8. Today, Bitcoin is recovering nicely above all these levels; a higher high comes next.
Why a higher high and not a lower high or confirmation of resistance?
Since the retrace is ending early, fast and at a high price, we know the bulls are strong; sellers are weak. Nobody is trying to get rid of their Bitcoins while many are trying to accumulate as much as possible. Bitcoin's supply is finite and will become less and less accessible; just one of the many reasons why prices will continue to grow.
Bitcoin is digital gold. A store of value.
Money for the future. Digital cash.
Thanks a lot for your continued support.
Namaste.

Potential Roadmap for BTC/USD In the next 30-40 daysVolatility incoming. It seems like BTC/USD is heading down to sweep some liquidity range at around 107-110,000.
However, market will recover after that, we are still in the "buy the dip" scenario.
End of August, I can personally still bet that BTC will sit higher than the current level

BITCOIN Local Short! Sell!
Hello,Traders!
BITCOIN made a bullish
Rebound from the horizontal
Support of 111k just as
I predicted in my previous
Analysis but now the coin
Is retesting a local resistance
From where we will be expecting
A local bearish correction
Sell!
Comment and subscribe to help us grow!
Check out other forecasts below too!
Disclosure: I am part of Trade Nation's Influencer program and receive a monthly fee for using their TradingView charts in my analysis.

BTCUSD 4Hontinuation of previous analysis
In the last update, price failed to hold support at the fair value gap and swept into sell-side liquidity around $111,843. Following that move, it has now stabilized near the $117,000 zone.
The immediate upside objective is $124,000 , an area where buy side liquidity converges with a bearish order block.
If $124,000 breaks and holds, upside continuation is likely, with extended objectives at:
TP1: $127,398
TP2: $130,077
TP3: $1302,845
TP4: $134,000 – $135,000
If rejection occurs at $124,000, price may retrace back toward $116,000.
If $116,000 fails to hold, the correction could deepen into the bullish order block around $110,000–$111,000.
This analysis highlights the market’s positioning between two key liquidity pools, with reactions at $117,000 and $124,000 expected to define the next directional leg.
This is not financial advice. Trade according to your own plan and risk management.

BTC SeahorseBitcoin and the anatomy of the seahorse pattern, starts off with a nice w double bottom formation. Breaks out from its counter trend, then forms a head when retracing before continuation to either direction buyers or sellers become stronger. Profit taking at these points also a factor not to be overlooked.

On Interest Rate News We can Blue Sky #BitcoinSimple chart, simple call on rate news from the FED. We can breakout once we rise above this area potential for new altime high is one the table this weekend.
We are still in our previous trade, just with added size on all major pullbacks. Keep Stacking Sats.

Warning!!! Critical Moment For Bitcoin! Could the top be in?!Chart says it all. You can see how Bitcoin is about to break or pullback from a multi-cycle trend line. This is a critical juncture and resistance is strong, which is why it has to do a lot of convincing to make me become bullish again. If the trend did break, then it would be huge and a new pattern will probably emerge. We certainly need to pay attention to these lines and how Bitcoin behaves in this range.


BTC: Are We Entering the Last Leg of This Bull Run?Based on my Elliott Wave analysis, I believe Bitcoin is on the cusp of its final, fifth wave of the bull rally. The recent consolidation appears to be a healthy Wave 4, setting the stage for a strong, impulsive move to new all-time highs.
While my primary count points to this final push, I'm closely monitoring for a potential wave extension. Given the current macro-economic conditions and increasing institutional interest, this last leg could be more powerful than a typical Wave 5, leading to a higher-than-expected price peak. After this final surge, I anticipate a significant market top followed by a major correction. I'm approaching this with a long bias but with strict risk management.
Disclaimer: This is not financial advice. This content is for educational and informational purposes only and is based on my personal Elliott Wave analysis. Trading and investing in cryptocurrencies is highly speculative and carries a high degree of risk. The past performance of a security, an industry, a sector, or a financial product does not guarantee future results or returns. Always conduct your own research and consult with a qualified financial advisor before making any investment decisions.
