Mastering trendbreaks - How to trade it?In this guide will the trendbreaks be discussed. The following subjects will be explained:
- What is a trend?
- What is a bearish trendline break?
- What is a bullish trendline break?
- How to trade a trendbreak?
- Example
What is a trend?
A trend is the backbone of price action in any market. It represents the general direction in which price is moving over a sustained period of time. When price is consistently creating higher highs and higher lows, the market is considered to be in an uptrend. This behavior shows that buyers are in control and are willing to keep paying higher prices with each wave. On the other hand, when price continues to make lower highs and lower lows, the market is in a downtrend. This shows that sellers dominate the market and buyers are unable to push price above previous levels. Understanding trends is essential because it gives traders a framework for anticipating what is most likely to happen next, rather than guessing in random price action.
What is a bearish trendline break?
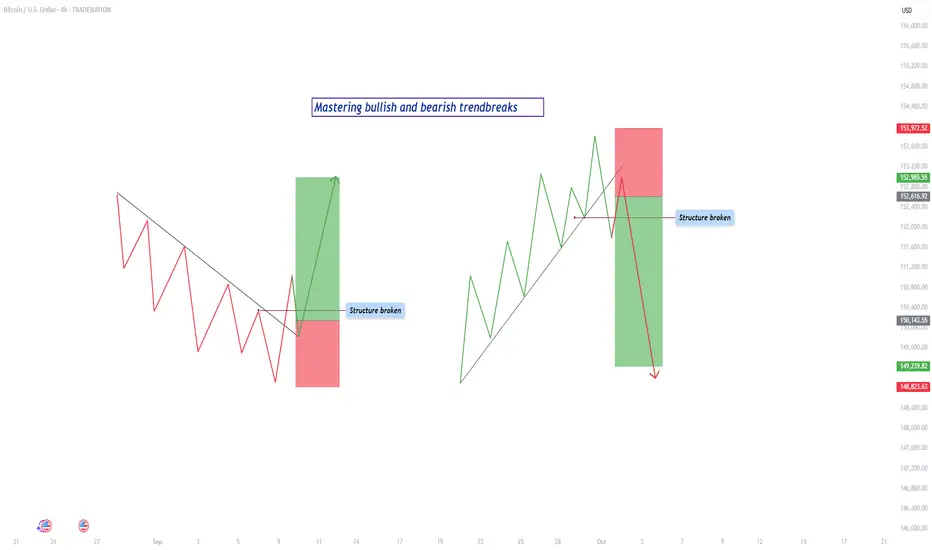
A bearish trendline break takes place when an established uptrend begins to lose momentum. In an uptrend, price usually respects a rising trendline, bouncing off it multiple times as buyers defend the bullish structure. Eventually, there comes a point when the market can no longer sustain this strength. Price breaks down through the rising trendline, signaling potential weakness. However, the true confirmation of a bearish shift only happens once the market also breaks below the most recent higher low. This is the key moment where structure changes. What was once a sequence of higher highs and higher lows now transforms into lower highs and lower lows, showing that sellers are gaining control. Without this structural shift, the break of the trendline alone might just be a temporary pullback or a false signal.
What is a bullish trendline break?
A bullish trendline break is the mirror image. In a downtrend, price respects a falling trendline as it consistently makes lower highs and lower lows. Each rally upward fails to break past previous highs, confirming sellers’ control. Eventually, price surges and breaks above the falling trendline. Just like with a bearish break, this initial move is not enough on its own. The true sign of reversal comes when price also breaks above the most recent lower high. This action destroys the existing bearish structure, which relied on lower highs to remain valid. Once that lower high is broken, the market shows that buyers have taken back control and a potential uptrend may begin.
How to trade a trendbreak?
For a valid trendbreak, three conditions must come together. First, the price must break the trendline itself, either rising or falling depending on the direction of the trend. Secondly, the breakout needs to be with strong volume. lastly, the price must also break the most recent higher low in an uptrend or lower high in a downtrend. Without this structural break, what looks like a reversal may only be a correction before the market resumes in its original direction. This distinction is crucial because many traders enter too early on a simple trendline break, only to get caught when the market snaps back into the trend. The combination of both the trendline break and the structural break provides much stronger confirmation.
Trading the trendbreak is where discipline and patience make the difference between success and failure. When the structure has been broken, it is tempting to enter immediately in the direction of the new move. But the higher-probability entry usually comes from waiting. Price often pulls back after a break, returning to retest the broken level. This retest can take different forms. Sometimes price simply returns to the broken higher low or lower high and uses it as support or resistance. Other times, price fills what traders call a fair value gap (fvg), which is an imbalance left on the chart when price moves too quickly in one direction without much trading in between. By waiting for this retest, a trader enters at a better price, with a tighter stop loss and greater profit potential.
Example
For example, imagine the market in an uptrend. Price respects a rising trendline until it finally breaks through it. Shortly after, the market breaks below the most recent higher low, confirming the bearish trendbreak. Instead of selling right at the break, the disciplined trader waits. Price pulls back upward to retest the broken higher low, which now acts as resistance. At that moment, the trader sells with a stop loss just above the retest level and targets the next support or previous swing low. This provides a controlled risk and larger potential reward.
The same logic applies to a bullish trendbreak. Price in a downtrend breaks above the falling trendline, then pushes higher to break a lower high, flipping the structure bullish. Price later dips back down to retest the broken lower high or fills a fair value gap. When it holds and begins to rise again, the trader enters long, with a stop below the retest and a target at the next resistance level.
By combining awareness of trendlines, structural shifts, and retest opportunities, traders can filter out false signals and position themselves to catch the early stages of new trends. The trendbreak is not just about spotting the first sign of weakness or strength, but about confirming that the underlying structure has truly changed. This approach gives a trader clarity, consistency, and confidence in execution, making trendbreaks one of the most powerful tools for price action trading.
-------------------------
Disclosure: I am part of Trade Nation's Influencer program and receive a monthly fee for using their TradingView charts in my analysis.
Thanks for your support. If you enjoyed this analysis, make sure to follow me so you don't miss the next one. And if you found it helpful, feel free to drop a like 👍 and leave a comment 💬, I’d love to hear your thoughts!
BTCMINI trade ideas

separating Myth from MethodTrendlines: The Most Misused Tool in Trading
If I had a pip for every time a trader got faked out by a “trendline breakout,” I’d probably have more profits than most retail traders combined. Trendlines are one of the simplest, oldest, and most powerful tools in technical analysis yet they’re also one of the most misused.
Most traders rely on what they’ve been taught in books, courses, or quick YouTube tutorials without putting in the hours of backtesting and screen time. And as every trader eventually learns: theory is a different game than practice.
A book may say:
Buy the breakout of a bearish trendline.
But in practice? Price fakes out, you get stopped, and frustration builds.
Or:
Sell at the touch of a bearish trendline.
Then price rallies and breaks the line. Again, stopped out.
The problem? Markets love to trap traders here. False breakouts, wicks, and algo-driven liquidity hunts chew up traders who rely only on “trendline piercing.” If that’s your main strategy, you’re not trading the market, the market is trading you.
But here’s the truth: trendlines aren’t the problem. The way traders use them is.
This doesn’t mean the trendline is invalid. It means the application is shallow.
For me, trendlines are non-negotiable when analysing. But I don’t take trades just because of a line. I use them in specific, tested ways that give structure to my trading and reduce false signals.
Here are the two core methods I use trendlines in my trading:
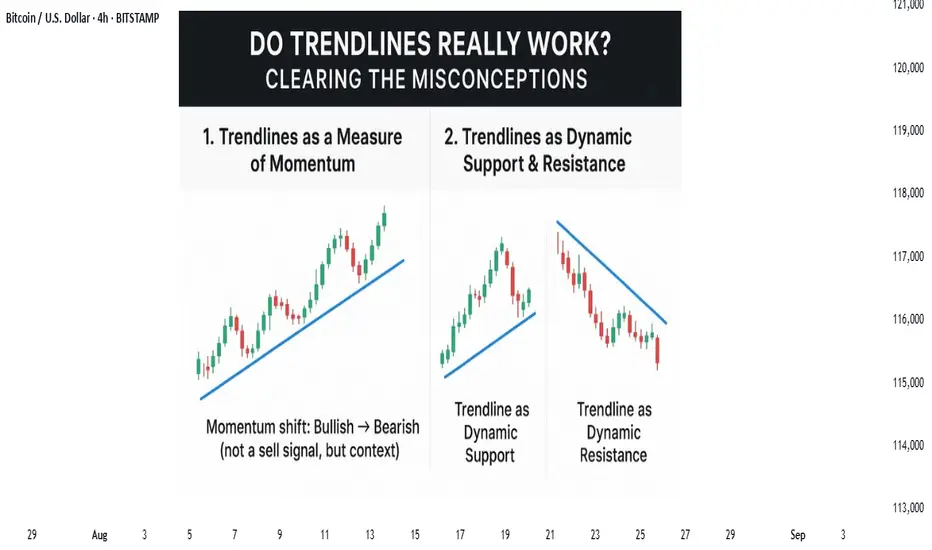
1. Trendlines as a Measure of Momentum
Momentum is the speed of price, not just the price itself. And trendlines can act as leading indicators of momentum shifts.
For example:
A break of a bullish trendline doesn’t instantly mean “sell.”
It means momentum has shifted from bullish to bearish. That’s my cue to look for sell setups that align with my strategy.
As long as price respects a bullish trendline, it signals buyers are in control, and I look for buy setups. Vice versa for bearish lines.
Think of trendline breaks not as signals but as context for setups. They tell you where the wind is blowing, not when to set sail.
For me, a trendline break means nothing unless a full OHCL candle (Open, High, Close, Low) forms entirely above or below the line.
Why?
Because a wick through a trendline is just noise, it’s the market testing liquidity, not shifting momentum. A confirmed close beyond the trendline signals that the crowd has moved, and the trend’s character is changing.
This approach drastically reduces false signals. Instead of jumping at the first poke through the line, I wait for commitment. Think of it like waiting for the market to sign the contract rather than just flirt with the idea.
chart example :
2. Trendlines as Dynamic Support & Resistance
The second use is less about breakouts and more about reaction levels. A clean, well-respected trendline acts like a dynamic S/R zone, guiding how price reacts when tested.
In uptrends, I look for bounces off the rising trendline as opportunities to join the momentum.
In downtrends, I treat the falling trendline as overhead resistance a zone to fade rallies or time entries.
What makes trendlines powerful here is context: they’re not static like horizontal levels but move with the market’s rhythm adapting as price makes new highs or lows. When combined with volume, candlestick structure, or confluence with horizontals, they create highly reliable zones.
Yes, false breaks happen but this is where order flow, confluence, and top-down analysis come in. The more aligned factors you stack with a trendline, the higher the probability of a valid setup.
chart example :
the other great thing about this is that the law for support and resistance also applies here where previous support acts as resistance and vice versa
chart example :
nerdy conclusion :
trendlines alone won’t make you money. They aren’t buy or sell signals by themselves. But used correctly, they’re an incredibly powerful map of momentum and dynamic structure.
Most importantly, don’t throw them out just because a few breakouts failed. That’s not the trendline’s fault, it’s the method.
The smarter nerdy approach is:
Wait for full OHCL confirmation beyond the line before calling it a momentum shift.
Use trendlines as dynamic support/resistance to trade with structure, not noise.
put together by : Pako Phutietsile as @currencynerd
courtesy of : @TradingView
Bitcoin Smart Money Weekly Outlook (Aug 2025)Bitcoin has been in a strong bullish structure since the breakout above $70K in 2024. Currently:
✅ Liquidity was swept above $124K highs → retail buyers trapped.
✅ Smart Money is likely to drive price down into demand zones ($95K–100K) to refill orders.
✅ As long as weekly structure remains bullish (BOS confirmed), the next target after accumulation is $130K–135K liquidity pool.
🔮 My Expectation:
Short-term: Possible retracement into $100K–110K liquidity zones.
Mid-term: Continuation towards $130K–135K (next major liquidity pool).
Invalidated if weekly closes below $95K demand.
⚠️ Not financial advice – this is an educational Smart Money perspective.

BITCOIN H4 | Potential bearish reversalBased on thee H4 chart analysis,we could see the price rise to the sell entry at 115,666.35, which is a pullbck eistance that is slightly above the 23.6% Fibonacci retracement and could reverse from this level to the take profit.
Stop los is at 118,717.95, which is a pullback resistanc that lines up with the 50% Fibonacci retracement.
Take profit is at 110,541.22, which is a pullback support.
High Risk Investment Warning
Trading Forex/CFDs on margin carries a high level of risk and may not be suitable for all investors. Leverage can work against you.
Stratos Markets Limited (tradu.com ):
CFDs are complex instruments and come with a high risk of losing money rapidly due to leverage. 65% of retail investor accounts lose money when trading CFDs with this provider. You should consider whether you understand how CFDs work and whether you can afford to take the high risk of losing your money.
Stratos Europe Ltd (tradu.com ):
CFDs are complex instruments and come with a high risk of losing money rapidly due to leverage. 66% of retail investor accounts lose money when trading CFDs with this provider. You should consider whether you understand how CFDs work and whether you can afford to take the high risk of losing your money.
Stratos Global LLC (tradu.com ):
Losses can exceed deposits.
Please be advised that the information presented on TradingView is provided to Tradu (‘Company’, ‘we’) by a third-party provider (‘TFA Global Pte Ltd’). Please be reminded that you are solely responsible for the trading decisions on your account. There is a very high degree of risk involved in trading. Any information and/or content is intended entirely for research, educational and informational purposes only and does not constitute investment or consultation advice or investment strategy. The information is not tailored to the investment needs of any specific person and therefore does not involve a consideration of any of the investment objectives, financial situation or needs of any viewer that may receive it. Kindly also note that past performance is not a reliable indicator of future results. Actual results may differ materially from those anticipated in forward-looking or past performance statements. We assume no liability as to the accuracy or completeness of any of the information and/or content provided herein and the Company cannot be held responsible for any omission, mistake nor for any loss or damage including without limitation to any loss of profit which may arise from reliance on any information supplied by TFA Global Pte Ltd.
The speaker(s) is neither an employee, agent nor representative of Tradu and is therefore acting independently. The opinions given are their own, constitute general market commentary, and do not constitute the opinion or advice of Tradu or any form of personal or investment advice. Tradu neither endorses nor guarantees offerings of third-party speakers, nor is Tradu responsible for the content, veracity or opinions of third-party speakers, presenters or participants.

BTC SELLI gonna sell when the market will break the trend cause the sellers seems like have good momentum in market

BTCUSD rebounds from firm support of 112,000.00BTCUSD rebounds from firm support of 112,000.00
The asset experienced the big decline since the mid-August, falling off the ATH at 124,500.00 towards support level of 112,000.00, which is a 10% correction. Currently now the asset shows bullish divergence on MACD. The price is expected to rise towards 115,000.00 level with a potential final target of 117,000.00.

BITCOIN (BTCUSD): Bullish Move From Support Confirmed
There is a high chance that BITCOIN will bounce
from a key daily support cluster.
An inverted head and shoulders pattern on an hourly
time frame provides a strong bullish confirmation.
Goal - 113840
❤️Please, support my work with like, thank you!❤️

BITCOIN IN DANGER Bitcoin has reached to a major resistance area between 120k to 130k, which is the resistance zone since 2021 tops.
This is the second rejection in this cycle. A fake breakout to $130,000 may occur, but the monthly candle could close below this resistance again.

BTCUSD Long After a strong push up (impulse move), price retraced sharply.
The retracement formed a descending channel (falling wedge).
Falling wedges often indicate bullish reversal potential.
Price recently touched the support zone near $111,800–$111,700, where buyers previously stepped in.
✅ Support & resistance zones are clearly identified.
✅ Pattern recognition: A descending channel aligning with a reversal setup.
✅ Confluence: The channel meets the strong historical support at $111,800.
✅ Risk-to-reward: Entry near support gives a smaller downside risk compared to the upside potential back to $123k.
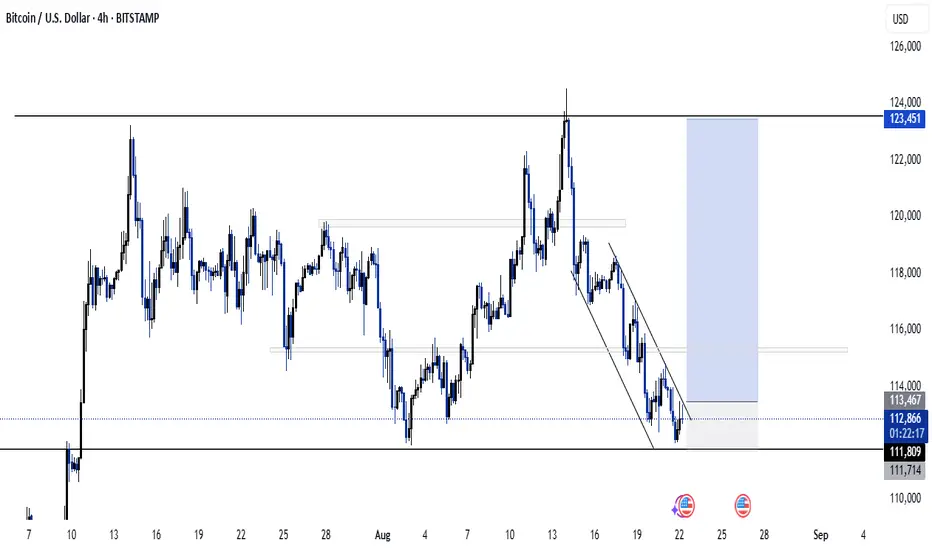

Bitcoin - Can the bulls defend this support?Introduction
After reaching its all-time high, Bitcoin has faced strong rejection, falling from $124.5k down to $113k with notable bearish volume behind the move. On this downward path, several four-hour bearish Fair Value Gaps (FVGs) were left open, signaling areas of inefficiency that the market may look to revisit. At present, Bitcoin is testing a critical support zone formed by overlapping daily and four-hour FVGs. This support level is of particular importance because holding it could provide the foundation for renewed bullish momentum and a potential recovery in price action.
Bullish scenario
For the bullish case to unfold, Bitcoin must successfully maintain support in the $111.2k to $112.7k range, which represents the current four-hour FVG. This zone serves as a pivotal point where buyers need to defend price in order to keep upward potential intact. If the market stabilizes here, the next logical target will be the four-hour bearish FVG just above. In order to confirm strength, Bitcoin would need to close a clear four-hour candle above this resistance, effectively flipping it into support. Should that occur, it opens the door for price to climb toward the $120k region, a level that would reintroduce confidence among bulls and suggest that the broader trend could still have room for continuation.
Bearish scenario
On the other hand, the bearish scenario becomes more likely if Bitcoin fails to defend the $111.2k to $112.7k four-hour FVG and instead flips this zone into resistance. While a breakdown below this area would be concerning, there is still the possibility of a short-term bounce. In such a case, price could retrace back upward toward the bearish four-hour FVG at $114.7k before facing another critical test. If Bitcoin rejects strongly from that zone and subsequently breaks below $111.2k, the market could experience further downside pressure, potentially setting up a deeper correction. This would reinforce the dominance of the ongoing downtrend that has followed the rejection at the all-time high.
Final thoughts
Bitcoin remains in a pronounced downtrend after its sweep of the previous all-time high, yet it currently sits at a strong support level that offers a chance for recovery. The market’s reaction to this support area will play a decisive role in determining whether a rebound toward $120k is achievable or whether a deeper decline is imminent. The four-hour FVG around $114.7k stands out as a key battleground between bulls and bears. If buyers can reclaim and hold this level, momentum could shift back in their favor, but if sellers defend it and force price lower, the bearish trend is likely to persist.
-------------------------
Disclosure: I am part of Trade Nation's Influencer program and receive a monthly fee for using their TradingView charts in my analysis.
Thanks for your support. If you enjoyed this analysis, make sure to follow me so you don't miss the next one. And if you found it helpful, feel free to drop a like 👍 and leave a comment 💬, I’d love to hear your thoughts!

Why $111’000RSI shows divergence. Price is at a downward trend line. Fed Chair Speech and Dirable Goods Orders will cause volatility one way or another. The market's goal is to accelerate the amplitude. Macroeconomics is restrained. This historical level has become a confirmation of the upward trend. I think there will be a test.

BTC , The Real Support ZoneFVG and IFVG are the True Support and Resistance Zone/Level. Most of the people rely on text book and that's why retail get screwed.

lower highs and lower lowsIts been a bit since I posted some technical analysis but I wanna be more consistent.. so here we go..
My broader bias remains tilted to the downside, with the key objective being a sweep of the low around 111,842. Any rallies from this bullish divergence printing should be approached cautiously, as the structure is still producing lower highs and lower lows.
If price does push higher, the next major area of interest sits between 114,786 – 116,000, where several confluences line up: the Fibonacci retracement, the developing/naked POC, and the Value Area Low. This zone will be critical for monitoring potential rejection or continuation to the upside..

BTCUSD Analysis – Key Levels & Market OutlookThis analysis focuses on BTCUSD, highlighting the most important support and resistance zones, current trend outlook, and potential trading opportunities.
Key Support Levels
Key Resistance Levels
Possible Breakout or Reversal Scenarios

$BTC bitcoin face ripper rallyCRYPTOCAP:BTC bitcoin face ripper rally
going into j pow show. this should rip to new highs

BTC Two Scenarios - Hourly Chart - 22 Aug 2025BTC is in a bearish trend and making a series of lower highs and lower lows as well as staying in a particular zone highlighed in RED. There are two scenarios and trade setups possible:
SCENARIO 1: Following the trend
Considering the current trend, there is high possibility that BTC may still follow the bearish trend and stay in the zone. In this case, we can enter a SELL trade at current market price of $112, 600 with a stop loss defined at the previous lower high of $115,020 because if the price reaches that point, it would mean BTC has broken the trend. Take profit in this case can be placed at $110,150.
SCENARIO 2: Breakout Possibility
In case of a breakout from the current zone, there is a potential of trend reversal. In this case, we would wait until the previous lower high is broken as well which would further confirm our trend reversal theory. We can place a BUYSTOP trade at $115,050 with a stop loss defined at the previous lower low of $111,800 and thus take profit calculated at 118,300 based on 1:1 risk ratio.

Temporal Aspect of FractalityIn this publication, I would like to bring some clarity to the series of my unconventional analysis.
At this stage of my research I have no doubt that market's natural growth patterns can be defined by historic range and power exponents of Phi. Essentially, it's just two overall fib channels that cover structural boundaries of bullruns from ATH to new ATH mapped to bottom as 3rd coordinate. When we have angle of fibs derived from chronological highs, the ratios would cover the levels of oscillation from price scale perspective.
Whereas the temporal aspect of fractality, requires looking for frequency of reversals in price dynamics. So instead of connecting pivots of same classification, we interconnect opposite points of extremes in order to tune fib direction to the angle of trend and map 3 coordinate to next swing point. This way the spacings that come with the fib proportions would indicate rhythm of trend occurrence.
The primary objective of this publication is to expose traders to the forces underlying market behavior. Specifically for illustrating temporal rhythms, the end result seen in interactive chart looks like a more simplified version of works i've shared earlier.

BTCUSD-SELL strategy Weekly chart GANNBTC is starting to behave southwards. We reject $ 125K hampered by $ 130k GANN resistance. Now we are in negative territory and I feel we may see $ 90k test in the near term.
Strategy SELL @ $ 110-120k and take profit initially at $91k area. Overall we may see move lower towards $ 75k.

Feeling the charts, forecast for August 22, 2025.
I am engaged in the extrasensory of stock charts, that is, the feeling of the energy of the future chart, this is a meditative technique, and the feelings are mainly tactile.
Forecast for August 22, 2025, I have drawn my feelings for tomorrow on the chart - I expect a fall at the very beginning of the day and at the end...
At the moment, I do not analyze the prices, I only pay attention to the price movement impulses. I consider my forecast to be good if the outline of the real chart matches the outline of the chart I drew as a forecast, meaning that the direction and time period of the price movement are correctly indicated.

BTC/USD 1H Short-term1. Main trend (short -term)
• The price is under the downward trend line (black line).
• Until this trend is broken up (approx.> 113,000–113,500 USD), the advantage remains on the Bear (inheritance) side.
2. Support and resistance
• The next support: 112.017 USD (if it falls → the next target is USD 111,232 and then 110.015 USD).
• The nearest resistance: USD 112,959, then USD 113,528 and a stronger level of USD 114.667.
3. Candle formation
• The last candle tests support at USD 112.017 and a defense attempt (lower wick) appears. This may suggest a short reflection, but still as part of the inheritance trend.
4. Oscillators (Stochastic RSI at the bottom of the chart)
• The indicator is in the sales zone (<20) and begins to turn up → a signal of a potential short -term reflection (SCALP LONG).
• However, if the reflection does not overcome the downward trend line, it will be just a correction rather than a change in the trend.
⸻
📊 short -term scenarios
• Bullish (reflection): If BTC maintains USD 112,000 and stochastic, he pulls up, possible traffic up to $ 112,950-13,500 (Trendline test and resistance).
• Bearish (continuation of declines): a breakdown of USD 112,000 opens the road to USD 111,200 and even USD 110,000.
⸻
📝 Application
• Trend for 1H: inheritance.
• Short -term signal: possible reflection from support (112K → 113.5k), but until the price boosts the downward trend line, the scenario of further declines dominates.
• Key level for observation: USD 112,000 (maintenance = reflection, breaking = further declines).

