BTC recently broke through the descending channel Market picture and sentiment
The price is trading around $114,942, down slightly by about -0.65% on the day. Daily range: high - $115,833, low - $114,583.
The medium-term and long-term trend remains bullish, supported by large capital infusions (ETFs, institutional purchases).
Bernstein analysts suggest that the current bull rally could last until 2027, which is significantly different from the usual four-year cycles.
Support and resistance levels
Resistance:
The nearest zone is $120K-121K, where growth was expected to slow and consolidation.
The long-term target is $135K, and even $150K by 2026, according to analysts' forecasts.
Support:
Multiple bounce point at $110K–112K is critical to maintain bullish momentum.
Nearest technical support at $111.9K, followed by $107.4K and $105.2K.
Technical Momentum and Structure
Consolidation is seen around $113.8K, with volumes rising (to $48B), signaling pent-up interest despite short-term fatigue.
BTC recently broke out of its downward channel, a positive sign. RSI remains favorable, and declining balances on platforms indicate institutional accumulation.
A breakout of $114K could trigger upside potential to $143K (25%) and further to $200K, according to Rosenberg Research.
BTCMINI trade ideas

Bitcoin back at 112k: Bullish Illusion or Bearish Truth?1. What happened lately
In my previous BTC analysis, I mentioned that as long as the 110k zone holds, the bullish structure technically remains intact.
On Friday, Powell’s speech lifted the market precisely from that zone, as the possibility of rate cuts injected optimism across risk assets, including crypto.
2. The psychological trap
But here’s the question I keep asking myself: is this genuine strength, or just wishful thinking? I’ve said it many times — trade what you see, not what you hope for . And what the charts are showing right now is not as promising as the initial bounce might suggest.
3. Technical signals
- BTC quickly returned to the 112k support level, erasing the Friday rally.
- Price remains under the trendline that started in April.
- The bounce looks more like a retest of broken levels than a new impulsive leg.
- Structurally, we can even identify a head and shoulders pattern with the neckline around the 110k zone, although not perfectly shaped.
4. Reading between the lines
It’s hard for me to believe that Bitcoin came back to the same support just to give latecomers another easy buying opportunity. More likely, the “rate cut euphoria” was dead cat bounce, and the market is telling us something different than the headlines.
5. Conclusion
At this moment, I remain neutral in my positioning but leaning bearish in my outlook. Optimism is tempting, but discipline requires us to trust the charts, not our hopes.
And... if it looks like a duck, walks like a duck, and quacks like a duck… it’s probably a duck. 🦆

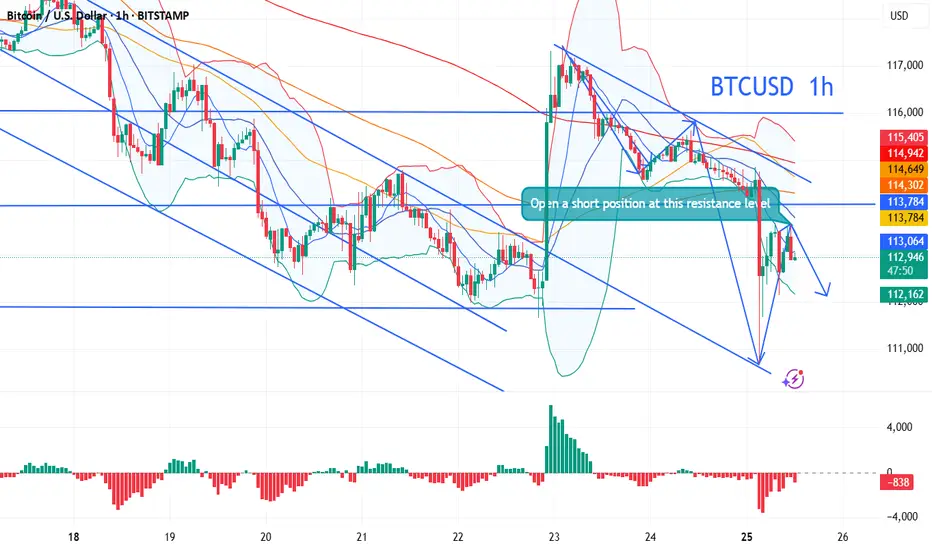
Testing a new strategySo I just learned this strategy and am excited to see how it turns out. So according to the strategy in this particular scenario, BTCUSD should continue downward but only time will tell. See the image for a more in depth explanation. I try to make everything a simple as possible. For those of you who enjoy reading.
There are four sections the two in the middle are the main indicators to see if an asset will continue either upward or downward. Thats pretty much the simple explanation for this.
Like always this is purely educational not in any way shape or form. NOT FINANCIAL ADVICE.

#BTCUSD - $25,000 move? Are you Ready?Date: 17-08-2025
#BITCOIN - Current Price: $1,18,000
Pivot Point: $1,20,686.50 Support: $1,16,271.72 Resistance: $1,25,139.59
Are you ready to see the big movement in #bitcoin in the coming days? Watch out these levels carefully and trade accordingly. There can be sudden & wild moves as well.
Upside Targets:
--------------------------------
| Target | Price |
---------------------------------
| 🎯 Target 1 | $1,30,574.04 |
| 🎯 Target 2 | $1,36,008.50 |
| 🎯 Target 3 | $1,41,754.25 |
| 🎯 Target 4 | $1,47,500.00 |
Downside Targets:
| 🎯 Target 1 | $1,10,818.11 |
| 🎯 Target 2 | $1,05,364.50 |
| 🎯 Target 3 | $99,618.75 |
| 🎯 Target 4 | $93,873.00 |
#Crypto #Bitcoin #BTC #CryptoTA #TradingView #PivotPoints #SupportResistance
#TradingView #Nifty #BankNifty #DJI #NDQ #SENSEX #DAX #USOIL #GOLD #SILVER
#USDINR #EURUSD #USDJPY #NIFTY_MID_SELECT #CNXFINANCE
#SOLANA #ETHEREUM #BTCUSD #MATICUSDT #XRPUSDT

#BTCUSD Showing bullish 5 swings, any panic can be bought slowlyBINANCE:BTCUSD Bitcoin looks bullish from day one this year. Now it shows 5 swing structure, and any panic it might do is buy in 3-7 swings. As far as it could stay above 74393 we could see more highs in the coming weeks.

Bitcoin Strategy AnalysisBitcoin experienced a rapid decline a few hours ago. The main factors contributing to this short-term market correction and decline are as follows.
Impact of Federal Reserve Policy Expectations: Market expectations regarding the direction of the Federal Reserve's monetary policy have shifted. Expectations for a September rate cut, initially as high as 98%, subsequently plummeted to 15%. This rapid decline in expectations for a rate cut has dampened investor interest in risky assets, leading to a sell-off of Bitcoin as a risk asset.
ETF Flow Reversal: Bitcoin ETFs have recently experienced net outflows, and the Ethereum ETF has also seen nearly $196.6 million in outflows. The withdrawal of funds from cryptocurrency ETFs has exacerbated market pessimism and created selling pressure on Bitcoin prices.
Regulatory Uncertainty: The US Securities and Exchange Commission has delayed its approval of altcoin ETFs, while progress on stablecoin legislation remains unclear. The previously passed cryptocurrency regulation bill, the "Genius Act," is also on hold. This regulatory uncertainty has made investors hesitant to hold positions, prompting some to sell Bitcoin. Technical Triggers: Bitcoin previously encountered strong resistance near $124,000. Failure to break through this resistance triggered automatic sell-offs and forced liquidations of leveraged positions. According to data, over $1.2 billion in long positions were liquidated on major exchanges over the past 72 hours. This mechanical selling pressure accelerated the price decline.
In the short term, Bitcoin is forming a "top-down bearish" pattern on the daily chart. The 4-hour chart shows a short-term downward trend, accompanied by a long upper shadow, indicating significant selling pressure from above. The MACD indicator is forming a death cross, indicating a dominant position for bears.
Short-term Trading Strategy:
Open a short position near 114,500, with a target of 112,100.
The market is volatile, so these suggestions are for reference only. Please follow my updates for more detailed strategies.
BTCBitcoin is showing bullish momentum and may rise toward its previous high. Traders should monitor price action closely for confirmation of this upward move.

BTC HTF analysisBTC Already tested its long buy area so it is possible it will not stop and go up unstoppable or if it can retest again for BSL to go up further as this year target is 150000$.

Bitcoin Short: Wave 3 (Target $98,400)As I explain in this video, I believe that Bitcoin is currently in a wave 3 down. Last Friday's Powell's dovish statement serves as the corrective move wave 2 up after completing a wave 1 down.
The stop loss for this idea is above $115,000. The take profit target remains the same at $98,400.
Good luck!

BTC 4H🖤Bitcoin, after liquidating well-positioned longs, is preparing to seek the 117k zone.💣💥Bullish divergence in formation

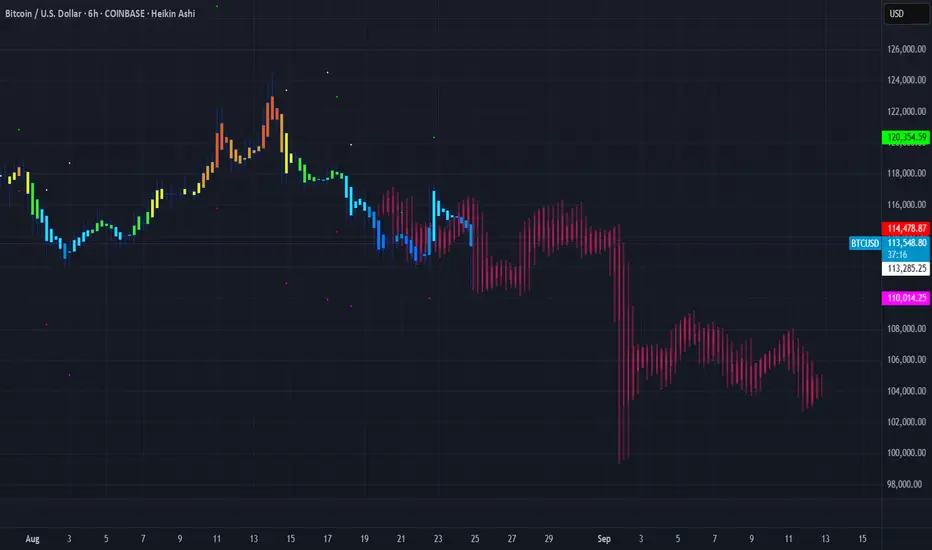
▒₿▒ BITCOIN FORECAST | 6HR ▒₿▒COINBASE:BTCUSD
This post is based off of historical price action analysis and Fibonacci measurements. I am not including these in the main chart as I like to put the focus on the price action for all of you. In a day and age of information we can tend to overdo it sometimes and the price action is something that is extremely fundamental when it comes to analysis, patterns and forecasting.
I've identified a unique pattern viewable in Heikin Ashi that signals trend exhaustion and distribution at major market tops. I will be working on another post showing this.
Historically, this pattern has resolved to the downside in a significant way. I've been out of the "game" for a few years in addition to this cycle being like no other. We've broken previous patterns, trends and correlations from previous cycles. I am still working to nail down these forecasts.
I've got a big project that I'm working on so my time is limited here, however I am developing and testing some indicators which I will be releasing here soon. In addition to this as I put more time into BTC analysis I will begin to have more accurate forecasts and long-term planning for BTC investments and trading.
As it is right now. I have had at least one person call me crazy and a noob for saying this but we can expect the BTC Bear Market Low to be about $33K in 2026. I will be doing a post on this too. I am well aware of the cost to mine a single Bitcoin and Capitulation and we did see this happen before in the past.
Here is how the current forecast looks on the 1Day.
I am now forecasting a break of the critical support trendline, currently sitting around $112,500.
A confirmed 6H candle close below this level would, in my view, be the final confirmation. This could trigger a much deeper and faster correction than many are expecting, with a first major target in the $100,000 - $104,000 zone.
There still of course remains the possibility of BTC hitting our target Bull Run Peak of $150K in December of this year. This a little less likely as I have additional information I have come across in my analysis. While we saw major resistance at the $124K levels, a huge rejection, trends broken on the daily charts, and potential consolidation there is still hope for BTC's $150K run. The Pi Cycle and other information does tell a different story.
One thing is for certain (almost certain) and that is that the identification of the Twin Shooting Star Candles on the 1-Week indicates we are going into weeks or months of a bear market and/or consolidation.
My view is more than likely not going to change on the short term (weeks to a few months) of BTC going down and/or consolidating. The critical level is that $100K mark, if we drop below this consider it highly unlikely that we will be making that run to $150K.
DISCLAIMER
I AM NOT A FINACIAL ADVISOR, NOR AM I YOURS. THIS IS NOT FINANCIAL ADVICE. MEARLY DOODLINGS ON A MATHMATICALLY DRIVEN GRAPHICAL INTERFACE, TRACKING AN INVISIBLE 256BIT MILITARY-GRADE ENCRYPTED ASSET. . . FOR ENTERTAINMENT/AMUSEMENT PUROSES ONLY. ENJOY!
BRIEFING Week #34 : The Rotation may have BegunHere's your weekly update ! Brought to you each weekend with years of track-record history..
Don't forget to hit the like/follow button if you feel like this post deserves it ;)
That's the best way to support me and help pushing this content to other users.
Kindly,
Phil

Frames of Reference🏛️ Research Notes
Fibonacci Channels as Frames of Reference
Just like Schrödinger’s wave equation describes all possible states of a quantum system, the market at any moment holds a spectrum of potential price paths. Hence, commonality is that, the wave function is a mathematical description of probabilities, not certainties, just like market state is a blend of possible moves, not a single predetermined path.
In quantum mechanics, choosing a measurement basis determines which aspects of the wave function become clear. In charting, each Fibonacci channel is a “measurement frame,” tuned to a certain proportion or scaling law that the market tends to respect. So if we say have multiple channels, then by overlaying several, you capture different interference layers, revealing systemic alignments that a single frame would miss. (Structure Memory and Duality )

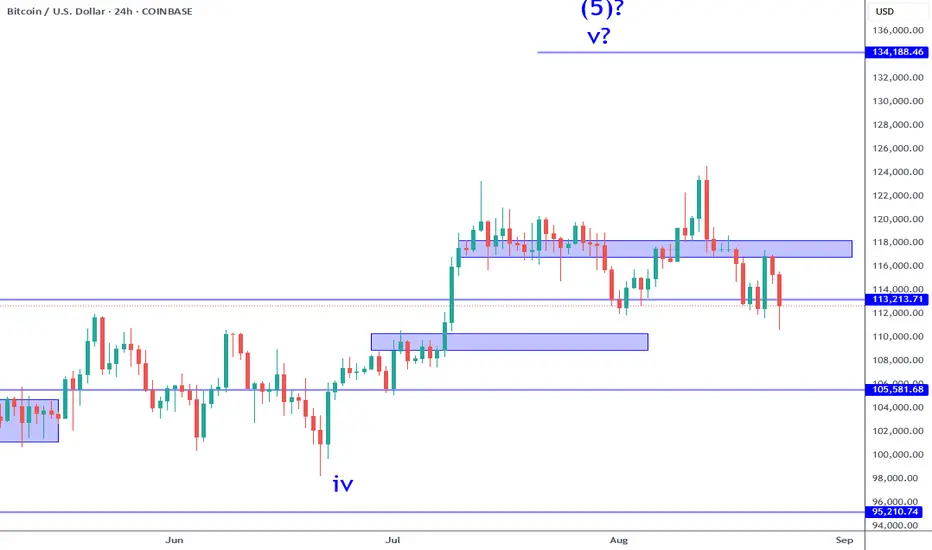
Bitcoin: Wave 4 Unitl 108K Break.Bitcoin has just established a lower high in the 117K area. While this is a bearish sign for intraday time frames, the broader structure has yet to confirm a change. The change I am looking for is the price overlap of the 108K area. The 112 to 113 support area while some what broken, has not followed through yet. IF price stays in this range and manages to say above 108K, then this can still qualify as a wave 4. IF 108K breaks, then this confirms that the 5 wave structure is likely complete. If that's that case, the bigger picture outlook becomes more bearish.
The bearish scenario I am referring to is the broader Wave 2. Keep in mind, if this is the case, it can take a very long time to play out (months, years). And a series of catalysts would likely be in play. We have nothing like that yet. Also keep in mind, Bitcoin follows the Nasdaq, with lower interest rates, and easier monetary policy on the horizon, tech stocks are likely to benefit which should be a positive. Not a strong argument fundamentally. This is why if you are considering the short side, it is best to work on small time frames and keep risk tight in my opinion.
While any pull back is tempting to buy, this one is tricky because of the conflicting situation. 5 waves may be complete which means the pullbacks from here are more likely to break. Especially support levels that are obvious like 113K. Either work on smaller time frames like 1H or 4H and expect a smaller bite upon a signal confirmation, OR wait for the next level like the 105K to 108K area support for a swing trade with greater potential. Buy signals that confirm between 112 and 108K area could look to the 115 to 118K area for profit potential. It is touch to calculate when there is no confirmation on the chart.
Thank you for considering my analysis and perspective.
Feeling the charts, forecast for August 25, 2025.
I am engaged in the extrasensory of stock charts, that is, the feeling of the energy of the future chart, this is a meditative technique, and the sensations are mainly tactile.
Forecast for August 25, 2025, I have drawn my feelings about tomorrow on the chart - I expect the growth of Bitcoin throughout the day...
At the moment, I do not analyze the prices, I pay attention only to the price movement impulses. I consider my forecast to be good if the outline of the real chart matches the outline of the chart I drew as a forecast, meaning that the direction and time period of the price movement are correctly indicated.

"BTC – Head & Shoulders Could Signal a Drop Toward 102K"🧠 Bitcoin (BTC/USDT) Technical Analysis – 4H Chart
✅ Pattern Formation
A classic Head & Shoulders pattern has formed on the chart.
Left Shoulder: around $120,000.
Head: peak near ~$124,000.
Right Shoulder: around $119,000 – $120,000.
Neckline: positioned around $112,000 – $113,000 (current price area).
This setup is considered a bearish reversal pattern if the neckline is broken with a clear close.
🎯 Target Projections
Distance from the Head to the Neckline ≈ $12,000.
Measured move target after breakdown = $112,000 – $12,000 = ~$100,000.
Key Support Levels:
$108,000 – $106,000 (intermediate support).
~$102,100 (major support, aligned with the H&S target).
$100,000 (psychological round-number support).
📈 Alternative Bullish Scenario
If BTC quickly rebounds from the neckline and reclaims $118,000 – $119,000, the bearish pattern would be invalidated.
In that case, price could revisit the $124,000 resistance zone.
⚠️ Disclaimer
This analysis is based purely on technical chart patterns and does not represent financial or investment advice. Traders should conduct their own research before making any decisions.


BTC/USD Long SetupBTC/USD Long Setup
Price is showing signs of reversal after a consolidation near intraday support. A long position has been placed with a stop loss below recent structure and a target near resistance.
Entry: 114,556
Stop Loss: 114,266
Take Profit: 115,406
Risk-to-reward ratio is favorable, with potential upside if price holds above EMA 9. Watching for continuation momentum toward resistance.

BTCUSD| - Bullish Structure & Continuation Setup
Pair: Bitcoin (BTCUSD)
Bias: Bullish
HTF Overview (4H): Bullish structure remains firm. Last week, price broke a major high cleanly, confirming upside intent. Current focus is on continuation toward fresh highs.
MTF Confirmation (30M): Structure refined. Sell-side liquidity was taken, and although internal structures broke, the major frame stayed intact. Price mitigated the refined level and has now switched bullish on the LTF. Waiting on a sweep to refine entry.
Entry Zone (5M): Entry will trigger after the sweep + pullback confirms direction on the lower timeframe.
Targets:
• TP1 = 5M highs
• TP2 = 30M highs (depending on market delivery)
Mindset Note: Trade within structure. Internal breaks don’t override the bigger picture bias — stay aligned with HTF intent.

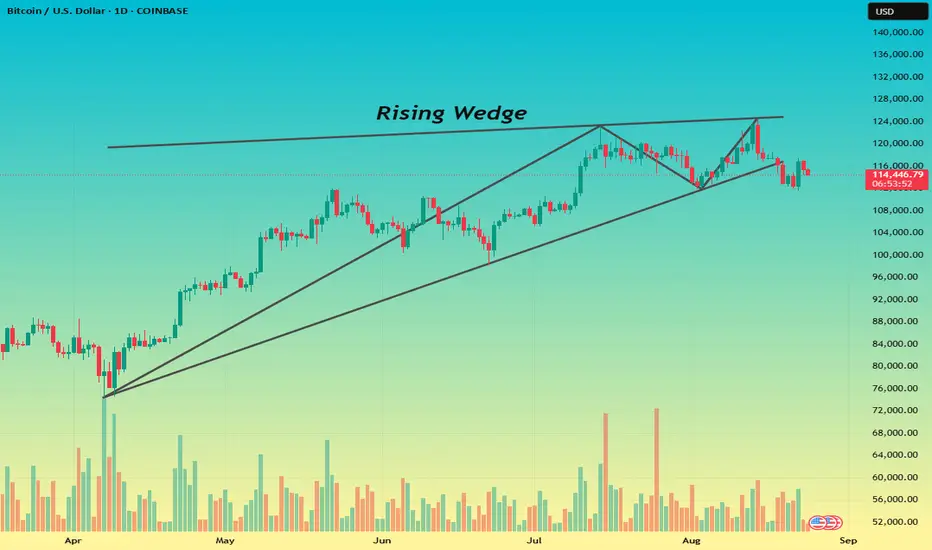
Bitcoin Rising Wedge Breakdown – Is a Deeper Correction Coming?Bitcoin Rising Wedge Pattern – Daily Chart Analysis
🔹Bitcoin (BTC/USD) forming a Rising Wedge pattern, which is typically considered a bearish reversal pattern
Pattern Formation
Price has been making higher highs and higher lows, but the slope of the highs is flattening compared to the slope of the lows.
This indicates weakening bullish momentum.
Breakdown Signs
BTC broke below the lower wedge support, confirming a bearish breakdown.
Current price action is retesting around $114,000 – $116,000, acting as a possible resistance zone.
Notice the declining volume during the wedge formation, which strengthens the validity of the pattern.
A spike in volume during the breakdown adds further confirmation.
Target Levels
If the breakdown sustains, potential bearish targets could be around:
$108,000 (immediate support)
$100,000 (psychological level & major support)
On the upside, if BTC reclaims $120,000, the bearish outlook weakens.
Btcusd Btcusd am expecting price to reject that support zone on the daily time frame then a reversal candle stick be4 buying Btcusd

BTC 4H – Retracement or Breakdown Toward $112K?Bitcoin is pulling back after its recent bounce, currently trading around the 0.5 retracement zone. Price action is consolidating within the gray box, and the next move will determine whether bulls regain control or if another leg lower develops.
Bullish case: If BTC holds above the 0.5 fib midpoint, a push back toward $118K–120K (recent highs) is possible, continuing the recovery structure.
Bearish case: Losing the $113,102 support risks sliding into the $111,962 demand zone, where a reaction will be crucial for trend continuation.
The Stoch RSI shows cooling momentum, suggesting short-term weakness but leaving space for either a deeper correction or a fresh impulse.
Key levels:
Resistance: $118K–120K
Support: $113,102 → $111,962 (demand zone)
Midpoint: Current 0.5 retracement level
BTC is at a make-or-break level: hold here for continuation or break lower into deeper support.
