BTCUSDT - EXTREME ARE - trade BTCUSDT - EXTREME ARE - trade , use risk and trade managment for consistency
BTCMINI trade ideas

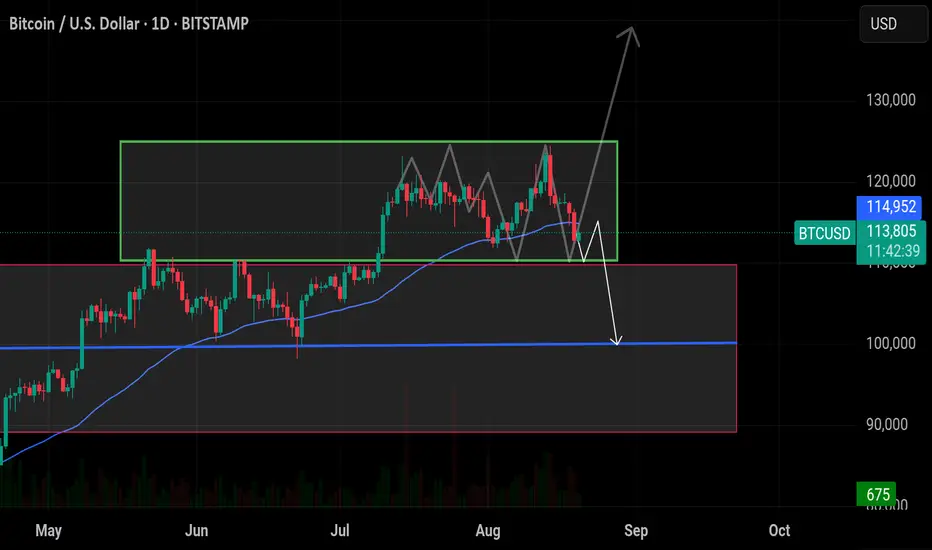
20.08 2025 In my opinion we should prepare to go down and grab the liquidity below this week and 111,900. We are so close to it and it can happen even in minutes big candle to grab it and then we will look for next moves. I opened a short at 113,900.

BTC LONG SETUP ,Long Entry $113,200BTC LONG SETUP
Long Entry $113,200
Targeting $115,400 or Above
Trading Plan : IF btc go down to $112,100
will add more longs
Resistance $116500-117k
Demand Zone $111-113k
Not a Financial advice

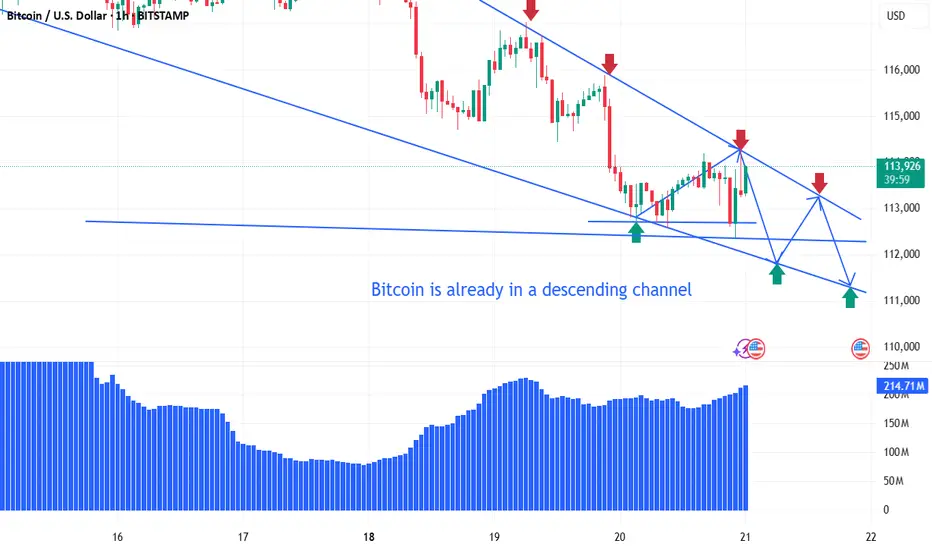
Strategy: Open a short position when Bitcoin reboundsAs mentioned previously, Bitcoin is in a descending channel, and the strategy of shorting on rebounds is correct. After rebounding above 114,000, it encountered resistance from the descending channel and then fell smoothly, pocketing profits from the short position.
A small-scale downward trend channel forms within this channel, where the market primarily experiences volatile declines. A break below the channel will accelerate the decline.
For short-term trading, long positions should be established at channel support and short positions should be opened at channel resistance.
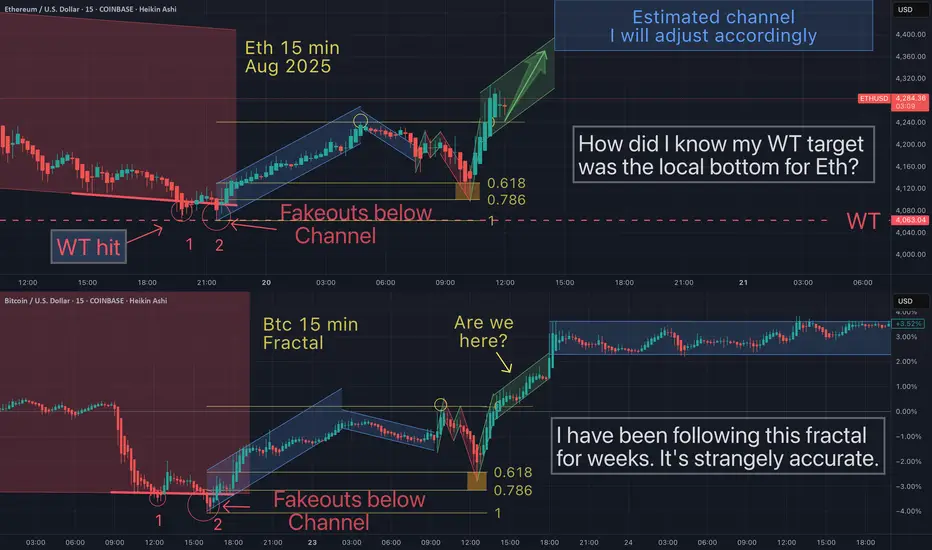
Eth has been following this exact Btc fractalIn the world of graphing (charting) and linear equations, the concept of "fractals" would be mathematically improbable. But in charting, fractals work - until they dont. Fractals usually stop working as an exact map when you LEAST expect (or want) then to.
Gold/Bitcoin → Latest Trading StrategiesGold prices, Bitcoin, and foreign exchange all fell to varying degrees yesterday. Our sell orders all saw profits, which is cause for celebration.
With the Federal Reserve's interest rate decision imminent, the Swing Trading Center's trading outlook is to position long positions in advance, anticipating a significant rise after the decision. Gold prices are currently at a new low this month, hitting 3311, and are currently quoted at 3322. A tentative target for a short-term rebound could be around 3345. Buy below this level for preemptive trading.
BTCUSD also experienced a significant decline during the US dollar's rise. This may be related to Trump. This is a game between safe-haven assets. Before the US dollar experienced a significant decline, gold and Bitcoin would have to take a back seat, as the US dollar remains the primary safe-haven asset.
The downward trend in gold and BTCUSD requires significant news to revive and break the trend. Therefore, short-term traders can place buy orders in advance and wait for the market to rise.
Bull Run incomingBull Run incoming Bull RunBull Run incoming Bull Run incomingBull Run incomingincoming Bull Run incoming Bull Run incomingv

BTC Theoretical Forecast: Genesis Fib 111k > blow off top 130k?I am expecting one last pullback, targeting the 111,600 Genesis Fib - 108,500 is not out of the question either, before a possible charge towards 128k-130k. What happens after that is not certain, but I expect a sharp pullback.
This chart uses my 'Rayn Channels' system to explore this possibility. I hope everyone makes use of it in their own way and gets paid.

BTCUSD set to rise $124482?BTCUSD trade setup for today :
Before we look at potential entry in this pair first let’s look at multiple timeframe analysis in this market.
Monthly: 124482 Monthly resistance price has got rejection strongly from the top
Weekly: Price has just got just broken out of the support
Daily: Price on the daily significant support level
Entry timeframe 4H : Price has printed 4h has got rejected strongly from the daily support level.
Possible trade recommendation : Bullish trade with high probability set up

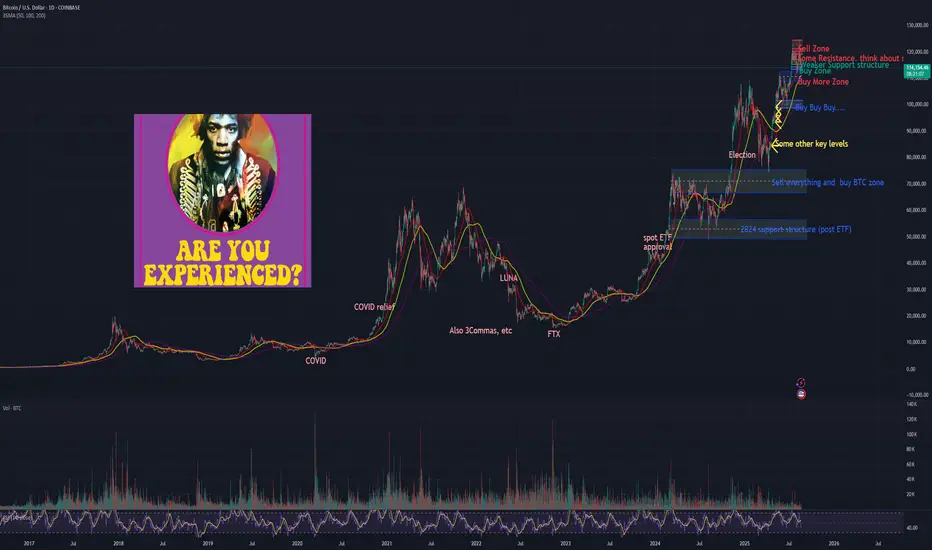
BTC daily chart with some historical stuff & moreSome major historical milestones since Covid, plus my current support and resistance levels.
Have you ever been, experienced? :)
BTC Analysis - August 20, 2025, 09:28 AM EDT 📊 Price: ~$114,016, consolidating after failing $120,000 resistance (24h).
Technical Analysis:
• Supports: $112,300, $108,000
• Resistance: $116,800, $120,000
• RSI: 46 (daily, neutral), 50 (4-hour)
• MACD: Bearish, histogram narrowing
• EMAs: Below 20-day ($117,300), above 50/200-day ($115K/$110K)
• Bollinger: Near mid-band ($115,400, daily)
Patterns:
• Ascending Channel: Retest of mid-channel ($114K–$115K, August 15–20)
• Bearish Pinbar: August 14
• Doji: August 19
On-Chain:
• MVRV Z-score: 2.2, neutral, nearing rally trigger
• Active Addresses: Up 3% (30d)
• CDD: Low, strong HODLing
• LTH Supply: 74% held >155 days
• STH Supply: Down 13% (30d), profit-taking
Fundamentals:
• M2: $107T (Feb 2025), 3.8% growth, 0.94 correlation with BTC
• ETFs: $15B inflows (2025), $0.8B weekly (August 15)
• Regulatory: GENIUS Act supports crypto (July 2025)
BTC Reserve: Exchange reserves down 10% (2025), low selling pressure.
Dominance: 61% (BTC.D), neutral, altseason if <63.2%.
Social Sentiment: 450K #BTC mentions on X, 55% bullish ( low volatility, dip-buying).
Trends: Neutral short-term, possible dip to $112,300. Long-term: $130K–$200K (2026).
Signal: Buy (60% confidence)
• Buy on dips: $112,300 or $108,000
• Stop-loss: <$108,000
• Target: $116,800 short-term, $130,000 (Q4 2025)
Disclaimer: Research before investing. #BTC

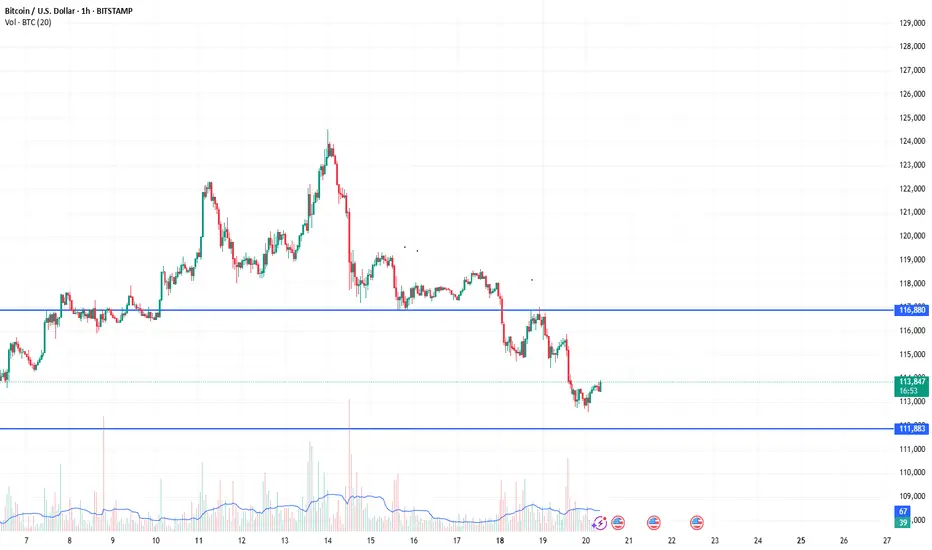
BTC support and resistance levels for recent swing tradingHourly chart. Just like anything else this can change depending on outside forces, but for the past 45 days or so it has served me well.

BTC 4hr back to beginning of 2024This goes with the other two charts I am publishing, it's kinda the "intermediate" one, the other two are the daily going back to pre-COVID and the hourly which I'm currently trading from.

BITCOIN BOTTOMING NOW ABC WAVE 4low The chart posted is that of bitcoin .Last week I stated atop can be counted once again .Now I see the high as wave 5 of 3 of 5 .This would mean that the last up leg is just ahead target 130 k plus or minus 2k this should end the bull run from 15,800 and much more serious decline is coming into OCT PANIC .Best of trades WAVETIMER

Bitcoin, Quick Update · Is The Retrace Over?We are looking at Bitcoin and we are tracking Bitcoin's movements but we trade mainly the altcoins. How Bitcoin behaves affects the altcoins market and how the altcoins market behaves reveals what Bitcoin intends to do next. The chart reveals what is happening and what is about to happen.
Bitcoin produced a low of $112,000 2-August. Today Bitcoin produced a low of $112,353. If $112,000 holds as support or remains unchallenged, we can have an early end to the present retrace. Several things to consider:
1) Trading volume is low and this can be considered good. It can happen that the retrace ends or the final flush is still upon us. In both scenarios everything unravels within the next few days. No more than a week.
2) Trading volume was really high on the bearish side late July but so far there is no follow through.
3) Seeing six days red yet only a small retrace is a positive signal. Again, it can happen that the final flush happens today and the market turns. Something to keep in mind; when a flash crash happens, we tend to think of this as the start of a major down-move but normally this is the end. It can happen that Bitcoin moves lower and that's it, it starts to grow again.
4) Seeing how the market lacks bearish pressure—and also how the small altcoins are performing—we are going with the bulls.
5) As long as Bitcoin trades above $110,000, we are bullish long-term. Above $112,000, ultra-bullish including the short-term. When Bitcoin is trading above $100,000, the bullish bias is confirmed. It doesn't matter how you slice it, the bulls have control of this chart. The trading price is the most important data point and right now Bitcoin's price is really strong.
If $112,000 holds, expect Bitcoin to grow.
Namaste.

BTC/USD – 1H | From Rejection Block to Breaker BlockBTC is consolidating around a rejection block at the lows while liquidity is sitting above at breaker block levels. Price is building for a decisive reaction.
📈 **Bullish Scenario**
* Hold above **112,800 – 112,400 rejection block**
* Push into **114,000 swing high**
* Break toward **115,600 OB zone → 116,900 breaker block / P1D High** 🚀
📉 **Bearish Scenario**
* Failure to hold rejection block
* Breakdown below **112,400 → 111,800 swing low**
* Further liquidity draw toward **111,200 lows** 📊
**Key Levels**
* Rejection Block: 112,800 – 112,400
* Swing High: 114,000
* OB: 115,600
* Breaker Block / P1D High: 116,900
* Swing Low: 111,800
* Strong Low: 111,200
💬 Will BTC respect the rejection block for a bullish drive, or break lower into deeper liquidity?

BTCUSD Trendline Break SetupThis chart presents a potential bullish scenario for BTCUSD on the 1-hour timeframe. After testing support around 112,821, the price looks ready to break above the descending trendline, which could trigger an upward move targeting key liquidity levels near 116,774 and beyond. The stop loss is set below recent lows to control risk, offering a favorable risk-to-reward setup.
Disclaimer: This analysis is for educational and informational purposes only and does not constitute financial advice. Trading cryptocurrencies involves significant risk, and you should conduct your own research and consider your risk tolerance before making any trading decisions.

From Record Highs to Fear: Bitcoin’s $113K Test!Bitcoin’s sharp decline below $113,000 has unsettled investors, coming just a few days after reaching new record highs. This drop was driven by a combination of global economic pressures, regulatory concerns, and weakening risk appetite. U.S. tariffs, investigations by the Securities and Exchange Commission (SEC), and disappointment in corporate artificial intelligence performance all weighed on market sentiment.
While fear dominates in the short term, the key question remains: does this mark the beginning of a deeper correction, or is it merely a temporary pullback within Bitcoin’s broader upward trend?
From a technical perspective, Bitcoin is trading in a general downtrend on the 4-hour chart, forming lower highs and lower lows, which confirms the bearish momentum. The rebound from the 113,656 and 112,551 levels is considered corrective, targeting the 116,069 level, which represents an important resistance area with selling pressure that could push the price lower again toward 113,608 in the medium term. The bearish scenario, however, would be invalidated if the price rises above 117,033 and a 4-hour candle closes above this level.

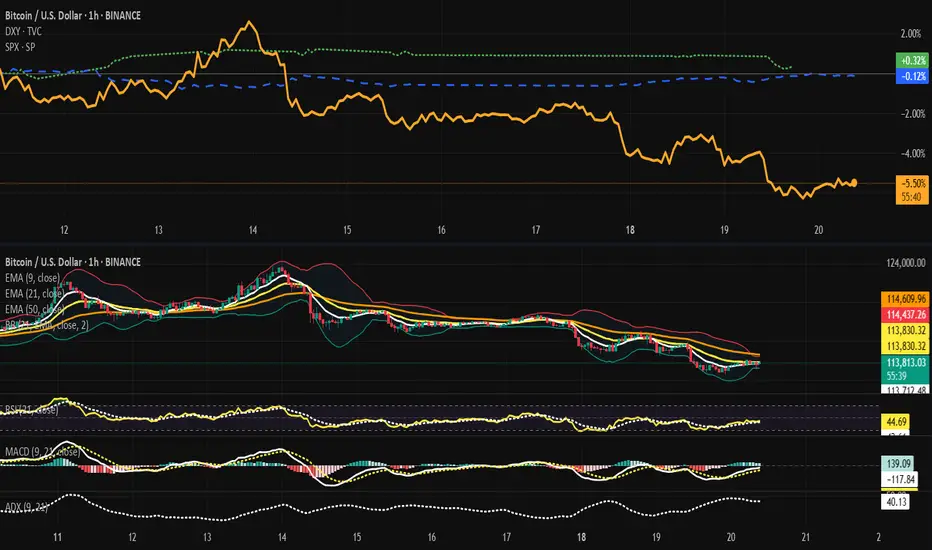
Bitcoin - Between DXY Stagnation and S&P Support.⊣
⟁ BTC/USD – BINANCE – (CHART: H1) – (Aug 20, 2025).
◇ Analysis Price: $113,658.22.
⊣
⨀ I. Temporal Axis – Strategic Interval – (H1):
✴️ The framework integrates (BTC/USD, DXY, and S&P500), synchronized on the daily scale, with the objective of capturing macro-structural correlations between dollar strength, global risk appetite, and internal Bitcoin flows.
▦ EMA9 – $113,686.19:
∴ Serves as the immediate momentum barometer, reflecting short-term order flow;
∴ Currently below both EMA21 and EMA50, indicating bearish micro-structure dominance;
∴ Acts as the first dynamic resistance for intraday mean reversion attempts.
✴️ Conclusion: Bitcoin remains capped under the short-term pulse barrier, restricting upside elasticity.
⊢
▦ EMA21 – $113,831.53:
∴ Functions as the transitional equilibrium line, bridging short and mid-term dynamics;
∴ Price is consistently trading below, validating sustained bearish pressure;
∴ Convergence of EMA9 attempting to retest EMA21 suggests an imminent decision point.
✴️ Conclusion: Mid-term equilibrium remains bearish-biased unless price closes above EMA21 with volume confirmation.
⊢
▦ EMA50 – $114,642.27:
∴ Serves as the macro structural wall, separating correction from reversal;
∴ With BTC positioned significantly below EMA50, broader trend control remains with sellers;
∴ EMA50 flattening indicates exhaustion of downward acceleration, yet no bullish transition.
✴️ Conclusion: EMA50 is the critical pivot-structure stays bearish until reclaimed.
⊢
▦ BB (21, 2, basis = EMA9) – Basis: $113,831.53 / Upper: $114,436.52 / Lower: $113,226.53:
∴ Bands compressing, signaling imminent volatility expansion;
∴ Price oscillating at the lower half, underscoring downside pressure;
∴ Lack of expansion suggests market is in “coiled spring” mode.
✴️ Conclusion: Volatility compression precedes directional breakout-likely aligned with macro catalyst.
⊢
▦ RSI (21, 9) – 43.09:
∴ Sub-neutral, below the 50 threshold, denoting lack of bullish momentum;
∴ Recent stabilization around 40–45 implies consolidation rather than capitulation;
∴ Divergence checks show no strong bullish divergence yet.
✴️ Conclusion: RSI reflects persistent weakness; structure requires break above 50 to regain bullish momentum.
⊢
▦ MACD (9, 21, 9) – Line: 146.49 / Signal: –145.34 / Histogram: –291.83:
∴ Negative histogram, confirming momentum pressure remains bearish;
∴ Early convergence between line and signal suggests weakening downside impulse;
∴ Momentum is not yet shifting-still transitional.
✴️ Conclusion: Bearish momentum intact but with signs of deceleration.
⊢
▦ ADX (9, 21) – 39.36:
∴ Near the 40 level, confirming presence of a strong active trend;
∴ Directional movement favors the sellers, with dominance still intact;
∴ Slight ADX easing signals weakening conviction but not invalidated.
✴️ Conclusion: Bears remain in structural control, though trend intensity may soon wane.
⊢
🜎 Strategic Insight – Technical Oracle:
∴ The triangular interplay of macro (DXY flat, S&P mildly positive), technicals (BTC below EMA50, with compression in BB), and on-chain (short-term inflow pressure, elevated Open Interest, slightly positive funding) outlines a fragile structure;
∴ BTC is bearish in short-term structure, trading under all three EMA thresholds;
∴ Macro backdrop offers no relief (DXY neutral, equities only mildly supportive);
∴ On-chain flows highlight imbalance: exchange inflows suggest sellers may pressure further, while long-term reserves confirm structural scarcity.
⚔️ Oracle’s Seal: Unless Bitcoin decisively reclaims EMA50 with volume, the probability favors continued downside probes toward ($111,500 / $112,000). A break of inflow dominance paired with Open Interest flush would be required to reverse this structural bias.
⊢
⨀ Macro Support & Resistance (BTC/USD – H1):
Immediate Support: $113,200 – aligned with Bollinger Band lower boundary;
Secondary Support: $111,500 – historical liquidity cluster;
Immediate Resistance: $114,450 – BB upper boundary and EMA50 confluence;
Macro Resistance: $116,000 / $118,000 – prior weekly rejection zone.
⊢
∫ II. On-Chain Intelligence - (Source: CryptoQuant):
▦ Exchange Inflow: Elevated activity clusters, signaling potential sell pressure;
▦ Exchange Outflow: Neutral-to-mild accumulation, not offsetting inflows;
▦ Funding Rate: (+0.007), indicating slight long bias persists, vulnerable to liquidation;
▦ Open Interest: ($40.8B), elevated, increasing risk of amplified moves via derivative liquidations;
▦ Exchange Reserve: (2.531M Bitcoin), structural downtrend, indicating long-term supply depletion.
⊢
🜎 Strategic Insight - On-Chain Oracle:
Despite long-term structural bullishness from falling reserves, short-term inflow spikes and elevated OI signal vulnerability to further corrections.
⊢
𓂀 Stoic-Structural Interpretation:
∴ The (BTC/USD) - ( hourly and daily structure remains in a compressed bearish phase ) - price is pinned beneath the EMA9, EMA21, and EMA50, all aligned downward, a trinity of resistance sealing momentum;
∴ Bollinger Bands reveal coiled volatility; pressure accumulates as if within a vessel of silence before rupture;
∴ RSI at 43 lingers in weakness; MACD histogram negative but converging - the storm slows but has not dispersed; ADX near 40 testifies the trend is still strong, though waning.
∴ On-Chain flows (CryptoQuant) whisper caution:
Inflows -> Outflows -> latent sell-pressure;
Funding slightly positive -> longs exposed to purge;
Open Interest elevated near $40B -> leverage imbalance;
Exchange Reserves declining -> long-term scarcity intact.
∴ Macro field - (DXY flat, S&P500) - provides no decisive impulse, leaving Bitcoin vulnerable to its internal flows.
✴️ Conclusion within the Arcanvm Technical Framework:
∴ Bitcoin stands at the threshold of choice: beneath structural EMA's, with inflow pressure tightening the noose, yet with reserves eroding in the background - a paradox of short-term fragility, long-term scarcity;
∴ The Oracle speaks: only a reclaim of EMA50 with volume and Open Interest flush can transmute this silence into bullish expansion. Otherwise, descent toward the ($111,500 / $112,000) support remains the path of least resistance.
⊢
✦ Structure:
∴ Trend Alignment: (BTC/USD) remains beneath EMA9, EMA21, and EMA50 - a stacked bearish configuration confirming short-term, mid-term, and structural momentum aligned to the downside;
∴ Volatility Compression: Bollinger Bands (21,2) contract, signaling that volatility is storing potential energy - the market is in coil phase, awaiting a trigger;
∴ Momentum Profile: RSI lingers at 43, sub-neutral, reflecting lack of bullish force; MACD histogram negative but converging, portraying bearish momentum in deceleration; ADX at 39 validates that the bearish trend is still dominant, though losing intensity;
∴ Macro Overlay: (DXY flat, S&P500) marginally positive - no decisive macro catalyst to override BTC’s structural weakness;
∴ On-Chain Dynamics: Exchange inflows slightly outweigh outflows, funding rate positive, and open interest elevated near $40B -> a leveraged market with fragile long positioning. Exchange reserves continue structural decline -> long-term scarcity intact.
✴️ Conclusion: The structure is locked in short-term bearish fragility, confined under EMA barriers, with inflow pressure and leveraged longs creating risk of liquidation cascades. Only a decisive reclaim of EMA50 can shift the framework; otherwise, the gravitational path points toward ($111,500 / $112,000) supports.
⊢
· Cryptorvm Dominvs · MAGISTER ARCANVM · Vox Primordialis ·
· Dominivm Cardo Gyratio Omnivm · Silence precedes the next force. Structure is sacred ·
⊢
Bitcoin will bounce up from wedge to 117K pointsHello traders, I want share with you my opinion about Bitcoin. The recent price action for Bitcoin has been complex, marked by a significant breakout from a prior downward channel that failed to produce a sustained trend, leading instead to the current corrective structure. This new market phase has taken the form of a large downward wedge, a pattern of contracting volatility that often resolves to the upside. The price has been making a series of lower highs and lower lows within this wedge, with the major buyer zone around the 113000 support level acting as a foundational floor. Currently, the price is in the final stages of this consolidation, making another descent towards the apex of the wedge. The primary working hypothesis is a long scenario, based on a potential 'fake breakdown' or liquidity grab below the established support. It is anticipated that the price may briefly dip below the 113000 support level to trap sellers before staging a sharp reversal. A swift reclaim of this level would be the ultimate confirmation of the bullish thesis, validating the wedge as an accumulation pattern and likely triggering a powerful breakout to the upside. Therefore, the TP for this reversal scenario is logically set at 117000 points. Please share this idea with your friends and click Boost 🚀
Disclaimer: As part of ThinkMarkets’ Influencer Program, I am sponsored to share and publish their charts in my analysis.

BTC/USD History Repeating Itself?Full disclosure, I'm not a huge fan of fractals, especially those resulting from black swan events over 4 years ago.
That being said, the BTC/USD weekly chart is starting to look worryingly similar to the 2021 top, as I'm sure many other analysts have also spotted.
The strong bearish RSI divergence is also cause for concern, as BTC heads down to retest its long-standing support level (white line).
Do I personally think history will repeat/rhyme this time? Mmm, I don't think so. Yes, we should anticipate further downside in the short-term. It is Summer after all. But with potential rate cuts due in September, war peace talks underway, and plenty of headroom left above in this cycle (according to the current MVRV score and Pi Cycle indicator), we could potentially see renewed optimism return end of September (NFA).
For the immediate term, a lot hangs in the balance of the upcoming Jackson Hole conference.

$BTC — I’ve entered a short position as the September rate cut CRYPTOCAP:BTC — I’ve entered a short position as the September rate cut looks more like a sell-the-news scenario than a bullish catalyst. I expect price to slide toward 110K first, with potential continuation down to 100K if sellers keep control. Market makers might still spike price into the 120K–125K zone before the dump, but overall structure suggests lower levels ahead.
🎯 BTC Downside Targets:
110K → 105K → 100K → 95K → 90K
BTCUSD 1H BULLS HAVE UNFINISHED BUSINESS :)Very strong area of SUPPORT/RESISTANCE @ around 115-116K. Bulls STRONG refuse to let this area go
With market now start to CREATE HIGHER LOWS (small time frame) give me good case for buying this dip
Hopefully we hit our target
