The Final Stop For Liquidity on BTC.CONTEXT 1:
Support Area- $108,000
Resistance Area- $120,000
Supply Zone- $123,300 to $124,000
Demand Zone- $108,500 to $109,700
Psychological Levels- $120,000 and $100,000
CONTEXT 2:
Technical Structure 1- We are currently clearing out liquidity arouond $103k. With bears losing momentum and the bulls beginning to step we have a an opportunity short at hand!
FVG’s:
One bearish Daily and Two bearish 4H FVG located above price. One 1W located just above price with a Daily and a 4H FVG inside.
GOLDEN POCKET:
Currently we are testing a bullish GP just below price with quite a bit of resistance from both bulls and bears.
VWAP and EMA:
On the Daily Timeframe the 9EMA and 20EMA have crossed bearish over the 50EMA. EMA 200 aligns with the lower anchored VWAP created in April that has been rejected once and looking for more price action.
CONTEXT 3:
Volume Insight- Volume profile still suggests lot of liquidity sits at psych level $120,000 waiting to be liquidated. This also aligns with the 0.618 level of the initial move down located around $119,000.
BULLISH SCENARIO 1:
We move down to sweep the $105k area while tapping into a Daily FVG below price and possibly clearing liquidity to $104k before bullish confluences push us into upper liquidity zones. The EMA 200 and the lower Anchored VWAP adds a bullish “brick wall” of confluence to help push price higher.
BEARISH SCENARIO 1:
After clearing liquidity below around $104k we begin the upwards move to clear liquidity sitting at $119,000. With added confluence of 4H FVG and the Golden 0.618 level of the inital move. The sweep of this area may also reach $120k psych level to push us into deeper liquidity zones sitting at $90k
BTCMINI trade ideas

BTCUSD BUY NOW 110650BTCUSD Long Setup
📈 Entry: 110700
🛡️ Stop Loss: 110400
🎯 Take Profit: 111600
Bullish momentum spotted near support zone. Targeting short-term breakout with tight risk control. Ideal for intraday scalpers and momentum traders.

BTC? continuation
Hi,
Letme indulge with bearish stories of BTC, and you can add on if you have any. But don't tell me a bullish notes... hahaha
i) Found a pin on my MT5 (2h) IF combination with a bearish bar (wow)
ii) Triangle broke down
III) Long firm- Bearish candle yesterday about 2000$ ++
iV) Channel break down
v) Inside bar breakdown( H4)
etc2
But what important for me of all the combo, is the price.
110,000.00000
break the above..again. I think you shall put downpayment for your helicopter. :)
Jokes and more jokes.
Don't be hardup. All the best.
Analyze at your own will, shoot at own will, loose your own and profit for the family.
All the best
Not a guru
This is important note

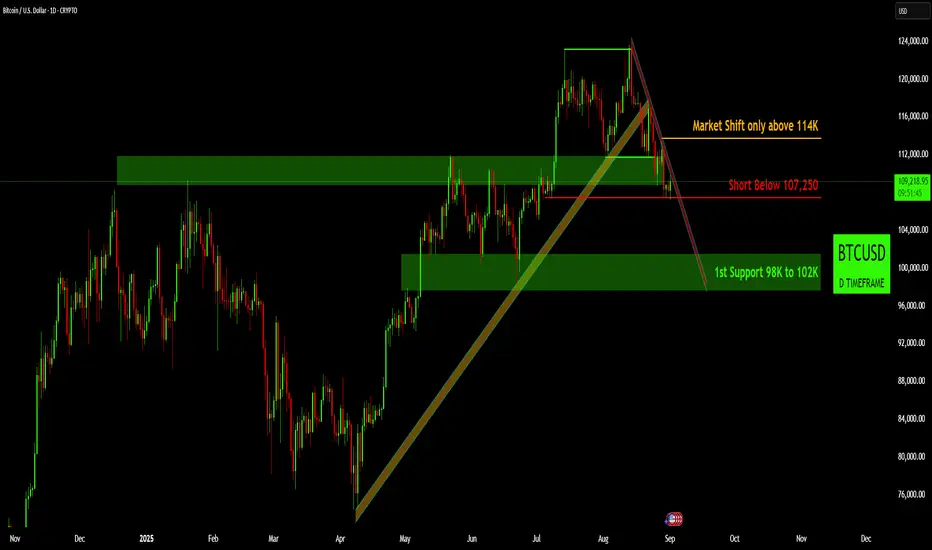
Bitcoin Daily Outlook: Navigating the Pullback & Key LevelsBitcoin Daily Outlook: Navigating the Pullback & Key Levels
Bearish Momentum: The long-term bullish trendline that started in April has been clearly broken, and Bitcoin is currently trading within a short-term downtrend channel, indicating a shift in immediate momentum.
Downside Confirmation: We're looking at a critical level around 107,250. If Bitcoin breaks and holds below this point, it would confirm further bearish momentum and suggest more downside.
Bullish Reversal: For a significant bullish market shift and to regain upward momentum, Bitcoin needs to decisively break and sustain above the 114,000 mark.
Key Support: Our immediate downside target and the first strong support zone to watch is between $98,000 and $102,000. This is where we might see buyers step in for a potential bounce.
Disclaimer:
The information provided in this chart is for educational and informational purposes only and should not be considered as investment advice. Trading and investing involve substantial risk and are not suitable for every investor. You should carefully consider your financial situation and consult with a financial advisor before making any investment decisions. The creator of this chart does not guarantee any specific outcome or profit and is not responsible for any losses incurred as a result of using this information. Past performance is not indicative of future results. Use this information at your own risk. This chart has been created for my own improvement in Trading and Investment Analysis. Please do your own analysis before any investments.
112k Bitcoin bullyBitcoin Price Stuck in Neutral – Levels to Watch Closely
Bitcoin price levels reactive right now. The Elliott Wave count isn’t giving me much confidence, and until we see a decisive move through key levels, I’m treating this as no-trade territory.
The level that stands out is 112k. This has been a major flip point for BTC, and it’s the bulls’ number to beat. A break with an impulsive push followed by a correction that holds above (or even right at it) would start to build a much more convincing bullish case. That would open the door for a potential long setup.
On the flip side, the current structure isn’t inspiring confidence. Price is showing lower lows and lower highs, a textbook downtrend, and every push is getting rejected off resistance. Until Bitcoin can reclaim levels it’s been losing, the bias leans bearish.
For now, it’s a waiting game. The market needs to pick a side, and until it does, sitting on the sidelines is the safest option.
Outlook:
112k break and correction = bullish setup
109k break and correction = bearish setup
Lower lows and lower highs = trend still bearish until proven otherwise

BTC? Shifting focus
Hi,
After AI failed me on Gold.
Shifting focus on sell on BTC
reason:
At retest level of Daily
My2c, focusing sell as long below 111750 levels
Level to break 111000
Lovely if could go 107500.
Anyways, all the best
Manage well, I don't do AI on sell side yet (xau)
Not a guru

BITCOIN CORRECTION 2025BTC is holding above 110K support after sharp rejection near 120K–115K, where heavy distribution took place (810K sold). Institutional absorption seems active around 110K, but a break below would expose 105K and 95K as deeper supports. Upside targets remain 115K and 120K if buyers regain momentum.
Target upside: 115K–120K
Target downside: 105K–95K
#BTCUSD #globaltrade #investment #investing #stockmarket #wealth #realestate #markets #economy #finance #money #forex #trading #price #business #currency #blockchain #crypto #cryptocurrency #airdrop #btc #ethereum #ico #altcoin #cryptonews #Bitcoin #ipo

BTC/USDShort term (daily): There is a chance of a rebound as the stochastic indicator shows a reversal from oversold.
Medium term: The trend is still likely to be sideways to bearish as long as the price cannot break above $115,000 - $120,000.
Strategy:
Aggressive traders can try buying on dips in the $108k - $110k support area with a target of $115k.
Conservative traders should wait for confirmation of a breakout above $120k for a safer long entry.

BTC BEARISH BTC SHORTED AT LONGER TF
Looked W TIME
Looked D TIME
Showing RESISTANCE
and now it is facing pullback to go upside
That's why I shorted BTC
Bitcoin is bullish now & many Traders don't see it !!!Well , so far, the price has broken the triangle and the pullback is being completed. From here on, if nothing unusual happens, we can be hopeful that Bitcoin will reach $150k.
previous analysis

BITCOIN The NIGHTMARE BEAR CYCLE fractal that Bulls must avoid!Bitcoin (BTCUSD) has been on a strong correction lately after the August 14 All Time High (ATH) at $124500. Every High since has been sold and the price has found itself below the 1D MA50 (blue trend-line).
Whether that's alarming or not yet, this sequence draws a lot of comparisons with the pattern that led to the Cycle Top on 2021.
As you can see both patterns started off with Lower Highs that pushed the market to a new bottom on Lower Lows. A 1D Death Cross confirmed the bottom formation (along with a 1D RSI bullish divergence on Higher Lows) and BTC started rising aggressively again, flipping both the 1D MA50 and 1D MA200 (orange trend-line) into Supports and forming a Bull Flag on a 1D Golden Cross.
At the end of this sequence in 2021, a Double Top Higher Highs pattern, was what formed the Cycle's Top. Unfortunately for the Bulls' case, this is very similar to the Higher High formation we got on August 14. Even the 1D RSI patterns among those two fractals are similar.
Do you think we are in a similar situation as in late November 2021, which initiated the 2022 Bear Cycle?
Feel free to let us know in the comments section below!
-------------------------------------------------------------------------------
** Please LIKE 👍, FOLLOW ✅, SHARE 🙌 and COMMENT ✍ if you enjoy this idea! Also share your ideas and charts in the comments section below! This is best way to keep it relevant, support us, keep the content here free and allow the idea to reach as many people as possible. **
-------------------------------------------------------------------------------
💸💸💸💸💸💸
👇 👇 👇 👇 👇 👇

BTCUSD NEXT MOVE (Expecting bearish move)(27-08-2025)Go through the analysis carefully, and do trade accordingly.
Anup 'BIAS for BTCUSD (2708-2025) (MIDTERM)
Current price- 112300
"if Price stay below 114000 then next target is 110300, 107000 and 104000 above that 115000.
-POSSIBILITY-1
Wait (as geopolitical situation are worsening )
-POSSIBILITY-2
Wait (as geopolitical situation are worsening)
Best of luck
Never risk 2% of principal to follow any position.
Support us by liking and sharing the post.

Potential Short Setup in 109,000 – 110,700 RegionPrice is approaching a key supply zone between 109,000 – 110,700, offering a potential opportunity for a short position.
🔻 Sell Region: 109,000 – 110,700
🎯 Targets:
TP1: 107,000
TP2: 105,000
TP3: 98,150
⚠️ Keep in mind the 100,000 level is a major psychological zone, so partial profits or tighter management around that area is recommended.
❌ Invalidation: A break and close above 111,243 will invalidate this short setup.
Bias: Bearish below 110,700 – expecting rejection and continuation lower.
💬 What do you think — will this supply hold, or are we heading for a breakout higher?
#Trading #PriceAction #SupplyAndDemand #ShortSetup #MarketAnalysis

BTCUSD Long: Breakout and Rally to 116500 levelHello, traders! The prior market structure for BTCUSD was a bullish ascending channel, which concluded with a pivot point high near the 118900 supply area. A subsequent breakdown from this channel shifted the market's momentum, initiating a corrective phase that took the form of a descending pennant. This bearish structure guided the price auction down to the major demand area around 112000, where a new pivot point low was established.
Currently, the price is consolidating within the final stages of this descending pennant, coiling between the supply and demand lines. The auction is approaching the apex of the pattern, but before a final resolution, one more test of the lower boundary is anticipated. The immediate expectation is for a final corrective move downwards to test the ascending demand line near the 112000 demand area.
The primary scenario anticipates a bullish resolution following this final test of support. The price is expected to reverse from the demand line, initiating a rally strong enough to break out above the descending supply line. Following the breakout, a brief retest of the broken line as new support would confirm the shift in control to buyers. This successful retest would then be the trigger for a continuation of the rally. The take-profit is therefore set at the 116500 level, targeting a key area of prior market imbalance. Manage your risk!

SHORT TRENDBtc was making LLs and LHs and incidentally broke most recent lower structure and pulled back up to fill liquidity previously created by previous lower high.
Expect price to go down to fill lower liquidity, meaning more sells looming.
Look at my chart

BTC headed to 105k ? semi-major Genesis Fib likely to be tested Shown here is a single fib series in three different time-frames.
The Genesis Sequence has called all of the major turns since 2015.
"Genesis" as in "at birth" which for BTC was into to USA via Coinbase.
$ 111,661.25 was a "minor ratio" that we just left
$ 105,451.85 is a "Semi-Major" so should be stronger.
$ 117,868.00 was a semi-major forming an "Orbital Top".
.
See "Related Publications" for previous BTC analysis ---->>>>>>>>>
Possible TOP of this Cycle:
Hit BOOST and FOLLOW for more such PRECISE and TIMELY charts.
========================================================
.

Btc BuyThere is a clear inverse head and shoulders (IH&S) with the best entry point for an aggressive trader being right now.
But if you are a conservative trader,you can enter at point 1.
The safe or obvious TP1 at 116861 and TP2 at 123331

Btc bottoming - See my short term bounce targetI have been anticipating a Btc local bottom as low as 108K since Aug 9th. It was a high probability call, because it's what Btc always does! Follow the patterns...
Now that my T2 has been hit, I anticpate a bounce into my high probability range as seen in the above chart. I will be monitoring price action very closely to see if either of the other 2 higher targets are possible before my anticipated reversal. I will be taking profit at the top of this bounce.
There is a possibility, based on the 3 week down rule, that the reversal (from my targets) may lead to a lower low to my T3 (below current low at 107.5K). This may happen as soon as late Sept- Oct. I hope I'm wrong about that.
May the trends be with you.

BTCUSD The Target Is UP! BUY!
My dear followers,
I analysed this chart on BTCUSD and concluded the following:
The market is trading on 10823 pivot level.
Bias - Bullish
Technical Indicators: Both Super Trend & Pivot HL indicate a highly probable Bullish continuation.
Target - 10996
Safe Stop Loss - 10727
About Used Indicators:
A super-trend indicator is plotted on either above or below the closing price to signal a buy or sell. The indicator changes color, based on whether or not you should be buying. If the super-trend indicator moves below the closing price, the indicator turns green, and it signals an entry point or points to buy.
Disclosure: I am part of Trade Nation's Influencer program and receive a monthly fee for using their TradingView charts in my analysis.
———————————
WISH YOU ALL LUCK

BTCUSD | Short Setup Towards Support. (Intraday)Analysis: Bitcoin (BTCUSD) is trading near 111000, and I am currently short from 111700, which aligns with a resistance zone.
🔎 Technical Reasoning
BTC is showing signs of weakness, moving lower day by day.
The market structure is forming Lower Highs and Higher Lows, suggesting bearish pressure.
My target is 106500, which aligns with a strong support zone.
From this support, BTC may potentially start a bullish run, but for now, the short setup remains valid.
📊 Trade Plan
🔴 Entry (Short): 111700
❌ Stop Loss: 113500 (above resistance)
🎯 Target: 106500 (support zone)
⚠️ This is my personal idea. Always manage risk with a proper stop loss.
💬 If this analysis helps, please like, comment and share to motivate me for posting more BTC updates.
Regards: Forex Insights Pro.
#BTCUSD #Bitcoin #Crypto #TechnicalAnalysis #PriceAction #SupportResistance #Bearish

$7,500 will most likely be tested someday. Its possible.Huge untested level at $7,500. I am a btc bear and I believe this trash will hit $7,500 someday. No one thinks it could happen. But it will.

Sine line methodHere im presenting you my personal "Sine line-method".
You go long or short at the peak of every sine line(bear market or bull market depending of course).
I also drew the log. trend curves to see potential bottoms/tops of the markets.
In ~3 years we will see the result.

BULLISH BTC !! IGNORE THE NOISE!Keeping it simple and ignoring the noise. I believe BTC is just retesting a common area since the spike in JULY. Very important time rn! HH will come!
