19/8 4H Breakout vs 1D Pressure – Key Levels to WatchOn 19/8, a valid 4H breakout has formed. However, the 1D chart has not shown any clear directional bias yet. For TP1, it is safer to follow the 1D conservative outlook, though aiming for a higher TP1 can also be considered.
On the 1D timeframe, the prevailing pressure remains bearish, so overall short bias is preferred.
For 20/9, the key considerations based on the 1D close of 19/8 are:
A. If the daily close is above 3344, a long setup can be considered.
B. If the daily close is below 3327, a short setup is favored.
C. If the daily close falls between 3344 and 3327, market remains range-bound, leaning bearish.
Reasonable sell entry zones: 3343 – 3349
Stop loss level: 3360
Short-term buy scalps may be taken within 3350 – 3327 range.
BTCMINI trade ideas


#Bitcoin Double Bearish Divergence!Using the ChartPrime Oscillator Pro, a double bearish divergence has formed on the weekly timeframe, which could play out between Sept. and Nov.
Medium term, the price could retest the $90K level, which aligns with a major support trendline.

BTC short idea, Pullback might be on its way. RR 1:9Price broke the latest daily uptrend and it is testing it back. Looks like there might be a chance of some pullback on its way. Might execute short position entry if this 4HR candle gives some reversal signal. Trade carefully and cheers !

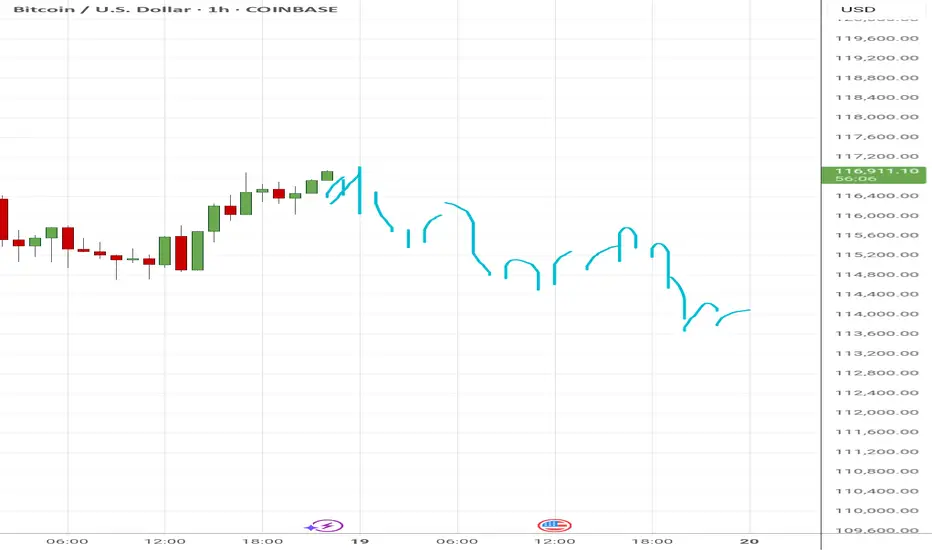
Feeling the charts, forecast for August 19, 2025.
I practice stock chart extrasensory, that is, feeling the energy of the future chart, this is a meditative technique, and the sensations are mainly tactile.
Forecast for August 19, 2025: I think there will be two strong downward impulses, around 6-7:00 UTC and 18-19:00 UTC, and perhaps the first two hours from 00:00 will also have a noticeable downward movement, and we will end the day lower than we started.
At the moment, I'm not analyzing the prices, I'm only paying attention to the price movement's impulses. I consider my forecast to be accurate if the outline of the actual chart matches the outline of the chart I've drawn as a forecast, indicating the correct direction and time period of the price movement.
BITCOIN CHOPPING BACK IN FORTH TRYING TO BREAKOUT?Hey Traders another week in the life of trading. This game can be rewarding and tough at times.
So back to the crypto world we have Bitcoin going nowhere at the moment. But Showing signs of Strength by Rejecting Support 3 times! This is why I always say you don't need to use indictators because price action (daily open and close) shows you everything!
Ok Im not an indicator hater 😂
But just saying why complicate things if you don't have too.
Alright enough Monday afternoon humor where are we?
Market Bears rejected reistance twice at 123,362 but bulls rejected them 3 times with todays close at that 115,674 level. Seems to me like this level is becoming a line in the sand.
Will it breakout or test the highs? or Will it completely Crash and selloff below 112,000?
Ahh yes the million dollar question well unfortunately no one has a crystal ball so therefore we are just taking educated bets and guesses. That is why we call it Speculation for those who are new to trading! 😁
Ok Finally Scenario time
Bullish- consider buying today after the close with a stop below support at around 110,050. Watch for the resistance level to get tested at 123,362 or higher if breaks above.
Bearish- wait for market to break below 112,000 because I think too risky to short here without market proving it wants to go lower first then if you get the break below support sell the rally.
COT- it still shows the funds are short selling but last week they just closed off a good amount of short positions. Sometimes we get a flip from short to long if that is happening the market could catipult fast to the upside when those stops are forced by the short sellers getting a short squeeze. Meaning they are forced to buy to stop losing because the stops are getting hit!
Good Luck & Always use Risk Management!
(Just in we are wrong in our analysis most experts recommend never to risk more than 2% of your account equity on any given trade.)
Hope This Helps Your Trading 😃
Clifford
RISK DISCLOSURE
TRADING IN THE FUTURES AND FOREX MARKET INVOLVES SIGNIFICANT RISK. ALWAYS CONSULT A FINANCIAL ADVISOR AS HIGH RISK ASSET CLASSES MAY NOT BE SUITABLE FOR ALL INVESTORS. THIS IS NOT A RECOMMENDATION TO BUY OR SELL ANY ASSETS. ALL IDEAS ARE MADE FOR EDUCATIONAL PURPOSES. PAST PERFORMANCE DOES NOT GUARANTEE FUTURE RESULTS.
CFTC RULE 4.41 – HYPOTHETICAL OR SIMULATED PERFORMANCE RESULTS HAVE CERTAIN LIMITATIONS. UNLIKE AN ACTUAL PERFORMANCE RECORD, SIMULATED RESULTS DO NOT REPRESENT ACTUAL TRADING.

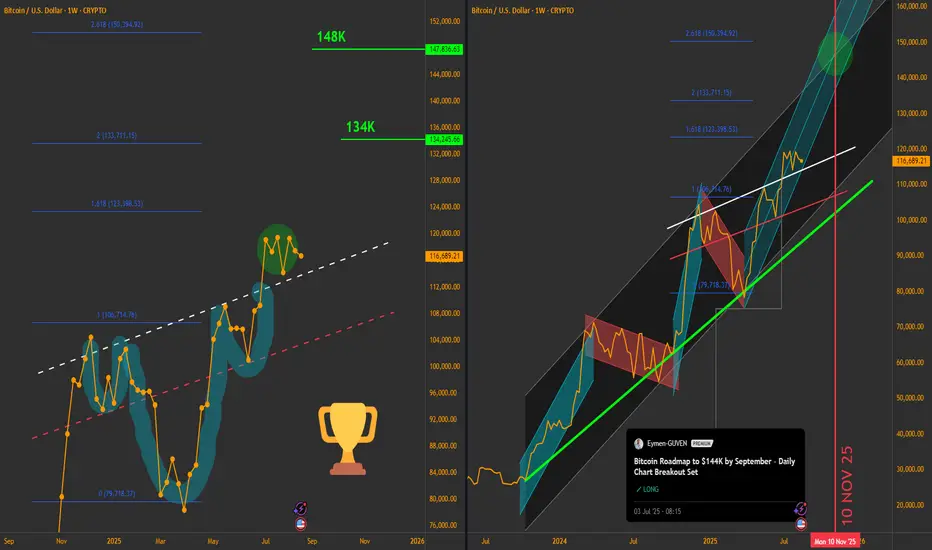
Bitcoin Roadmap Update: Cup & Handle Targeting $148K
Hello traders, today I am reposting my analysis for Bitcoin on the weekly timeframe with updates.
Right Window – Previous Roadmap
The right chart shows my earlier analysis “Bitcoin Roadmap to $144K by September – Daily Chart Breakout Set”. In that setup, the main uptrend channel (black) from October 2023 and sub-channels (red and cyan) were mapped.
Although I mistakenly closed the trade after the first target was achieved, I still believe the uptrend from mid-March 2024 is ongoing. I have extended my projection to mid-November 2025, with a target of $148K.
Left Window – Current Structure
On the left chart, we see a new bullish pattern developing. This can be interpreted as either a cup & two handles or an inverse head & shoulders.
Price has already closed above the neckline (white line).
A successful retest of the neckline adds confidence to the breakout.
Fibonacci extension levels project:
200% ≈ $134K
260% ≈ $148K
As long as Bitcoin trades above $100K, I believe the next phases are toward $134K and then $148K.
Proposed Position Setup
Entry zone: Current price area (~$116K)
Stop-loss: ~$95K (conservative placement below $100K)
Target: $148K
Alternate stop for aggressive traders: Weekly close below $105K (red shoulders-support line)
This setup balances both faster and longer-term trading styles.
Risk-to-Reward Evaluation
Potential Profit: ~$32K (from $116K to $148K)
Potential Loss: ~$21K (from $116K to $95K)
Risk-to-Reward Ratio: ~1.5 : 1
This is acceptable for a weekly swing trade, especially given the uptrend confirmation and multi-pattern confluence.
Key Takeaways & Timeline
Trend bias: Bullish
Main support: $100K (conservative stop-loss below this)
Main targets: $134K and $148K
Expected timeline: Mid-November 2025
Invalidation: Weekly close below $100K (or $105K for aggressive traders)
I remain bullish on Bitcoin as long as price respects the green uptrend line (Oct 2023) and holds above $100K. Volatility is expected, but structure remains intact.
Trade safe and size positions according to personal risk tolerance.

BTC/USD – 15M | Liquidity at Equal Highs & FVG TestPrice is climbing back into the FVG zone while equal highs remain untouched above. Liquidity is building and a decisive move is expected.
📈 Bullish Scenario
Push through FVG
Sweep Equal Highs / Swing High
Continuation toward 117,904 – 118,409 zones
📉 Bearish Scenario
Reject from FVG
Breakdown toward 116,250 swing low
Liquidity draw to 115,000 – 114,700 equal lows
Deeper target near 113,750 strong low
Key Levels
Equal Highs / Swing High: 117,904
P1D Low: 116,993
Swing Low: 116,250
Equal Lows: 114,700
Strong Low: 113,750
💬 Will BTC sweep highs first or head straight for liquidity below?

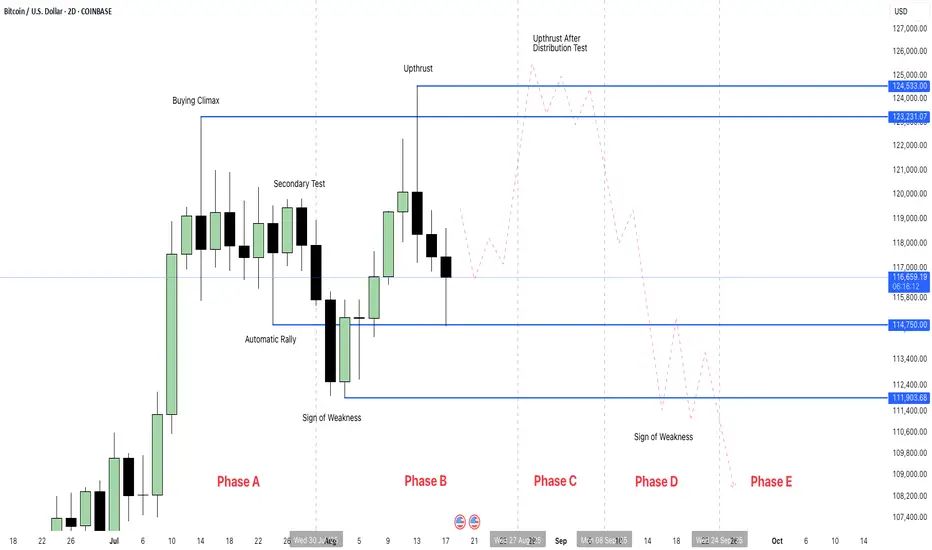
BTC Bitcoin in Distribution Phase BLOW-OFF TOPI believe Bitcoin BTC is in Wyckoff Distribution Phase B heading for Upthrust After Distribution (New ATH) Sweeping $124,500 price.
For me, that would be the BLOW-OFF TOP and the end of this cycles.
For this scenario to play out, after taking liquidity above the current ATH, it needs to start reversing and dropping.
If it closes above the current ATH, then this idea would be invalidated.
There are other factors which would confirm this idea but I am not gonna share it publicly.
Good luck and Happy Trading...
15Min | Long Entry | SMC-Trade Asalam.o.alaikum,
Sorry for late entry. The trend according to the 15min TF is shifted into the Bullish. We can entry for some pips now..
Cheers,
Thanks!
IntikhabGillaniACCA
Ultra Securities & Hedge Funds (PvT) Limited,
Mianwali, Pakistan.

BTC 4Mill Hype TrainBTC -> 40x;
Following the log trend lines to 1 million then peak 4 million if we don't drop out of this channel and go to $65k

Check the trend The downtrend is expected to continue to the specified support level. Then, within the specified timeframe, there is a possibility of a trend reversal.

Bitcoin’s Make or Break Moment – Eyes on $116,500📉📈 Bitcoin’s Make or Break Moment – Eyes on $116,500 🧠⚡
Hey Traders! Quick BTC update following the full market breakdown I just posted.
👉 Watch the full update here: S&P 500 on the Edge – Crypto Awaits the Signal 🔥
🎯 Let’s zoom in on Bitcoin:
- Price is consolidating right at the MAJOR/BIGGEST level
- The previous ascending channel has now become a key area of interest
- Reclaim $116,500 → opens the path to a bullish continuation
- Dip below $115,000 → exposes a move toward $110,000
We're in a ⚖️ 50/50 zone — but now with added structure.
🟦 I've marked $116,171 as a reaction level before the breakout test at $116,525
🟥 The downside becomes very real under $115,000
I like being bullish — but I'm not going to FOMO in.
The chart is demanding my attention right now.
💬 Where I Stand in the Market:
✅ I prefer Bitcoin over stocks — especially as the S&P 500 sits at all-time highs under pressure (post)
✅ Ethereum remains stronger than BTC at this stage — better structure, stronger trend
❌ I do not prefer altcoins over BTC right now — many remain under resistance and lack leadership
S&P 500 still holds the macro key. Until we get clarity there, all crypto positions require careful planning. But inside this space, I’m going ETH > BTC > Alts for now.
🔑 Final Note:
This setup is forming in real time. If BTC breaks above $116,500 , I’m ready to turn bullish again.
Below that? I stay cautious, composed, and prepared.
One Love,
The FXPROFESSOR 💙
Disclosure: I am happy to be part of the Trade Nation's Influencer program and receive a monthly fee for using their TradingView charts in my analysis. Awesome broker, where the trader really comes first! 🌟🤝📈

BTC Crashing To 110kAfter taking out ATH last week, BTC broke structure to the downside on the 8h with a quick retest of the FVG. Price is now trending towards the next major support level at 111,930. If price breaks this level, we could see a retest and accumulation of new buy orders at 110k level.
Do you see price breaking below 110k?
#btc #short #analysis #smartmoney
