Bitcoin Maxis - Brace for Impact !!!🚨 Bitcoin Maxis, brace for Impact 🚨
There is clear, recent evidence that Tether is actively diversifying its reserves and investments by both selling some of its Bitcoin holdings and significantly increasing its exposure to gold, including direct investments in gold mining:
1. Selling Bitcoin and Buying Gold
Tether has reported substantial profits from both Bitcoin and gold price appreciation. In 2024, the company booked. How does Tether generate its profits beyond Bitcoin and gold investments?" with \5 billion coming from unrealized appreciation of its gold and Bitcoin holdings. However, recent reports indicate Tether has been increasing its gold reserves while adjusting its Bitcoin treasury. For example, Tether disclosed holding $8.7 billion in gold bars in its Q2 2025 attestation report, and its gold-backed stablecoin (XAU₮) is backed by over 7.7 tons of physical gold as of April 2025.
2. Entering Gold Mining
Tether is in active discussions to invest in gold mining, aiming to channel its crypto profits into the metals market. CEO Paolo Ardoino has publicly referred to gold as “natural Bitcoin” and expressed a strong affinity for gold as a foundational asset. The company is exploring opportunities across the entire gold supply chain, including mining, refining, and trading.
Tether has already invested over $200 million in Elemental Altus Royalties, a Canadian firm that buys future revenue streams from gold mines, giving Tether exposure to multiple mines with less operational risk.
3. Strategic Shift
Tether’s move into gold and gold mining is part of a broader diversification strategy, which also includes investments in AI, Bitcoin mining, and other sectors. The company’s leadership has repeatedly emphasized gold’s role as a hedge and a complement to Bitcoin.
In summary, Tether is not only selling some Bitcoin and buying gold but is also directly entering the gold mining sector as part of its diversification and profit deployment strategy.
Sources:
www.zerohedge.com
www.coindesk.com
www.fxleaders.com
bitcoinethereumnews.com
BITSTAMP:BTCUSD NASDAQ:TSLA NASDAQ:NVDA NASDAQ:MSTR TVC:DXY TVC:GOLD TVC:SILVER VANTAGE:SP500 FX:EURUSD COINBASE:USDTUSD AMEX:NUGT AMEX:GDX
BTCMINI trade ideas

BTCUSD Trade SetupBitcoin is showing some interesting price action here 👀
After the recent push up, price got rejected and is now retracing. I’m watching the 109k – 108k support zone for potential buys. If bulls defend this level, we could see another leg up toward 112k+.
But if price fails to hold above 108k, then deeper downside could open up before bulls step back in.
For now, my bias is to wait for price to test demand before looking for long opportunities.
Patience = profits ✅

BITCOIN The key importance of the 1W MA20 that was just tested!Bitcoin (BTCUSD) almost hit early this week its 1W MA20 (blue trend-line) and so far it appears to be holding it. Whether that leads into a sustainable rebound or not it remains to be seen but this is historically a critical level for the market.
More specifically, as you can see on the charts above, the 1W MA50 has initiated every Cycle's final rally since 2013! To make this special occurrence even more interesting, every such consolidation/ pull-back before the final rally, took place within the August - September period (2021, 2017, 2013).
So if it holds once again, we see no reason why it shouldn't start again the Cycle's last rebound. And since the first two Cycles are more similar with each other, we might assume that the current would be more similar with 2017. Since that one topped very close to the 2.0 Fibonacci extension from the low of the final pull-back, we could get a peak this time around $140k.
Do you think history will repeat itself again and hit at least $140000? Feel free to let us know in the comments section below!
-------------------------------------------------------------------------------
** Please LIKE 👍, FOLLOW ✅, SHARE 🙌 and COMMENT ✍ if you enjoy this idea! Also share your ideas and charts in the comments section below! This is best way to keep it relevant, support us, keep the content here free and allow the idea to reach as many people as possible. **
-------------------------------------------------------------------------------
💸💸💸💸💸💸
👇 👇 👇 👇 👇 👇

BTC's Situation, A Comprehensive Analysis !!!As you can see, after breaking the bearish wedge, the price dropped sharply. The question is, how far will this price decline continue? In my opinion, the price could remain bearish until the PRZ (Potential Reversal Zone), which is around the 107500 level. After that, an increase in buying pressure could lead to a price rise to higher levels.

timeline of GeniusThe Greatest Financial Minds Who Shaped the Trading Industry
In trading, we often obsess over charts, entries, and exits, forgetting that the very foundation of our craft was built by great thinkers who saw beyond their time. These financial minds left behind legacies that continue to guide us every time we analyze a chart, hedge a risk, or speculate on a macro event. Let’s revisit some of these giants and unpack how they shaped the industry we trade in today.
1. Charles Dow – The Father of Technical Analysis
Charles Dow wasn’t just a journalist; he was the architect of modern charting. By co-founding the Dow Jones & Company and creating the Dow Jones Industrial Average, he gave traders the first roadmap for analyzing price trends. His Dow Theory established concepts like market phases, primary vs. secondary trends, and the importance of volume. Without Dow, many of the indicators we use today would never exist.
Impact: Every trader who draws a trendline, identifies a trend, or follows market cycles is echoing Dow’s work.
Nerd Note: Dow didn’t just invent an index, he invented the idea of reading psychology through price.
2. Jesse Livermore – The Legendary Speculator
Known as the "Boy Plunger," Jesse Livermore became one of the most famous traders of the early 20th century. He made (and lost) fortunes multiple times, most notably shorting the 1929 crash. His trading principles, cutting losses quickly, pyramiding into winners, and following the tape remain timeless.
Impact: Livermore’s lessons on discipline and emotional control still serve as the blueprint for risk management today.
Nerd Note: His trading diary might be 100 years old, but it still sounds like conversations on @TradingView today.
3. John Maynard Keynes – The Economist Who Traded
Keynes wasn’t just an economist who reshaped government policy; he was also an active trader. He pioneered the idea that markets are not always rational famously saying, “The market can stay irrational longer than you can stay solvent.” His insights on market psychology and long-term investment influenced both central banks and portfolio managers.
Impact: Keynes helped bridge economics and market behavior, reminding traders to respect liquidity and irrationality.
Nerd Note: Keynes wasn’t just about theories, he pioneered diversification and professional portfolio management.
4. Paul Tudor Jones – The Modern Macro Trader
Paul Tudor Jones became legendary for predicting and profiting from the 1987 crash. His trading style blends technical analysis with global macro themes, proving that successful trading is both art and science. He also emphasized risk management, famously never risking more than a small percentage of capital on one trade.
Impact: His approach paved the way for today’s macro hedge funds and continues to inspire traders balancing fundamentals with charts.
Nerd Note: PTJ is proof that charts + macro = a lethal combo.
5. Richard Dennis – The Turtle Trader Experiment
Richard Dennis believed that trading could be taught. To prove it, he trained a group of novices later called the Turtle Traders and turned them into millionaires using a simple trend-following system. This experiment became proof that discipline and systemization can outperform emotion and intuition.
Impact: Dennis democratized trading, showing that rules-based strategies could be replicated and mastered.
Nerd Note: If you think rules-based trading is “too mechanical,” Dennis showed why systems often outperform emotions.
6. George Soros – The Man Who Broke the Bank of England
Soros etched his name in history by shorting the British pound in 1992, making over $1 billion in a single trade. But his real genius was in reflexivity theory the idea that market participants’ biases can influence fundamentals, creating feedback loops.
Impact: Soros expanded how we think about market psychology and global macro risk-taking.
Nerd Note: Soros reminds us that market psychology isn’t just noise it’s a driver.
7. Edward Thorp – The Quant Pioneer
A math professor turned investor, Edward Thorp applied probability theory to both blackjack and the stock market. His book Beat the Dealer revolutionized casinos, while Beat the Market introduced quantitative trading strategies. He was one of the first to use options pricing models profitably before Black-Scholes became mainstream.
Impact: Thorp laid the foundation for quantitative trading and hedge funds, influencing everything from algorithmic trading to derivatives pricing.
Nerd Note: Thorp’s legacy is alive every time an algo executes a trade in milliseconds.
Outro
The trading industry wasn’t built overnight it stands on the shoulders of visionaries who combined intellect, courage, and sometimes sheer audacity. Whether you’re drawing lines on a chart, running a trading bot, or hedging a portfolio, you’re applying principles these financial minds helped craft.
As traders, we don’t just inherit their ideas we adapt them, test them, and carry them forward into the markets of tomorrow.
Nerd’s final Take: Trading is not just about screens and signals; it’s a living history. Every trade you take is part science, part psychology, and part homage to the legends who paved the way.
Which of these financial giants do you think shaped trading the most and who should we as traders study harder today?
put together by : Pako Phutietsile as @currencynerd

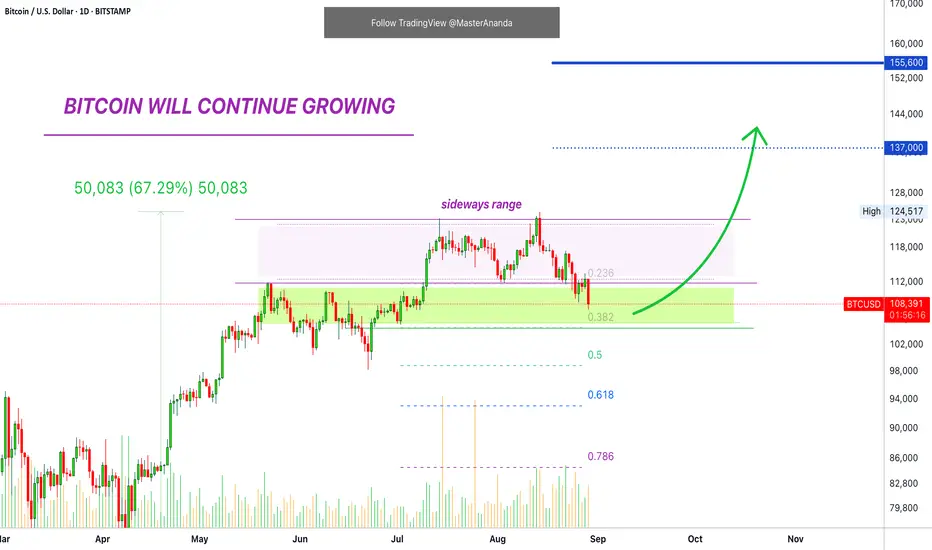
Bitcoin · Futures Trading Trade-NumbersI want your opinion. Too early?
Normally a retrace would pierce half-way through the previous consolidation range before reversing. Bitcoin hit a low today of $107,488. The lowest since 8-July.
I don't see much bearish momentum but the retrace is a perfect decline. Two weeks prices moving lower. Bitcoin is now trading within a strong support zone. The price range that launched the all-time high.
We have some mixed signals. Bitcoin is mixed as usual, in some ways, while everything else is crystal clear. And so we conclude that Bitcoin is doing what everything else in the crypto market is also doing. Consolidating, building up strength, before moving higher.
Yes it is true Bitcoin is moving lower. Not kidding. But this is a minor decline, truly. Months ranging and lower but the price is down only a few ks and the trading continues to happen safely above 100K.
We will see additional growth.
I see some altcoins-projects growing so strong... Bitcoin is already fairly priced.
I just wanted to share with you some numbers...
________
LONG BTCUSDT
ENTRY: $107,600 - $110,000 (STOP: $105,000)
TARGETS: $122,500, $137,000, $155,600
________
Thanks a lot for your continued support.
Namaste.
BTCUSD--LONG--looking monthly chart, and reaction at monthly support, it seems bullish reversal is occuring
--details are as given on chart

BTCUSD – Is the Big Wave Coming?Hello everyone, what do you think about BITSTAMP:BTCUSD ?
BTCUSD is now standing at a critical crossroads. After a short-term correction, price has continued to build a new support zone around $107,000. This is an area where buyers have consistently defended, showing that underlying demand remains strong.
In the past, after each strong rally, we saw a period of accumulation followed by another breakout. Every dip has been quickly absorbed, while volume has been increasing on each bounce – a clear signal that smart money is quietly accumulating.
On the news front, expectations of an upcoming Fed rate cut, combined with rising safe-haven demand amid economic and geopolitical uncertainty, are creating a powerful catalyst for BTC. This narrative positions Bitcoin not just as a risky asset, but as “digital gold” in the eyes of many institutional investors.
I expect this accumulation phase to end soon, with the Bulls regaining control.
What about you? What’s your view on BTCUSD? Share your thoughts in the comments!

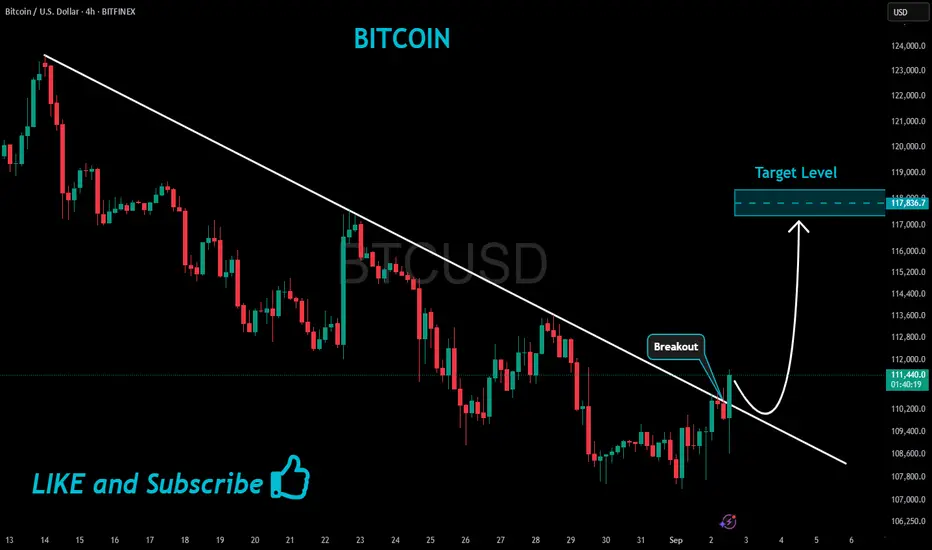
BITCOIN Bullish Breakout!
HI,Traders !
#BITCOIN made a bullish
Breakout of the falling resistance
And the breakout is confirmed
So we are bullish biased
And we will be expecting
A further bullish move up !
Comment and subscribe to help us grow !
BTC 3-Drive Pullback. 113.5KMorning folks,
BTC for now is moving accurately from one our target to another. First it was 108.4K, now it is 108K. Next should be 104-105K...
Still, price stands at strong support area and is forming bullish reversal session on daily chart. On 1H chart we have clear 3-Drive Buy pattern. So, chances are above zero that before it keep going down, the pullback happens...
That's why if you want to go short we call you to wait for the bounce and try to sell the rally instead. The minimum 3-Drive target is above 113K top, where we have also K-resistance area. So, just watch for it, if you want to sell.
Also we have no objections against long entry with 3-Drive. Although it doesn't correspond to overall context and we do not include this trade in our plan. But, now this trade has a small risk and could be considered, if you want.
I sign this update with "Long" idea, but only for pullback. Context remains bearish.

BTC Triangle Squeeze: Next Stop $116K?Bitcoin is currently consolidating inside a symmetrical triangle, a classic squeeze that often precedes a strong breakout 💥. Price is building pressure with higher lows and lower highs, waiting for confirmation.
✅ Bullish Confluences:
Price is respecting triangle support and holding the structure.
Fibonacci retracement shows potential upside continuation.
Momentum is shifting after a prolonged corrective move.
🎯 Fibonacci Upside Targets:
🌟38.2% – $112,876
🌟61.8% – $114,195
🌟100% – $116,329
⚠️ Invalidation / Stop-Loss Zone:
If price breaks below $107,000 – $105,000, the bullish setup is invalidated ❌.
As long as BTC stays inside the triangle and above key support, the squeeze favors a bullish breakout

Counter-Pattern BTC Idea. Sell @ 113.5KMorning folks,
So, our plan stands in progress, everything is fine, while market is moving with 3-Drive pattern to the upside. It's time to decide what to do next.
BTC will remain under pressure until the mid September, due to big Treasury borrowings. At the same time we see that it is forming reverse H&S pattern, which is potentially bullish. Our idea is to go against it with the most safe way and Sell at the neckline and K-resistance area of 113.5K level.
Because we think that this H&S has more chances to fail rather than to work properly. But, anyway, if even it will work as it should, the right arm deep should let us to move stops to breakeven. So, we think that this trade scenario cares not much risk

Bitcoin – H4 Mid-Term OutlookBitcoin – H4 Mid-Term Outlook
Good day Traders,
Bitcoin remains in a broad sideways range. Although the recent NFP release generated strong trading volume, the market has yet to confirm a dominant direction. For now, price continues to rotate within the 107k – 113k area.
Elliott Wave View
There are signs that Wave 5 has likely completed, while an A–B corrective phase is developing. Within this structure, the market could still deliver one more upward move before clarity emerges.
Trendline & Critical Levels
A descending trendline is capping upside momentum, offering potential early short entries. Still, a decisive break below 107k would be needed to confirm a mid-term bearish structure.
Alternatively, if price retests the trendline and rebounds, a wave C rally could unfold.
It is also worth noting that BTC remains above its rising channel, signalling that sellers have yet to take full control.
Possible Scenarios
Bullish Scenario:
Holding above 107k and breaking through 113k would open the way towards 115k – 118k. Long setups should ideally be backed by stronger volume or a confirming MACD signal.
Bearish Scenario:
A failure to defend 107k could accelerate selling pressure, dragging price back towards 104k – 101k, where key support lies.
Professional Insight
The market currently lacks clear direction in the mid-term. Monitoring price action at 107k and along the descending trendline will be critical for defining the next move. Until then, flexibility and strict risk management remain vital for traders navigating this environment.

Moving Stops - The Illusion of ControlA trader frames an idea:
BTC Daily Uptrend
Looking for reasons to frame a low risk idea for a long, wanting to get into uptrend resumption
Drops down to the 4hr
Notices buyers coming back … or at the minimum the sellers pause
Enters with a tight stop for a healthy return to risk ratio
Stop set. Risk defined. Plan in place.
Price goes against
Trader shifts the stop down
What is going on here?
It’s all too easy to do.
Many of us have been here before.
Stop in place. Target set. Everything mapped.
Then the market nudges against you …
You might tell yourself “this is just ‘noise’”.
You convince yourself that ‘they’ are just going to pick you off.
and suddenly you’re “adjusting.”
Move the stop just a little.
Pull the target closer.
Bend the rules you swore you’d follow.
And it feels ‘right’ in the moment. Like you’re managing risk.
But what’s happening here is that
You are attempting to control your own discomfort.
And in so doing - you enter the slippery slide of losing self control.
It’s subtle but it starts like this.
If the trade works out - you might feel justified in having moved your stop and therein starts a pattern of rule breaking.
If the trade does not work out - you might beat yourself up and undermine confidence in yourself and your process
🧠 A simple thing that might help guard against this:
Before the trade, write down the one level you will respect.
Write it in a journal.
Annotate it on the chart.
Use the TradingView long position / short position tool.
Even saying it out loud locks it in.
That tiny ritual makes it much harder to justify shifting things mid-trade.
The market will do what it does.
The only thing you truly control is whether you keep your word to yourself.
Commit to the stop when you commit to the trade
Live to trade another day.

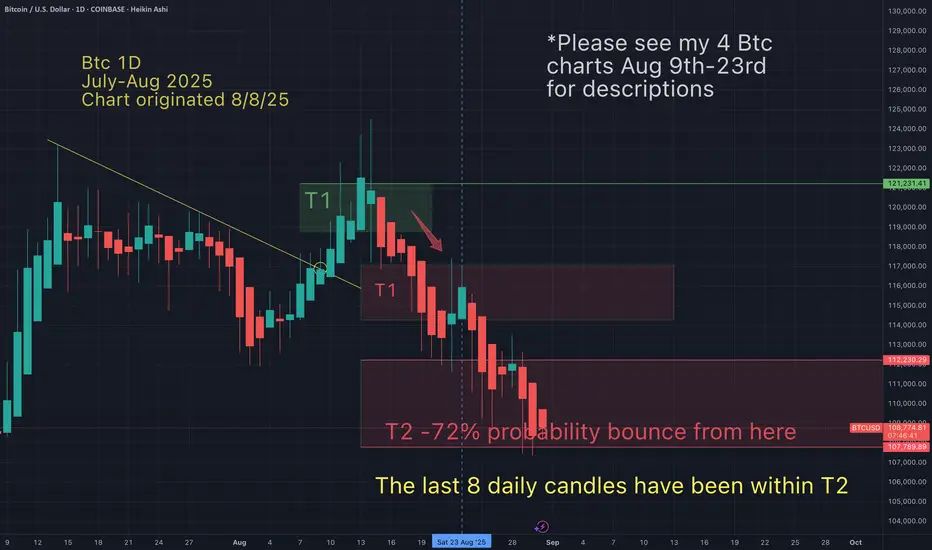
Btc price action unfolds exactly as anticipated-Bounce incoming?On Aug 9th I suggested the following:
As of today Btc has been bottoming at my T2 after following the anticipated price action suggested in the above chart. TA works!
May the trends be with you.
BTCBitcoin may rise toward the 12,300 level before facing potential downside pressure. Traders should watch price action closely for confirmation of this scenario.

Bitcoin Analysis: Bitcoin Will Continue to RallyBitcoin began rebounding after confirming support near 107,200 on August 29th and 30th. After several days of volatile gains, it has now stabilized above 110,000. Resistance at 113,500, the highest point on August 28th, saw further declines yesterday. Short-term double top pressure exists, but as long as it stabilizes at 110,000, bullish momentum persists. Looking at the 4-hour chart, the current upward trend remains intact. In terms of short-term trends, I personally believe Bitcoin will continue to rebound, at least breaking through 113,500. Of course, this level is unlikely due to the relatively quiet weekend trading. A breakout is possible next week. Let's wait and see.
Bitcoin Strategy
For Bitcoin: Previously, below 110,000, there were consistent signals for opening long positions to ambush bullish sentiment. Any price below this level presents a good opportunity to open long positions. The market has rebounded to the resistance level, but I think it will continue to rebound after a slight correction. If the price pulls back to 110500, 110000, or 109500, you can consider opening a long position. The target is 112700.

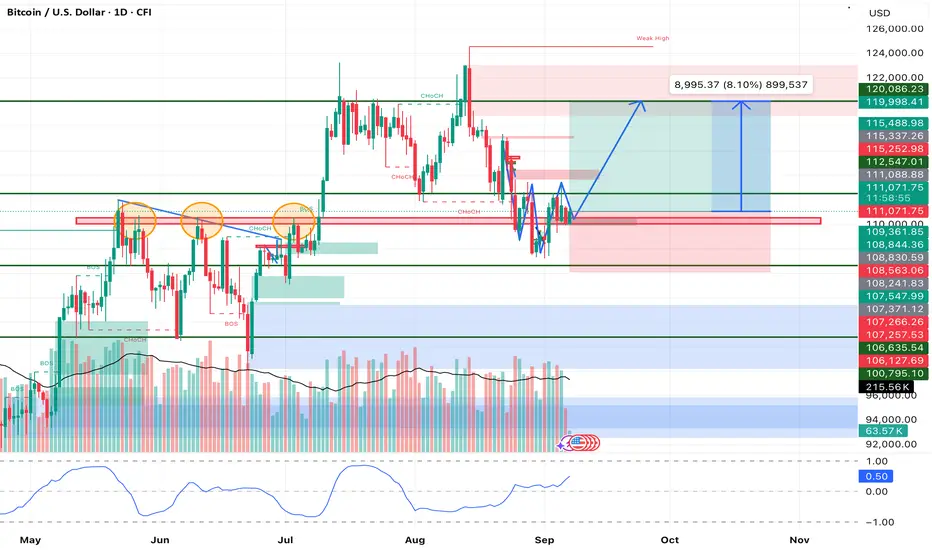
BTC/USD Long Setup – Defending $111K Support for a Push Upward⚡ Bitcoin bulls are stepping back in at a critical level!
After a sharp correction, BTC has successfully defended the $111K–$112K demand zone 🛡️, which has acted as a strong liquidity pocket in recent weeks. This reaction could be the base for a renewed bullish push targeting the liquidity resting above $120K 🎯.
Here’s the breakdown of my analysis 👇
📌 Market Structure
• Price swept liquidity below $111K before bouncing, creating a higher-low formation 🔑.
• Structure remains bullish as long as the $111K level holds.
• A clean break above $115.5K–$116K resistance ⚔️ will confirm continuation.
📌 Volume Profile
• Increasing buy volume 📊 indicates demand absorption after the correction.
• Smart money positioning suggests accumulation in this range.
📌 Key Levels
• Entry Zone: $111K–$112.5K 🟢
• Stop Loss: $106.6K ❌ (below the invalidation level)
• Target: $120,086 🎯 (8.1% upside move toward the weak high)
📌 Risk Management
• Risk/Reward ratio sits at ~1:1.8 ⚖️, balancing protection and upside potential.
• This setup invalidates ⛔ if BTC closes decisively below $111K support.
⸻
✅ Trade Idea Summary
• Bias: Long BTC/USD
• Setup: Higher-low confirmation at demand zone
• Target: $120K 🎯
• Stop: $106.6K ❌
• R/R: ~1:1.8 ⚖️
Conclusion:
Bitcoin’s rejection of $111K support shows that buyers are still in control 🐂. As long as this level is defended, the path of least resistance points upward 🚀. I expect BTC to test the $115.5K–$116K resistance, and if broken, momentum could carry price toward $120K+ liquidity.
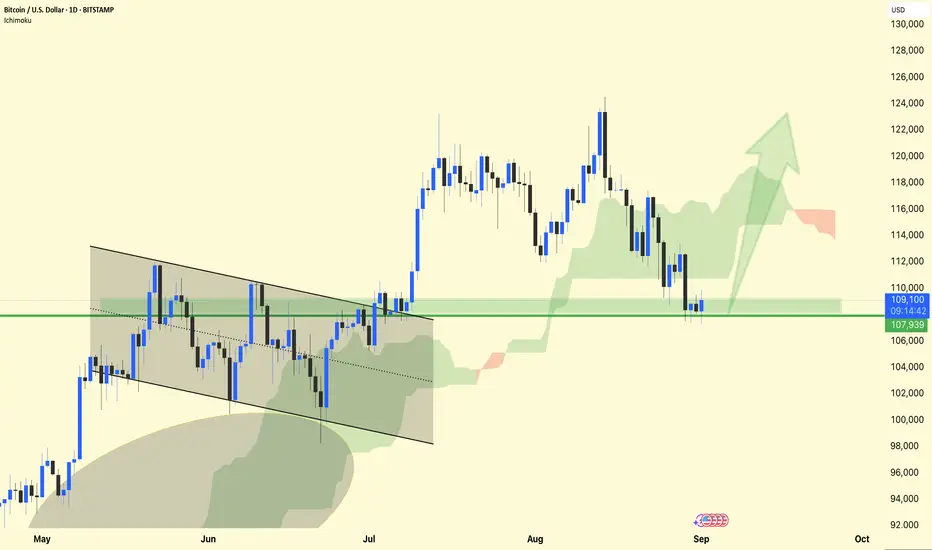
BTC/USDT – 1D Chart Analysis !! BTC/USDT – 1D Chart Analysis
BTC is holding above the $108K support zone (green box). This area has acted as a demand zone, preventing deeper downside.
Structure: After the breakdown from the wedge pattern earlier, the price is consolidating near support with lower wicks showing buyer defense.
Ichimoku Cloud: Price is still inside the cloud zone, suggesting a neutral-to-bullish outlook. A strong daily close above $110K–112K could flip momentum upward.
Next Targets:
Bullish breakout → Move toward $116K – $120K zone (green arrow projection).
If support fails → Risk of retest around $104K – $102K.
⚡ Sentiment: Market is at a make-or-break level — holding $108K could spark a strong rebound; losing it could trigger further correction.
DYOR | NFA
TP 138200 Locked Now buying around 106200 area This declined was extremely disappointing for altcoins because its shows weakness in altcoins Now as bitcoin will explode 💥 upside buying limit around 106200 area towards new ATH my 1st TP 138200 tgen story goes on and towards final destination 260500 end of the year to complete it finally wave count

BTCUSDBTCUSD is about to get ready for an upside, wait for a setup before you jump in.
Disclosure: We are part of Trade Nation's Influencer program and receive a monthly fee for using their TradingView charts in our analysis.

September 3 Bitcoin Bybit chart analysisHello
It's a Bitcoin Guide.
If you "follow"
You can receive real-time movement paths and comment notifications on major sections.
If my analysis was helpful,
Please click the booster button at the bottom.
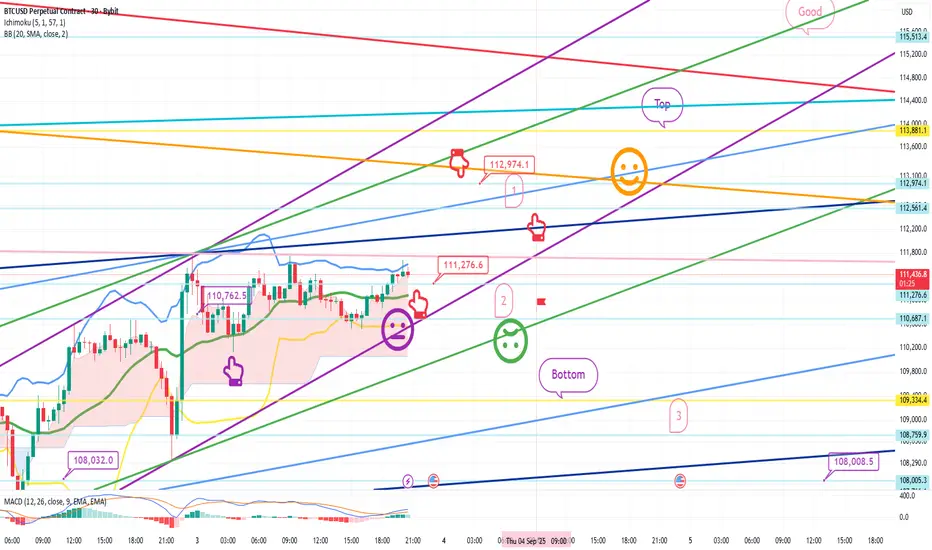
This is a Bitcoin 30-minute chart.
The Nasdaq indicators will be released at 11:00 AM.
At the bottom left is the long position entry point from the 1st, $108.032.
Above that is the purple finger at $110,762.5.
I've linked the strategy to the long position re-entry point.
*If the red finger follows the path,
it's a one-way long position strategy.
1. Long position entry point at $111,276.6 / Stop loss if the green support line is broken.
If the price falls sharply from the current level,
it's a long position waiting point up to section 2.
If the price touches or breaks the green support line,
it breaks the short-term pattern, which is not a good strategy for long positions.
2. Long position at $112,974.1, first target -> top section, second target
When it reaches 112.9K, the first section is the upper section for re-entry into a long position.
The uptrend line is the green support line -> the deep blue support line.
From the second section, it could fall to the bottom -> the third section -> 108K.
From the deep blue support line,
a medium- to long-term correction and sideways trading may follow, so please keep this in mind.
As long as the Nasdaq doesn't crash today, that's fine.
Please use my analysis as a reference only.
I hope you operate safely, with a strict trading strategy and stop-loss orders.
Thank you.
CAUTION: BITCOIN'S CORRECTION JOURNEY TO $96,050Bitcoin has hit a resistance wall with a double top on the weekly as well as the monthly timeframe. What's even more concerning for bulls is the RSI divergences on these time frames. Volume has been drying up as price was hitting new all time highs while momentum was also declining. Now the smoke has now lit up into a flame and the big correction is in progress.
I am expecting an A-B-C correction to an initial target of $96,050 where bulls will step up buying pressure to go up to make either a higher high or a lower high on the weekly chart. Stay tuned for further update.
Cheers fellow traders!
