BITCOIN BEARISH TRANDLINE WITH DOUBLE BOTTOM - READ CAPTIONHi trade's
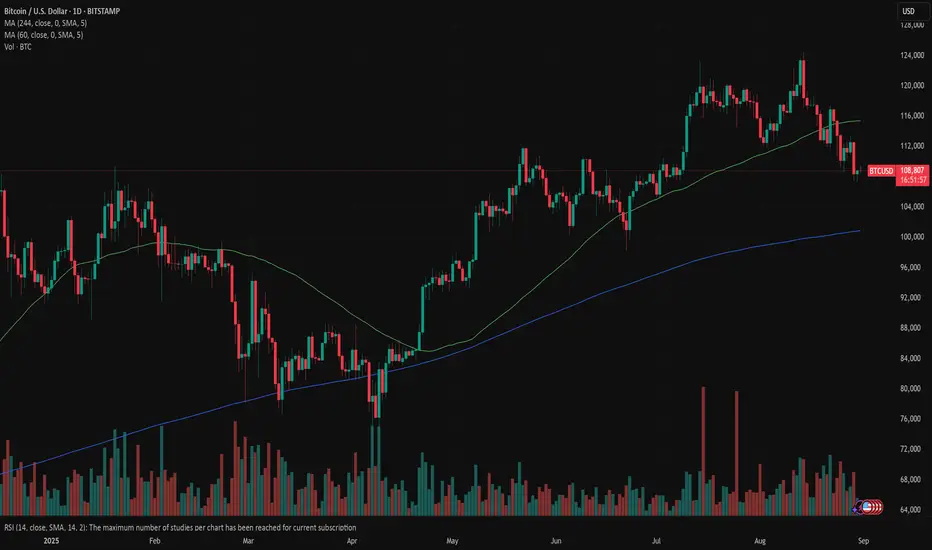
Bitcoin is currently trading under a bearish trendline and attempting to form a possible double bottom near support.
Price is showing multiple rejections from lower support areas, indicating short-term buyers are defending this zone.
If the market retraces upward, the first resistance to watch is 110000.
A breakout above this resistance may open the way toward the supply zone
support zone 108200-107300
resistance zone 110000
supply zone 113000
👉 If you find this idea useful, follow for more daily updates 🔔
💬 What do you think about this setup – will Bitcoin hold support or break lower?
BTCMINI trade ideas

Bitcoin Swing Trade Setup – Institutional Inflows Fuel Bulls🎭 BTC/USD – Money Heist Plan 🚀 (Swing + Scalping Strategy)
📊 BTC/USD Real-Time Market Data
Current Price: $111,156.01
24h Change: +$2,117.61 (+1.94%)
Day’s Range: $108,540.93 – $111,180.45
52-Week Range: $49,538.00 – $123,640.00
😰 Fear & Greed Index
Score: 49/100 → Neutral 😊
Trend: Shifted from “Fear” to “Neutral” in the last 24 hours.
🧠 Investor Sentiment Outlook
Retail Traders: Cautious (63% worry about crypto safety).
Institutional Traders: Bullish (💵 $3.7B net inflows in August).
🌍 Fundamental & Macro Score
Policy Uncertainty: High (U.S. tariffs, Fed policy shifts).
Fed Rate Cut Probability: High (expected September cut).
Key Event: Non-Farm Payrolls (Sept 5; forecast 45K jobs).
Gold Rally: $3,508/oz (+30% YTD, strong hedging demand).
🐂 Market Outlook
Short-Term: Neutral → Slightly Bearish (September volatility ahead).
Long-Term: Bullish (Institutional inflows + macro liquidity).
Bull/Bear Score: 55% Bullish vs 45% Bearish.
🎯 Thief’s Trading Plan (Layered Entry Strategy)
I’m setting up multiple limit orders (“Thief Layers”) instead of going all-in — this spreads risk, builds better entries, and keeps flexibility.
Entry (Layered Buys):
$109,000 → $109,500 → $110,000 → $110,500
(Add more layers as per your own strategy)
Stop Loss (Thief SL):
$107,500 (Adjust for your own risk appetite)
Target Zone (Profit Extraction):
$116,000 (Checkpoint before major resistance zone)
💡 Key Takeaways
BTC rebounded +1.94% but faces headwinds from whale profit-taking & policy risks.
Neutral sentiment (49/100) reflects a balanced investor mood.
Friday’s NFP jobs data could shape Fed rate expectations → big volatility catalyst.
🔍 Related Pairs to Watch
BITSTAMP:ETHUSD | COINBASE:SOLUSD | BITSTAMP:XRPUSD | BINANCE:BTCUSDT | CRYPTOCAP:BTC.D
#BTCUSD #Bitcoin #CryptoTrading #SwingTrade #Scalping #TradingStrategy #LayeredEntries #CryptoCommunity
✨ “If you find value in my analysis, a 👍 and 🚀 boost is much appreciated — it helps me share more setups with the community!”

BTC Ready to Fly Above 110k If h2 close above 110k it will fly towards 114k then towards 117k very fast ‼️ Don't miss the move 😉


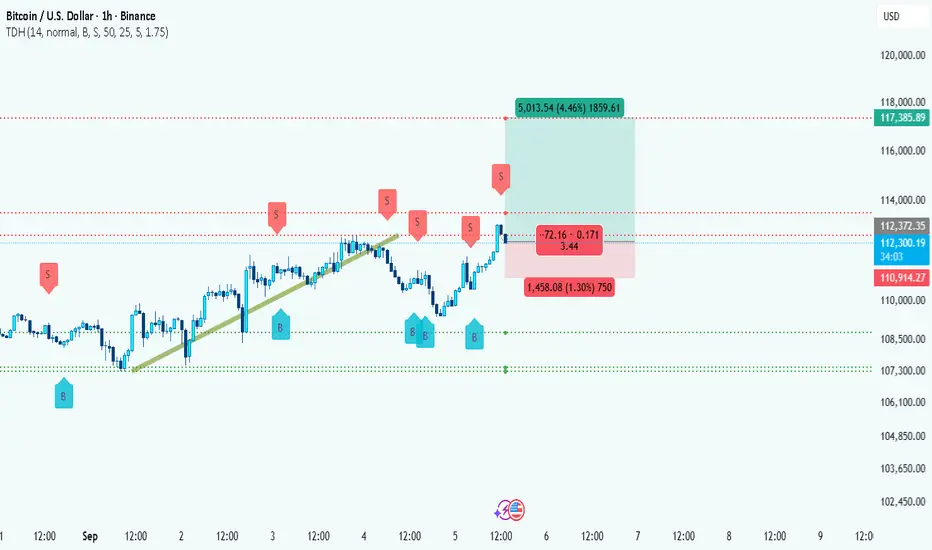
Bitcoin Breakout: $112.4K → $117.4K Target in PlayMarket context & structure
BTC has shown a steady climb into the current area: the market printed a sequence of higher lows through the first days of September and just produced a strong impulse leg into the 112k zone. That move carried price above a short-term trendline and absorbed nearby selling interest, which is bullish structure on the 1-hour timeframe. The recent pullback is shallow and looks like a classic retest of breakout area rather than a failure — buyers keep stepping in around the 107–109k region historically, which supports further upside attempts.
Technical reasons to be bullish (justification)
• Higher lows / higher highs pattern on the 1H — the structure favors continuation while this remains intact.
• Break & retest behavior: price cleared the minor resistance area near 110–112k and is holding above that band after the retest. That suggests a higher-probability long opportunity rather than a fresh breakout-fail.
• Clear targets and measured move: the chart’s long setup projects an upside objective near ~117,385, which aligns with a visible supply cluster and a logical liquidity magnet above current price.
• Healthy R:R on the plan: the trade on the chart shows a relatively small stop compared with the upside objective, producing a favorable reward-to-risk.
Key chart levels (visible on your image)
• Entry area: ~112,350 – 112,400 (current price zone).
• Stop (chart): 110,914 (invalidation below recent control).
• Primary target (T1 / chart): 117,385 (main upside objective / supply cluster).
• Lower support band to watch: ~107,300 – 108,800 (previous demand area; if price returns here buyers typically reappear).
________________________________________
Trade setup (clear, bullet format)
• Entry: Long around 112,350 – 112,400.
• Stop-loss: 110,914 (≈1,445 points below entry; ~1.3% risk).
• Take Profit (T1): 117,385 (~5,026 points above entry; ~4.5% upside).
• Risk : Reward: ≈ 3.5 : 1 (T1 vs SL).
________________________________________
Trade management & partial-profit rules
• Partial profit booking (recommended): take 30–40% off the position once the trade is ~+2% to +2.5% in profit (roughly 114,500 – 115,000 on this setup). Locking a portion early secures gains and reduces emotional pressure.
• After partials: move the stop on the remaining position to breakeven (entry) once the partial is taken — this converts the remaining position into a free trade.
• Trailing: for the rest, trail the stop under each 1H higher low as price advances (or use a volatility-based trail, e.g., 1.5× ATR(14,1H)). This captures extended upside while protecting profits.
• Second take profit: scale out another 30–40% near the charted target 117,385; leave a small runner if you want exposure to an extended move above that level.
• If price falls to SL: accept the loss and re-evaluate structure — a clean hourly close below 110,914 invalidates the bullish plan.
Risk and event notes
• Keep position sizing so the trade risk stays within your rule (commonly 1–2% of account).
• Be cautious around macro windows (FOMC, US data, high-impact crypto news) — these can cause slippage and sharp volatility on the 1H. Consider reducing size or tighter management near scheduled events.
• Watch for false breakouts: if price stalls and fails to hold the breakout band for several hourly closes, avoid scaling in further.
________________________________________
Short summary
The 1H structure favors a bullish continuation as long as price holds above the breakout/control band and 110,914. The charted plan offers a high R:R (~3.5:1) to ~117,385. Use staged profit-taking (30–40% at ~+2% — ~114.5k), move stop to breakeven, and trail the remainder under 1H higher lows to maximize capture while protecting gains.
Would you like those same levels formatted as a one-line social caption and a short post-ready blurb you can drop under the chart?
BITCOIN SHORT FROM RESISTANCE|
✅BITCOIN is retesting a key resistance level of 113k$
So I think that the pair will make a pullback
And go down to retest the demand level below at 111k$
SHORT🔥
✅Like and subscribe to never miss a new idea!✅

BITCOIN HIGH PROBABILITY SETUP SOON!!!🚨 BITCOIN HIGH PROBABILITY BUY SETUP 🚨
* Here We Can See The Next Potential Move For BTC Coming Hours/Days.
* Keep Your Eyes Close On Your Trading Positions.
* Happy PIP Hunting Traders.
FXKILLA.
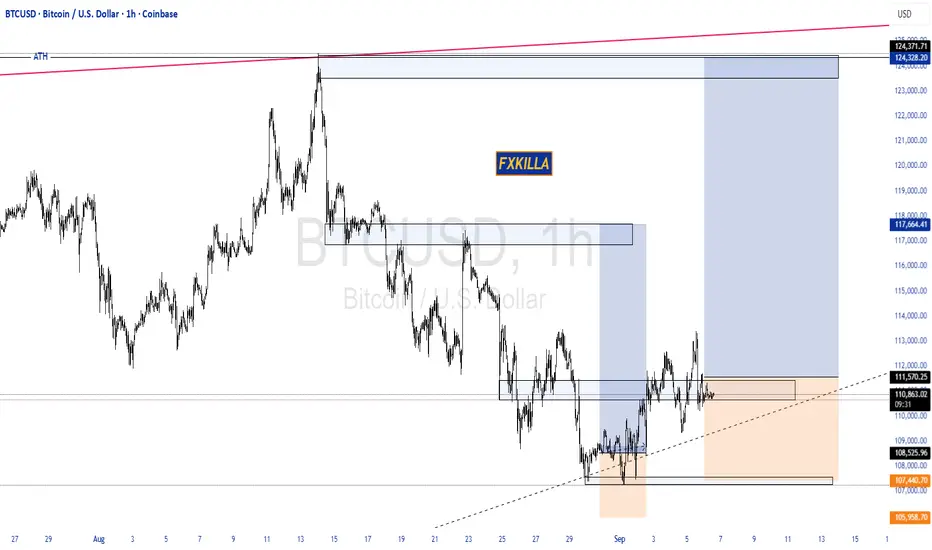
BTC 4H – resistance Breakout or Deeper Correction?🔹 Upside Scenarios
The first major liquidity lies at the Previous Weekly High. A breakout above this level opens the path toward the resistance zone $117K.
If momentum extends further, the key target remains the Previous Monthly High at $124.5K
🔹 Downside Scenarios
strong supports are found at $104.7K and then $98K.
Losing either of these zones could trigger a deeper correction.
This is not financial advice. Trade according to your own plan and risk management.

Long BTC based on 4h Chart
Inverted Head and Shoulder formation after a 2 week decline
TP based on the classic HnS TP
Price around strong'ish support area

Bitcoin – Technical Scenario for the New WeekBitcoin – Technical Scenario for the New Week
Hello traders,
BTC continues to move in line with expectations. On the chart, price has held firm after breaking below the rising channel, and the medium-term bearish structure on the H4 timeframe remains well intact.
In the longer term, confirmation of deeper downside will require breaks of major support levels on higher timeframes. For now, however, the outlook remains unchanged from my previous analysis:
Short zone: still valid around 111k
Long zone: still valid around 105k
At the start of the week, BTC may continue consolidating for another one or two sessions to build liquidity before committing to its next move.
This is my current technical perspective on BTC for the week ahead. Trade with discipline, and feel free to share your outlook in the comments.

BITCOIN (BTCUSD) SHORTI really hate to say this… but I was looking at the charts and noticed something important.
According to Gann timing, we just hit 144 weeks on August 26th, marking a major cycle.
🔹 144 weeks from the November 2022 low
🔹 To the mid-August 2025 high
Gann considered 144 (12x12) a key square of time – often signaling major turning points.
Cycle watchers… keep your eyes open. 👀

BTC dumps to 50k ! !All my previous predictions were approved(as you can see on the chart).
Now we are in the beginning of C-wave correction. According to my prediction we will see the end of correction on the Fibonacci 1.68 level, which equal to price about 50k per BTC.

Beautiful head and shoulders on BTCOn the daily time frame BTC is respecting a clean support and with rate cuts bound to happen in a couple weeks I think we can see buyers step in throughout the next upcoming days.
Ima be taking buys but hey what do I know??

warningTrading volume has dropped significantly and this is the end of the line, and when Bitcoin crashes, everyone crashes together. Watch your capital. good luck

BTCUSD 4h short-term📊 Trend and structure
• You can see the price output from the downward channel (orange trend lines). This is a signal of a potential change of trend.
• The price currently oscillates around USD 112,200, i.e. above several key supports (109,000 - 111,000).
• The nearest strong resistance is around 113,450 - 114,955 USD (marked with green lines and average SMA).
⸻
📈 indicators
• MacD: MacD (blue) line pierces above the signal (orange) and the histogram grows in the plus → it is a growth signal.
• RSI: ~ 60, i.e. it grows, but is not yet entering the purchase zone (> 70). There is still room for increases.
• SMA:
• Price has pierced short -term medium (red and green lines, ~ 109–112k), which works as support.
• The next key test is SMA around $ 114,955 - a puncture could open the road to 116–118k.
⸻
🔑 key levels
• Support:
• 111.014
• 109.023
• 107.580
• resistance:
• 113,450
• 114,955
• 116,000+
⸻
📝 Summary
• short -term (4h) - signals are upward: breaking from the downward channel, positive MacD, RSI is growing healthy.
• Bull scenario: Breaking above 114,955 opens the way to 116–118k.
• Bear scenario: unsuccessful puncture 113,450/115K → possible retest support at 111K and 109k.

BTC: Short term: price falls but to increase strongly again.BTC: NEXT BUYING OPPORTUNITY.
assess the possibility of BTC falling to 100 or even 94k, waiting for buying opportunity for the pattern below.

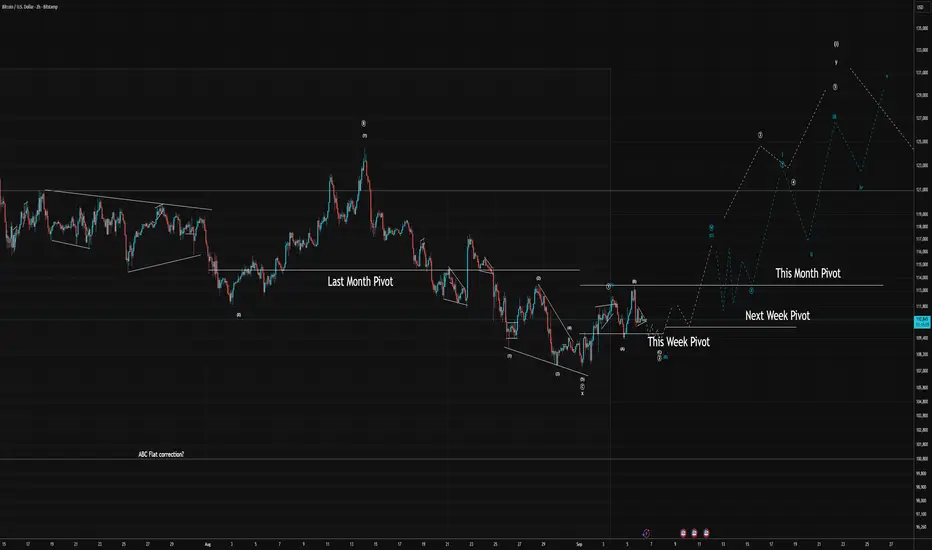
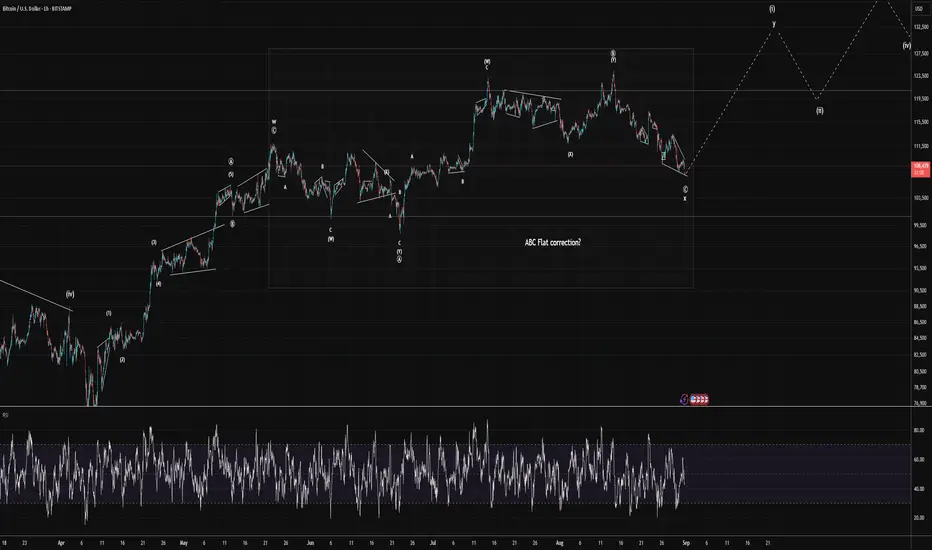
BTC: A Challenging Month Is Almost OverIt's been a tough month for Bitcoin. Today, we'll likely see a final move down to complete the diagonal of the ABC flat pattern, after which the major upward trend should resume.
Due to this ABC flat correction, I've extended my projection for the uptrend's longevity. It is now likely to continue into early next year—though not without some sharp corrections along the way.
The S&P 500 is showing a similar direction, indicating a broader market alignment.
Bitcoin: a corrective pullbackBitcoin slid to around $108K during the previous week, as a mix of various events affected the value of the coin. It was a mix of technical sell signals, whale-driven liquidations, and ETF outflows, as well as liquidations through margin calls due to a dip in value. The decline marked a broader pullback across crypto markets, even despite sustained institutional interest in the sector. As per news reports, a high-profile investor (often referred to as a “whale”) reportedly offloaded a large amount of BTC, around 24,000 coins, which triggered widespread forced liquidations and sparked a sharp short-term drop in prices.
The lowest level of the coin was at Friday's trading session, at the level of $107,7K. Saturday's trading session brought some buyers of the coin, so BTC ended the week at $109K. The RSI reached the level of 38, while the clear oversold market side has not been reached. The MA50 is slowly starting to converge toward MA200, but the distance between lines is showing that the potential cross is still not on the horizon.
At this moment on charts, the crucial question is whether BTC finished its latest correction, which started after its new ATH was reached in mid-August. From the current point, charts are showing potential for a $105K support line. It would mark the highest level from January this year. On the opposite side, the latest strong push toward the downside, indicates a potential for a short price correction toward the upside. Currently, BTC is traded at $109K, with a potential for $111K to be tested.
Bearish Momentum for Bitcoin!Looking at the Daily Time-frame, we can see that the market structure has been broken. The high formed in the 14th of July, where liquidity was resting, was taken out and immediately price began its down-ward spiral! Within a period of 9 days, the low formed on the 2nd of August was taken out, qualifying that level as a breaker, but a more decisive move took place on the 25th.
Thus we can see, by the unwillingness of price to go above the breaker level, that the market is bearish! Right now, I am waiting for price to reach the 111,855 level to see how price will react.
All the best with your trading.

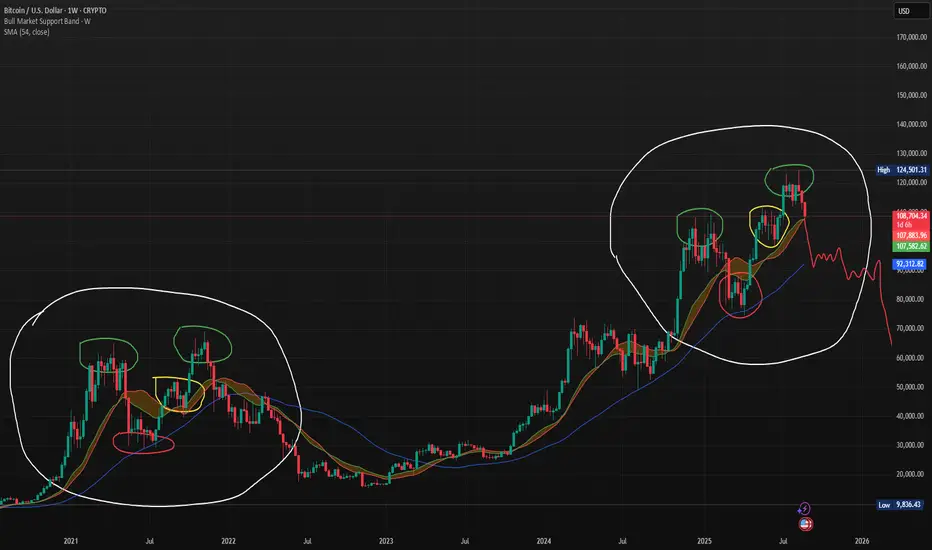
Bitcoin Weekly Chart – Is the 4 Year Cycle Over?This chart compares Bitcoin’s current weekly price action to its 2021 market structure. Both periods show striking similarities: double-top patterns (green circles), mid-cycle consolidations (yellow highlights), and support retests (red circles) within the bull market support band. The projection in red outlines a potential bearish scenario, where BTC could follow a similar path to the last cycle—breaking below support and entering a prolonged corrective phase. Traders should watch the $92K SMA and bull market support band closely as critical levels for trend confirmation.
BTCUSD Technical Outlook – August 31, 2025Bitcoin is currently trading around $109,000 after losing its recent bullish momentum.
Key highlights from the chart:
Price broke below the minor trendline, confirming short-term weakness.
Current structure shows a bearish correction, with potential downside towards the next demand zone around $98K – $100K.
If this level fails to hold, a deeper retracement into the $92K – $94K zone could be on the table.
On the bigger picture, the major trendline is still intact, meaning long-term bullish structure remains valid unless price breaks below $88K.
This setup suggests that while the market is in a correction phase, the long-term trend could still resume upward after this pullback.
Are you expecting BTC to bounce from 100K, or could this correction go deeper?


BTC: Mapping Key Reversal Levels for the Next WeekIt looks like we completed the diagonal (wave pattern) last week. Now, in theory, we should be moving upwards. We're currently in a pullback. Friday saw some bad US unemployment news, which triggered a sell-off across the entire market.
Some altcoins look particularly weak. And while Bitcoin corrects over the weekend, alts could dump much harder.
We're conducting our analysis using key reversal levels, in addition to wave counting—which is, of course, subjective and open to interpretation.
Approximate targets are on the chart. I'm not considering a bearish scenario for now, but of course, anything is possible.