BTCMINI trade ideas


btc buy setupBitcoin (BTCUSD) – Long Trade Setup
Currently, Bitcoin is trading around 108530, where I see a potential short-term bullish opportunity. The market has shown signs of upward momentum, and I expect the price to extend higher toward the 108700 level.
Entry Price: 108530
Target (TP): 108700
Bias: Bullish (Long)
This trade is based on the idea of capturing a quick upward move within the current trend. Although the upside potential is limited in this setup, it could still provide a good short-term gain for intraday traders.
Risk management is essential, so make sure to use an appropriate Stop Loss according to your trading plan and risk tolerance.

Bitcoin faces bear market risk despite short-term rallyBitcoin faces bear market risk despite short-term rally
Bitcoin may enter a bear market by October 2025 if historical 4-year cycles play out, with a possible bottom near $50,000 by October 2026. Analysts project BTC could hit $140,000 before year-end but warn of a sharp drop afterward. While the “Repetition Fractal Cycle” signals a bearish shift, strong ETF inflows ($29.4B in 2025) and institutional demand could alter the pattern.
Currently, BTC is testing a key resistance trendline. A break below $100,000 would confirm a bearish outlook, while a move above $113,650 could revive momentum toward $140,000. Polymarket assigns a 59% chance of BTC falling under $100,000 by 2026. Macroeconomic headwinds and tighter regulations could accelerate a downturn.
In the short term, Bitcoin is up 2.1% at $112,876 — its highest in a week — ahead of U.S. jobs data, as markets bet on Fed rate cuts from September 17. Weaker ADP payrolls data boosted expectations for soft nonfarm payrolls Friday, which may support risky assets like crypto.

Trump’s Bond Strategy vs. Saylor’s High-Stakes Bitcoin BetBitcoin ( BITSTAMP:BTCUSD ) Macro Analysis: Trump’s Bond Strategy vs. Saylor’s High-Stakes Bitcoin Bet
1. Trump’s Bond Play and Crypto Ventures: A Dual Macro Hedge
Since returning to office in January 2025, Donald Trump has purchased over $100 million in corporate and municipal bonds, including debt from Meta, Citigroup, and local governments. These purchases are notable for two reasons:
Yield Lock: Trump’s bond buys were made at yields near 5%, a level not seen since the pre-2022 low-rate era. If the Federal Reserve cuts rates as expected in late 2025, the value of these bonds will rise, and their fixed 5% coupons will become increasingly attractive compared to new, lower-yielding issues.
Policy Alignment: Trump has publicly pressured the Fed to lower rates, which would further inflate the value of his bond portfolio. His administration’s fiscal and trade policies (e.g., tariffs, deregulation) could also indirectly support bond markets by stimulating demand for safe-haven assets.
Trump’s Crypto Ventures: Profiting from the Public
Unlike traditional crypto investors, the Trump family’s involvement in the sector is not built on holding Bitcoin or other digital assets. Instead, their companies focus on selling crypto-related products, cashing in on trading fees, and enriching themselves at the expense of an uninformed public. These ventures have been widely criticized as predatory, leveraging Trump’s political influence and public persona to attract unsuspecting investors into high-fee, low-value schemes—effectively an open scam that prioritizes short-term profits over genuine market participation.
Implications for Bitcoin:
If rates fall, bond yields become less competitive with risk assets like Bitcoin, potentially driving capital back into crypto.
However, Trump’s bond strategy and his family’s exploitative crypto ventures signal a preference for traditional financial instruments and extractive business models over supportive crypto policies. This could temper any positive impact on Bitcoin from his administration’s economic agenda.
2. Michael Saylor’s MicroStrategy: A Leveraged Bitcoin Bet
MicroStrategy, under Michael Saylor, has become the world’s largest corporate holder of Bitcoin, with over 446,000 BTC (worth ~$50 billion as of September 2025). The company’s strategy relies heavily on convertible debt issuance:
Debt Structure: MicroStrategy has issued billions in zero- or ultra-low-interest convertible notes (as low as 0.625%), using the proceeds to buy Bitcoin. This allows the company to avoid high interest payments and benefit from Bitcoin’s price appreciation.
Risks:
Leverage: If Bitcoin’s price falls sharply, MicroStrategy may face margin calls or be forced to sell BTC to meet debt obligations, exacerbating downward pressure on $BTCUSD.
Equity Dilution: The company’s aggressive stock issuance (planned dilution from 330M to 10B shares) could depress shareholder value if Bitcoin underperforms.
Recent Performance:
MicroStrategy’s stock NASDAQ:MSTR has outperformed Bitcoin in 2024–2025, but its valuation is now highly correlated with BTC’s price and market sentiment toward leverage.
3. Federal Reserve Policy: The Wild Card
Current Rates: The Fed has held rates at 4.25–4.50% since late 2024, but markets anticipate cuts in late 2025 (potentially 0.50–0.75% by year-end).
Impact on Bitcoin:
Rate Cuts: Historically, lower rates boost risk assets. Bitcoin could benefit from increased liquidity and weaker dollar, as seen in late 2024 when BTC rallied following Fed easing.
Inflation & Macro Risks: If cuts are delayed or inflation resurges, Bitcoin may face headwinds as investors favor bonds or cash.
4. The Crypto Winter Thesis: Is Doomsday Coming?
Bull Case: If the Fed cuts aggressively and liquidity floods markets, Bitcoin could resume its upward trajectory, especially if institutional demand (e.g., ETF inflows) remains strong.
Bear Case:
MicroStrategy’s Leverage: A sharp BTC drop could force NASDAQ:MSTR to liquidate holdings, triggering a cascade effect.
Regulatory Risks: Trump’s bond focus, his family’s extractive crypto ventures, and potential regulatory crackdowns could dampen sentiment.
Macro Uncertainty: Geopolitical tensions, recession fears, or a stronger-than-expected dollar could further pressure risk assets.
Technical Outlook:
BITSTAMP:BTCUSD is currently trading at $109,430 (as of September 4, 2025), up 1.63% over the past week but still range-bound between $107K–$112K.
Support/Resistance: Watch $105K (psychological support) and $115K (next resistance). A breakout or breakdown here could signal the next major move.
Conclusion: A Tale of Two Strategies
Trump’s bond purchases and push for rate cuts could indirectly benefit Bitcoin by reducing the appeal of fixed income, but his administration’s stance on crypto, and his family’s history of exploiting the public through crypto ventures, remains a significant red flag. Meanwhile, MicroStrategy’s leveraged Bitcoin bet is a high-risk, high-reward play that could either propel BITSTAMP:BTCUSD to new highs or accelerate a downturn if forced liquidations occur.
Traders should monitor:
Fed meetings (next: September 16–17, 2025) for rate cut signals.
MicroStrategy’s debt maturity schedule and Bitcoin holdings.
Trump’s policy shifts on crypto regulation and fiscal stimulus, as well as any new developments in his family’s crypto-related businesses.
Final Thought: The stage is set for a volatile Q4 2025. While the macro backdrop favors risk assets if the Fed eases, the specter of leverage unwinding, regulatory risks, and the Trump family’s extractive crypto practices looms large. Caution and active risk management are advised.
NASDAQ:MSTR NASDAQ:COIN TVC:GOLD TVC:SILVER NASDAQ:MARA BITSTAMP:ETHUSD CRYPTOCAP:USDC NASDAQ:TSLA NASDAQ:NVDA


BITCOIN Bearish Breakout! Sell!
Hello,Traders!
BITCOIN is going down
Now and the coin made
A bearish breakout of the
Key horizontal level
Of 110k$ so we are locally
Bearish biased and we
Will be expecting a
Further bearish move down
Sell!
Comment and subscribe to help us grow!
Check out other forecasts below too!
Disclosure: I am part of Trade Nation's Influencer program and receive a monthly fee for using their TradingView charts in my analysis.


In a range-bound market, the main strategy is to short at highs.The recent movement of Bitcoin has once again validated the predictive logic put forward last week. It was previously clearly stated that "after price retests the lower support level, there may be a minor rebound" – and the current market is unfolding exactly as this rhythm suggests: after touching the key support zone, the price has indeed rebounded, but judging from the chart performance, the rebound momentum is noticeably weak.
Regarding the subsequent operation direction, before the rebound can break through the key resistance level on the 4-hour timeframe, the overall trading strategy should still focus on "shorting at highs". Pay attention to the resistance level around 110,000 on the upside, and the recent low around 107,000 on the downside.

BTCUSDshort term buy on bitcoin. Price sweeped a low and broke internal structure which is a liquidity grab. price should continue higher and reach one of the supply/demand zones.


BTC: at a weird spotBTC price breaking below $112k is a big deal. It made a lower low similar to June, but from EW perspective, it marked the completion of a significant top. It also confirmed that the inverse head and shoulder pattern has failed. Now, there are several pathways opened up where price can either take a nosedive or chop around a bit or go back up with even greater intensity and there is no way of knowing which one, until it happens.
1. Blue path: this could be an extension of minuette degree wave 5. Instead of completing subminuette 5 waves move, maybe it is only the wave 1 of 5. If that is the case, then this correction should be winding down very soon. This move down in price during August looks to be a three waves move, most likely a wxy. It has tapped the golden zone from June low to August high. For blue path to be true, we should see $112k regained early next week and ATH reached before end of September. If this plays out, then we will see the parabola that everyone is waiting for!
2. Green path: this assumes minute degree wave 3 has completed and wave 4 is on going. This would be the most painful scenario, since the chop will be quite brutal and shakeout a lot of people on both sides. specially if price action takes a triangle shape, then it can go on for a while. The move down so far is in 3 waves and the first wave being in another 3 waves, it is most probable that the overall move will not be an impulse. It might turn out to be a diagonal to start wave 1 to the downside, but that will be an alternate count of an alternate count. For now, this scenario will assume a slow ride down to $90-$70k, hopefully support at the trendline in the next 2-3 months.
3. Red path: most bearish. Would assume minute degree wave 5 is complete and has marked the completion of Minor wave 1. Minor wave 2 can travel a lot. To reach the golden zone could take price to $32k. The confirmation would be the trend line break in the $85k region. Depending on how fast the price drops, it may last for the next 6-8 months with steep bounces along the way.
Right now, exiting is the most difficult decision to make. I would be extremely careful to put any leverage on either side of the trade. I have taken profit but not going to either exit or put more capital at this moment.

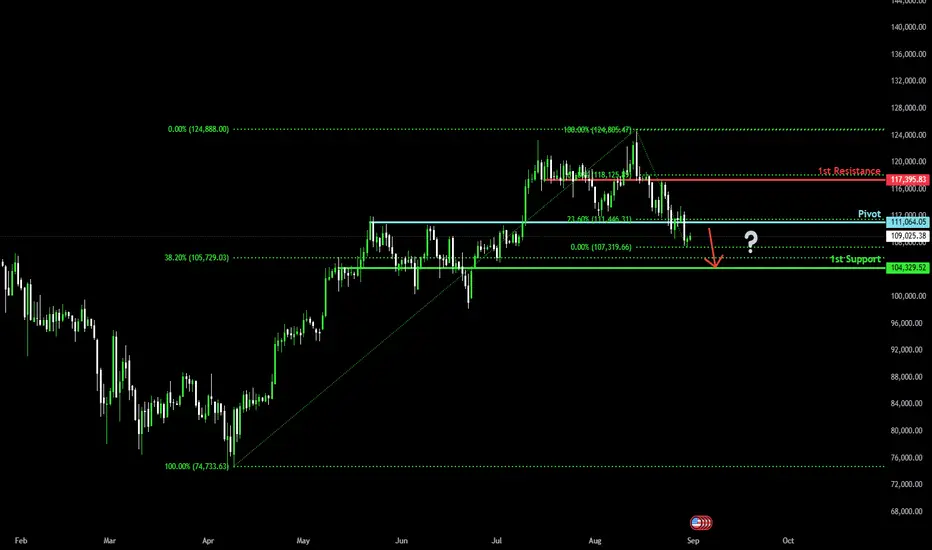
Price drop from overlap resistanceBitcoin (BTC/USD) is rising towards the pivot, which acts as an overlap resistance that lines up with the 23.6% Fibonacci retracement and could drop to the 1st support.
Pivot: 111,064.05
1st Support: 104,329.52
1st Resistance: 117,395.83
Risk Warning:
Trading Forex and CFDs carries a high level of risk to your capital and you should only trade with money you can afford to lose. Trading Forex and CFDs may not be suitable for all investors, so please ensure that you fully understand the risks involved and seek independent advice if necessary.
Disclaimer:
The above opinions given constitute general market commentary, and do not constitute the opinion or advice of IC Markets or any form of personal or investment advice.
Any opinions, news, research, analyses, prices, other information, or links to third-party sites contained on this website are provided on an "as-is" basis, are intended only to be informative, is not an advice nor a recommendation, nor research, or a record of our trading prices, or an offer of, or solicitation for a transaction in any financial instrument and thus should not be treated as such. The information provided does not involve any specific investment objectives, financial situation and needs of any specific person who may receive it. Please be aware, that past performance is not a reliable indicator of future performance and/or results. Past Performance or Forward-looking scenarios based upon the reasonable beliefs of the third-party provider are not a guarantee of future performance. Actual results may differ materially from those anticipated in forward-looking or past performance statements. IC Markets makes no representation or warranty and assumes no liability as to the accuracy or completeness of the information provided, nor any loss arising from any investment based on a recommendation, forecast or any information supplied by any third-party.
BTCUSD 15M Setup – Short-Term Bearish StructureBitcoin is showing signs of exhaustion after testing resistance near 111.4K. The reaction at this level will decide the next major move.
🔹 Bearish Scenario (Main Bias)
Price tapped into a supply zone / resistance cluster and failed to break higher.
Market structure suggests a potential series of lower highs → lower lows forming.
Key downside targets to watch:
110.68K → 110.20K
109.90K → 109.30K
Deeper liquidity levels around 108.70K → 107.70K
🔹 Bullish Contingency (Alternative)
If BTC breaks and sustains above 111.43K, shorts are invalidated.
A clean break and retest could open the way toward 111.9K+.
⚡ Trading Plan
Stay patient: look for a rejection and confirmation at resistance before shorting.
Manage risk tightly — this zone could still produce a fakeout for liquidity grabs.
Shorts are favored unless bulls reclaim 111.43K convincingly.

BTC on high time frame
"Hello traders, focusing on BTC, the price is at a critical level and indicating a potential upward movement. After sweeping liquidity near the $110,000 zone, it appears poised to rise. The initial take profit target is $117,000. However, if the price closes below $107,000 on high time frames, this analysis could be invalidated."
If you need further insights or have more details to discuss, please let me know!

BTCUSD Rejected its Daily Support and Ready For FlyHello Traders
In This Chart BTCUSD HOURLY Forex Forecast By FOREX PLANET
today BTCUSD analysis 👆
🟢This Chart includes_ BTCUSD market update)
🟢What is The Next Opportunity on BTCUSD Market
🟢how to Enter to the Valid Entry With Assurance Profit
This CHART is For Trader's that Want to Improve Their Technical Analysis Skills and Their Trading By Understanding How To Analyze The Market Using Multiple Timeframes and Understanding The Bigger Picture on the Charts

BTC Ready to Dump?Liquidity Grab Done – Next Stop: Demand Zone! Bitcoin just tapped into a key premium zone, grabbed liquidity above recent highs, and is now showing signs of distribution.
✅ Equal highs? Swept.
📦 Imbalance below? Still open.
📉 Structure shifting bearish? Confirmed.
We're seeing clear signs of a sell-off brewing, with price likely targeting the 109.3k → 108.2k demand zone next.
This isn’t just a dip — it's a potential smart money move to fill that imbalance and hunt liquidity sitting below.
🛑 Don’t get trapped in the chop — watch for continuation below 109.7k to confirm the slide.
Trying to post daily.

Bitcoin super-cycle 2020In mid-2020, Bitcoin broke out from a multi-year resistance line, turned it into support, carving out a logarithmic bull channel that held all the way up the new supercycle's ATH. I believe Ethereum is preparing for a similar scenario mid-2025. Link to correlating ETH chart will be in notes.
If Ethereum followed the same route, we would have all the clues we needed to exit near the next super-cycle's peak.

No rush buying BTC, bearish divergence explanationI'm not bullish on BTC on weekly TF,
This is the daily TF chart
1. The chart has a bullish channel with MA400 support
2. with very clear how divergence works on pas higher highs and bearish divergence
3. RSI divergence and MACD divergence work differently
RSI needs support broken, while MACD just needs above 50 or under 50


Potential Bear Trap in The Next 4 DaysIf the market dips, buy the dip ! I believe the next rally will be one that closes the season.
Remember, most crypto usually only rally for 20-30 days before they go on the longest sideways. Hence it's tricky to time the market.

BTCBitcoin is preparing for its next major move. Traders should closely monitor key levels for confirmation before positioning.

get readyget ready says btc
have you seen crossovers - up and down
not the ema crossing another ema
or sma crossing another sma
i'm talking about ema crossing its own sma
i've never seen checking or using these type of crossover analysis
here you will see that ema 50 crossing down sma 50 ( dotted orange crossed down blue )
as similar ema 100 crossing down sma 100 ( dotted red crossing down red )
now the ema 50 about to cross down sma 100
can you see that?
here we used 50, 100, 200 & 365
check it out & try it out !!
