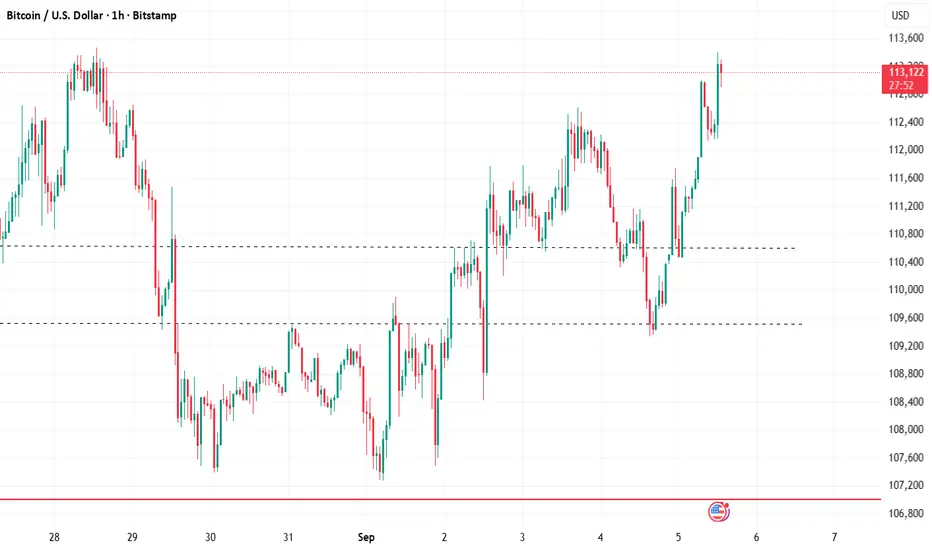
btc levels BTC didn't hold the 112002 level and fell down to the 109740 red level to a low of 109738 best levels in the world if you took profits at 112002 we should be good we can fall as far as 108804 to stll make a higher low so can fall further if in short lock in profits 110008 or if we dip below 109740
BTCMINI trade ideas

Bitcoin Update – The Next StepsBitcoin Update – The Next Steps
Hello traders,
BTC is still moving in line with the outlook I shared previously. Price is now approaching the short zone according to technical structure. For those who prefer not to enter immediately, it may be better to wait for a reaction on the M15–M30 timeframes. The downside is that entries may not be as perfect, but the win rate could improve thanks to additional confirmation.
At the moment, BTC’s price action remains relatively slow. It’s possible that price will consolidate around the entry area for a while, as there is still significant liquidity from the previous long move and market sentiment continues to lean towards upside expectations.
Patience is key here. I’ll update again if there are structural changes. In the meantime, use this scenario as reference and feel free to share your thoughts in the comments so we can discuss further.

BTCUSD Retrace BTCUSD
Target towards 118
I'm not a story teller, neither i trade on news.
The only story what u should be reading is the chart itself

BTCUSDi am looking for 1 sharpe retest and quick short on btcusd, as on major higher and high 3 major attempt on weekly time frame. simple draw line you may understand the reason as trend line has a huge gap beetween market that gap considerd to be filed up... if btc continued go high by end of this year. let me know your opinion in the comment. trade with confirmation only.

Outlook and Trading Ideas for Gold and Bitcoin in the FutureDriven strongly by the newly released non-farm payrolls data, the international gold price has achieved another breakthrough rally. It not only refreshed the recent high but also further consolidated the current bullish trend, which is fully consistent with our previous core view of "entering the market on retracements". For subsequent operations, we have a clear point: as long as there is no effective breakdown of the core support level at 3530, it is acceptable even if the entry point is more aggressive. The stop-loss distance should not be a reason to deter entry; simply reducing the position size will suffice. In the current strong trend, the "courage" to enter the market in line with the trend is far more important than obsessing over an extremely "precise entry point". Excessively pursuing a perfect entry point may instead cause one to miss out on the trending market.
In contrast, Bitcoin's performance during the same period was relatively moderate and failed to stage a strong breakout like gold. However, the market's resilience is still prominent: after multiple downward tests, the support level around 107,000 below has never been effectively broken. Moreover, judging from the trajectory of recent low points, there is a gradual upward trend, indicating that bearish momentum is continuously fading and the bottom area is becoming increasingly clear. For Bitcoin, it is recommended to adopt a strategy of "exchanging time for space": there is no need to rush to chase the rally; instead, wait for the price to retrace, then build long positions in batches and gradually. By holding positions patiently to absorb short-term fluctuations, we can wait for the release of upward space after the trend becomes clear.
Bitcoin potential pattern for Bulls to followThe 2 week potential pattern suggest potential bullish follow through.

BTC Needs a Breakout for More UpsideBitcoin is holding support at the current range. A breakout above the red dynamic trendline and confirmation above the blue zone are required for further bullish momentum. Failing to do so, the price may revisit lower levels

BTCUSD – Bearish Trend ? Hello traders! Let’s take a closer look at BITSTAMP:BTCUSD !
Recently, we’re seeing clear signs of a potential reversal after BTCUSD formed a double top pattern, and the EMA 34 and EMA 89 have crossed each other.
Breaking the support level around the previous key zone has strengthened the bearish momentum, potentially triggering a further decline towards the next support level near 103,500 USD.
However, I’m also watching for possible reversal signals at these support levels. If BTCUSD holds above 103,500 USD and forms a higher low, we may see the bulls make a comeback.
🔴 Key Levels to Watch:
Resistance: 114,000 USD
Support: 103,500 USD
EMA Crossover: Strong Bearish Signal
Stay alert and be ready for potential market shifts! Will the bulls step in at 103,500 USD? Or will the bears continue to dominate?
Let me know your thoughts and happy trading!

BTCUSD Momentum to the Downside Remains StrongSince the break of support price has been plummeting and creating obvious lower lows and lower highs. I mentioned a while back that 98k is a high probability target for this pullback and now I even think 85k is a possibility. We just take it one zone at a time.

$BTCUSD: Candle Transitions🏛️ Research Notes
Average Bullish & Bearish Percentage Change colors bullish candles violet when avg % change falls, respectfully bearish candles are colored yellow when they shrink. It's important to be aware of these transitions ahead of reversals.
They can be filtered into signals by FREMA . I'd pay attention to bullish decay while there is liquidity at upper half, and bearish decay at lower half.

BTCUSD – Range High Breakout Targeting 125KBitcoin is currently trading at 110,800 after reclaiming key structure levels. Price has pushed above local resistance and is now holding above the mid-range zone, suggesting buyers are in control.
• Range High: 113,824 – if price can reclaim and hold above this level, it confirms bullish continuation.
• Liquidity Sweep: 119,600 – 119,800 – likely first upside target where liquidity could get cleared.
• Macro Target: 125,034 – longer-term target aligning with Fibonacci extension and prior liquidity clusters.
Plan:
• Long bias above 110,600 support.
• First TP around 113,824 (range high).
• Second TP at 119,600 – 119,800 (liquidity sweep).
• Final TP at 125,000 (macro target).
Stop Loss:
Below 109,000 to invalidate the bullish structure.
This setup assumes continuation momentum. If BTC fails to hold above 110,600, I’ll reassess bias.

Buy Bitcoin, Not bananas Since the last emergency update from Yellen to buy Bitcoin, we're up by approximately 260%.
In this next update from the Volcanic Miner Empire(VME) located in El Salvador, we're giving an "All Good" update. Buy Bitcoin, don't buy Bitcoin, buy bananas like Mark Cuban - whatever, we literally couldn't care less, lol.
BUT,
If you're a sensible entity browsing a website for good investment ideas, this setup should intrigue you. We have spent two-thirds of the year consolidating the previous all-time high on Bitcoin.
The world is easing monetary policy, markets are at all-time highs (with trillions of treasury notes expiring, freeing up more fiat and chasing more gains), and China is about to start handing out money in 500 billion increments to do nothing but invest in anything, for free, no risk... LOL. This is just the tip of the Volcano.
Impossible to tell you when this happens, but given macro events, it seems much sooner than later if this cycle is to confirm.
Do what you want, do it safely, and laugh at Cuban every time you eat/see/think about a banana.

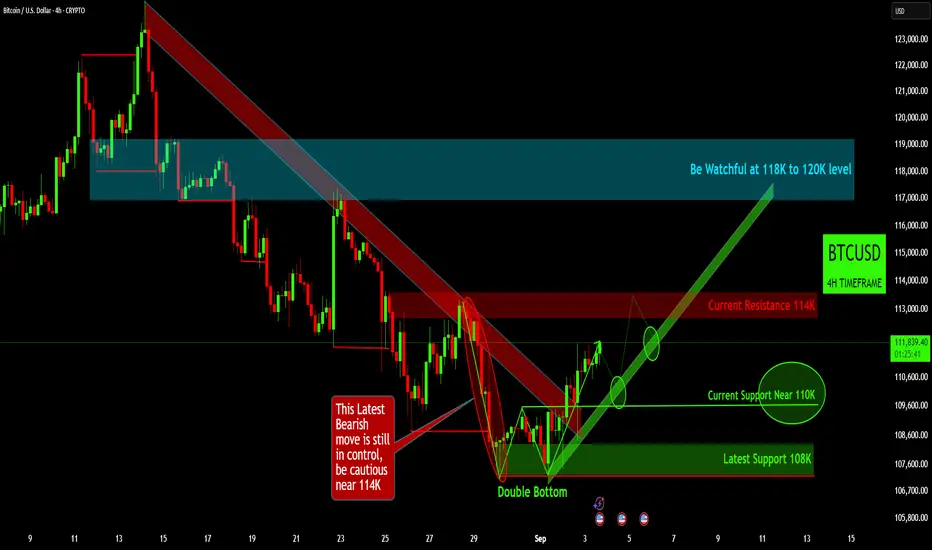
BTCUSD 4H Chart Analysis: Potential Reversal and Key LevelsBTCUSD 4H Chart Analysis: Potential Reversal and Key Levels
Prior Bearish Dominance: BTC was in a significant bearish move from mid-August, dropping from highs around 123K and forming a clear descending channel (red shaded area). This bearish trend was identified as "still in control," with caution advised for price action near the 114K level, which acted as a resistance point for much of the late August period.
Double Bottom Reversal: A crucial bullish reversal pattern, a "Double Bottom" (or W-pattern), has formed at the end of August, with bottoms around the 107K-108K level. This pattern signals a potential exhaustion of the downtrend and a shift in momentum towards the upside, establishing "Latest Support 108K."
Critical Support & Breakout: Following the Double Bottom, the price has broken above its neckline, establishing "Current Support Near 110K." This 110K level is identified as a key breakout point for the W-pattern. Trade near this trendline support and the 110K W-pattern breakout level is well-aligned with the chart’s indication of a nascent up-trend and strong support. The market is currently trading just above this support.
Upcoming Resistance & Targets: The immediate hurdle for BTC is "Current Resistance 114K." A successful break and sustain above this level would confirm stronger bullish momentum. The chart projects further upside towards the "118K to 120K level," which is highlighted as a significant area to be watchful of, representing a previous resistance zone from mid-August.
Disclaimer:
The information provided in this chart is for educational and informational purposes only and should not be considered as investment advice. Trading and investing involve substantial risk and are not suitable for every investor. You should carefully consider your financial situation and consult with a financial advisor before making any investment decisions. The creator of this chart does not guarantee any specific outcome or profit and is not responsible for any losses incurred as a result of using this information. Past performance is not indicative of future results. Use this information at your own risk. This chart has been created for my own improvement in Trading and Investment Analysis. Please do your own analysis before any investments.
BTCUSD BEARS STILL IN CONTROLDaily RESISTANCE @ 111222 seem to be very strong for BULLS to BREAK
I will go in once we take out 4H SUPPORT @ 110,809 (WILL WAIT FOR 15M BREAK)
If all thats plays out im planning to hold this to AROUND 98K
Once im in i will apdate here
Thanks

BTC/USD – Bearish Continuation Toward Demand ZoneBitcoin’s price action on the 4-hour timeframe. A descending trendline and lower highs signal short-term bearish pressure within a broader range structure.
Major Zones
Major Resistance: $124,517
(Top of recent rally, strong supply zone)
Support Zone: $97,634
(Historically tested demand area and likely first reaction zone)
Unfilled Area: Below support toward $74,424
(Price inefficiency / imbalance that could get filled if breakdown continues)
Market Movement
Price has formed a lower high structure and is respecting the descending trendline. The recent failure to reclaim higher resistance suggests bearish continuation pressure. Price is currently trading below the entry level after breaking down from the trendline structure.
Strategy
This setup reflects a trendline rejection short
Entry: $109,411 (marked zone)
Stop: Above descending trendline (red box)
Target: $97,634 (support area)
Risk-to-reward remains favorable toward the support zone.
Way Forward
If price holds below the trendline and fails to recover above the entry zone, bearish momentum may accelerate. A break below $97,634 could expose the unfilled area, inviting deeper downside toward the next key zone.
This analysis is for educational purposes only and not financial advice.*

Bitcoin Daily Bias – BullishBitcoin is currently holding above a key daily support level around $107,300 – $107,500, where price has reacted multiple times in the past. The rejection wicks near this zone highlight strong demand, suggesting buyers are defending the level.
As long as price sustains above this support, the bias remains bullish with upside potential toward the $118,500 – $123,200 zone (marked green). A daily close above $110,000 would strengthen bullish conviction and open the path for continuation.
Invalidation of this bias comes if Bitcoin breaks and closes below $107,300, which would expose further downside.
👉 Bias: Bullish above $107,300
👉 Upside target: $118,500 – $123,200
👉 Invalidation: Daily close below $107,300

What if..In the spirit of the constant barrage of outlandish price targets, here's another one..
As the bots and scammers in minds post "educational use only, NFA" 🤣🤣🤣

BTCUSD📊 BTC/USDT Analysis
✅ Update: TP2 successfully hit as per plan. (As in Previously shared plan)
⚠️ Catch: BTC made a new 1H HH around 113,434, but failed to break the 4H resistance at 113,506±.
🔎 Key Observations:
4H structure remains bearish (Lower Highs intact).
1H still holding bullish structure with HLs along the trendline.
Price is currently retesting our buying trendline zone, showing respect to HLs.
🎯 Scenarios:
Long 📌 Plan:1
Aggressive traders:
1️⃣ Bullish Case (Buying Zone Active)-CMP
BTC is at the trendline support zone → early longs possible
Long 📌 Plan:2
Conservative traders: Enter long only if BTC breaks & holds above 113,500±.
Wait for a bullish 4H confirmation candle at the buying zone before entering long.
📌 Short Plan:
Bearish Case (4H Continuation)
If BTC breaks the trendline & last HL of 1H TF , then Short for 4H bearish pattern continuation.
This would invalidate the current buying zone and 1H Bullish Pattern.
📌
Trade with proper risk management.

Lets Predict BTC on 13th Sept 2025On 13th Sept 2025
BTC should touch 106000
As the Trend is downwards and the mid of the down channel will meet 106000 on 13th sept 2025.


BITCOIN Will Move Higher! Buy!
Here is our detailed technical review for BITCOIN.
Time Frame: 1D
Current Trend: Bullish
Sentiment: Oversold (based on 7-period RSI)
Forecast: Bullish
The market is on a crucial zone of demand 112,517.45.
The oversold market condition in a combination with key structure gives us a relatively strong bullish signal with goal 121,576.05 level.
P.S
Please, note that an oversold/overbought condition can last for a long time, and therefore being oversold/overbought doesn't mean a price rally will come soon, or at all.
Disclosure: I am part of Trade Nation's Influencer program and receive a monthly fee for using their TradingView charts in my analysis.
Like and subscribe and comment my ideas if you enjoy them!

btcusd ready to fly. or not?People thinking it will go to 100k$ looking for the 200sma.
I don´t believe that.
1:6 risk:reward
What do you think?
blessings.
thks.

Bitcoin Analysis: A Stronger Rally ComingAfter three days of sideways trading, Bitcoin finally began to expand its gains today. While the rebound has been slow, our strategy is on track. It has now successfully climbed above 110,000, approaching my previously mentioned target of 112,000 and poised to break through. My bullish view remains unchanged.
Those long positions opened below 108,000 have already yielded substantial profits. While the process has been challenging, the outcome is positive. Confirming support at 107,200 has triggered a buying rebound, and prices are expected to continue rising.
The rebound has already begun, and the bullish trend will gradually intensify.
Bitcoin Strategy: It's still advisable to open long positions during pullbacks, primarily below 110,000.
For more real-time strategy analysis, follow my posts. If you agree with my views, please feel free to give me a thumbs-up. Thank you.
