Stop Dreamig, Start Trading!I’ve talked quite a lot about the illusions in crypto. I’ve made fun of the arrival of altcoin season, and even about 3 weeks ago I wrote an article saying that if I want, I can see any chart bullish, even if I flip it upside down 🙂
It’s Sunday, I’m scrolling aimlessly on the internet and I keep se

Bitcoin Back Above $70,000. Here Are Key Levels to Watch NowA trip to $60,000 and back before coffee.
Bitcoin BITSTAMP:BTCUSD spent the end of last week doing what it does best: reminding traders that fire-breathing dragons aren’t in fairytales only.
After a sharp drop to $60,033 on Thursday torched thousands of long positions, the world’s largest crypt

Elise | BTCUSD · 30M – Liquidity Reaction StructureBITSTAMP:BTCUSD
After taking external liquidity above 71,000 earlier, BTC shifted bearish and compressed into HTF demand. The recent sweep below 66,000 triggered a strong reaction, suggesting short-term upside toward internal resistance. Upside remains corrective unless structure breaks above 69,0

BTC Liquidity Probe and then Liquidity Harvest laterIn the above chart, I am trying to show that the selling pressure that drove price sharply to $60,000 was engineered by market makers to test the depth of liquidity and grab some liquidity in the process. The fact that after buy orders were triggered at the support zone of $60,000 but there was no

Bitcoin: Is the WXYXZ Correction Setting Up Wave C?Bitcoin: Is the WXYXZ Correction Setting Up Wave C?
During the last 5 days BTC declined by nearly 5% from 72250 to 65170
Looks like the B wave has more a corrective movement and is expanding as WXYXZ pattern. If the price manages to move above the previous X near 68300 it will add the chances t

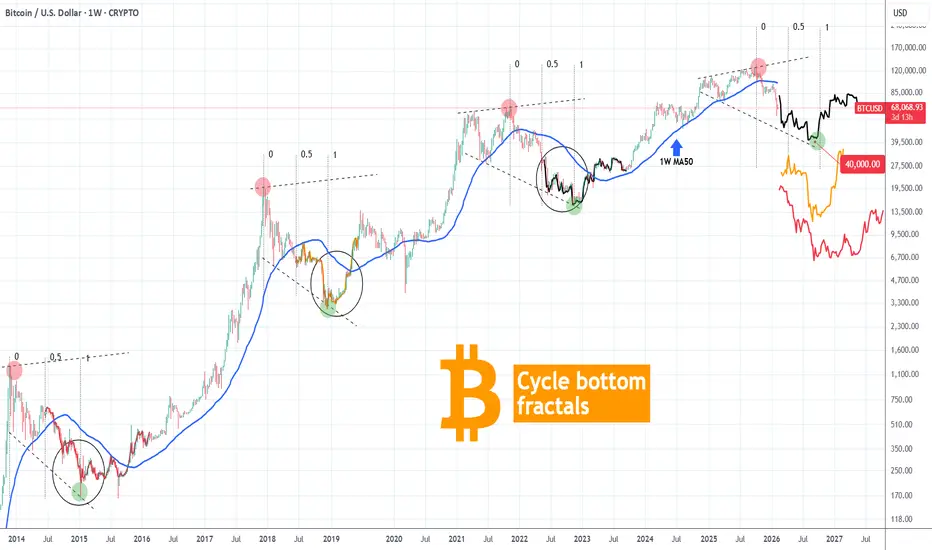
BITCOIN Cycle bottom fractals map the rest of 2026 towards $40k.Bitcoin (BTCUSD) continues to be under heavy pressure despite having the 1W MA200 holding the crash last week. Having long lost its 1W MA50 (blue trend-line), which confirmed the Bear Cycle, we are now approaching its 2nd Phase, which is the bottoming process.
This doesn't mean that the bottom is h
BITCOIN POSSIBLE MOVEMENT ( MUST READ IT )Hello Traders hope everyone is good 👍🏻
Here's my first idea on BITCOIN and what do you think about my BTC analysis? Please share in comment section and follow me for more updates on BITCOIN
Price is moving with clear market structure, confirming a valid BOS (Break of Structure) and strong instit

BITCOIN Is $50000 inevitable??Bitcoin (BTCUSD) is again on the downturn after almost reaching its 1W MA200 (orange trend-line) just last week. One would thought that long-term buyers would make their presence clear on this historically supportive level but so far their absence is more than emphatic. If this continues, the market

This Is the Bitcoin Situation for the Next 3 YearsThis is the Bitcoin Situation for the Next 3 Years
Since last August I warned that the $108,000 level could not be lost in Bitcoin or else we entered a bearish cycle and it was going to be hard.
I am not a guru nor do I have a crystal ball.
But I try to get informed and I dedicate a lot of t

Is Bitcoin Really Rising — or Just an Exit Rally?If we set emotions aside and look at the market through a pure trend-following lens , BTCUSD is currently in a state of “a rebound within a broader downtrend” rather than a genuine recovery. The recent price bounces are largely driven by short-covering after panic selling, not by a clear return o

See all ideas
Summarizing what the indicators are suggesting.
Oscillators
Neutral
SellBuy
Strong sellStrong buy
Strong sellSellNeutralBuyStrong buy
Oscillators
Neutral
SellBuy
Strong sellStrong buy
Strong sellSellNeutralBuyStrong buy
Summary
Neutral
SellBuy
Strong sellStrong buy
Strong sellSellNeutralBuyStrong buy
Summary
Neutral
SellBuy
Strong sellStrong buy
Strong sellSellNeutralBuyStrong buy
Summary
Neutral
SellBuy
Strong sellStrong buy
Strong sellSellNeutralBuyStrong buy
Moving Averages
Neutral
SellBuy
Strong sellStrong buy
Strong sellSellNeutralBuyStrong buy
Moving Averages
Neutral
SellBuy
Strong sellStrong buy
Strong sellSellNeutralBuyStrong buy
Displays a symbol's price movements over previous years to identify recurring trends.