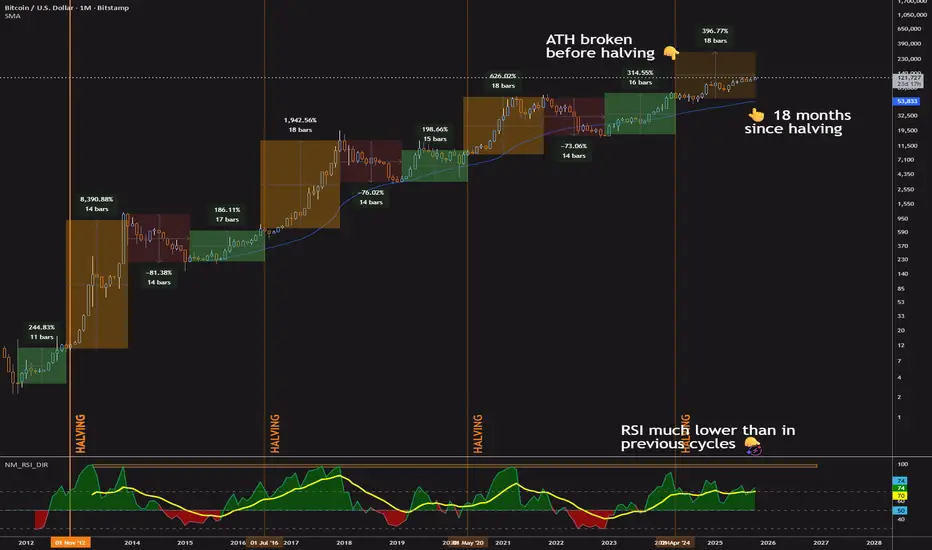
Is Bitcoin's 4-Year Cycle Over? Bitcoin’s 4-year cycle has been a go-to for traders, driven by halving events that spark price surges, sharp corrections, and recovery periods. But something’s off this time.
We’re 18 months into the post-2024 halving rally—hitting the historical peak for bull runs—yet there’s no sign of a crash,
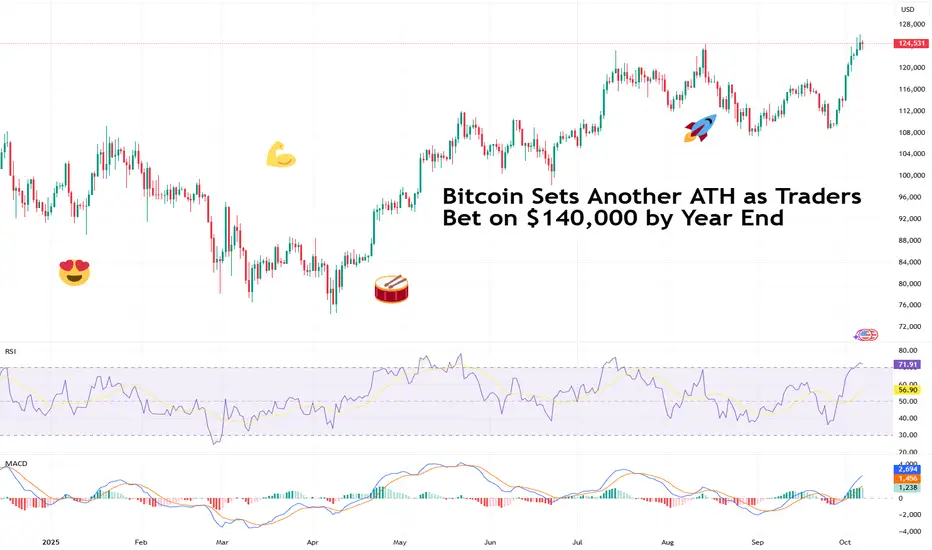
Bitcoin Sets Another ATH as Traders Bet on $140,000 by Year EndBlink and you’ll miss it. Bitcoin’s recent leg up caught lots of traders unprepared. After sinking below $110,000 few weeks back, the OG coin slingshotted to a fresh record high above $126,000 this week. Not a bad way to start October Uptober .
Now, traders are adding to bets that the price will
BTC is in 'The Final Trap' Before the Crash (Wyckoff Phase C)
In my last post, I announced the end of the bull cycle and shared my game plan for the next two years. I explained WHAT I am doing and WHY from a macroeconomic perspective.
In this post, I will show you HOW I came to these conclusions using technical analysis. This isn't a gut feeling. It is a stru

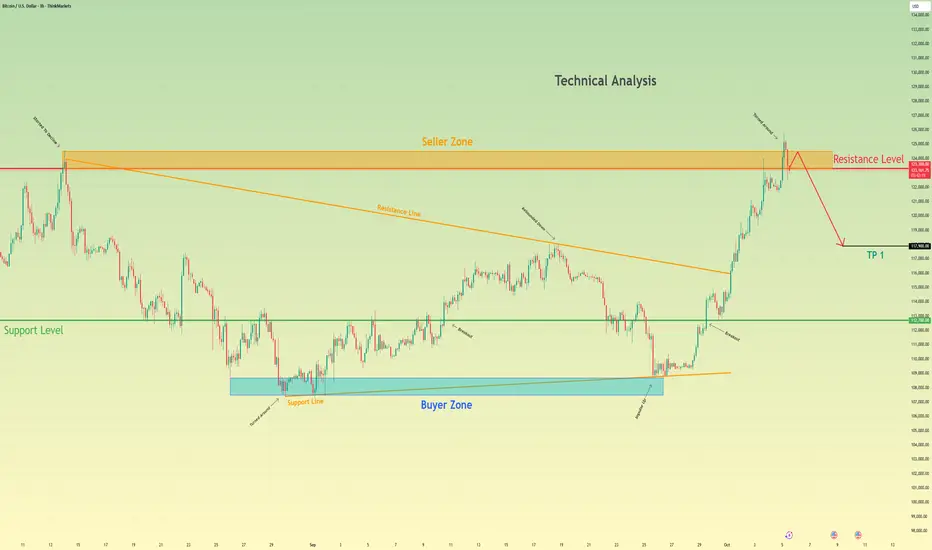
Bitcoin can Fail its Retest and Fall to 117900 pointsHello traders, I want share with you my opinion about Bitcoin. The market for Bitcoin has shown a significant sign of exhaustion and reversal after establishing a new all-time high at the 126000 level. Although this peak was preceded by a strong breakout from a prior downward wedge, the rally failed
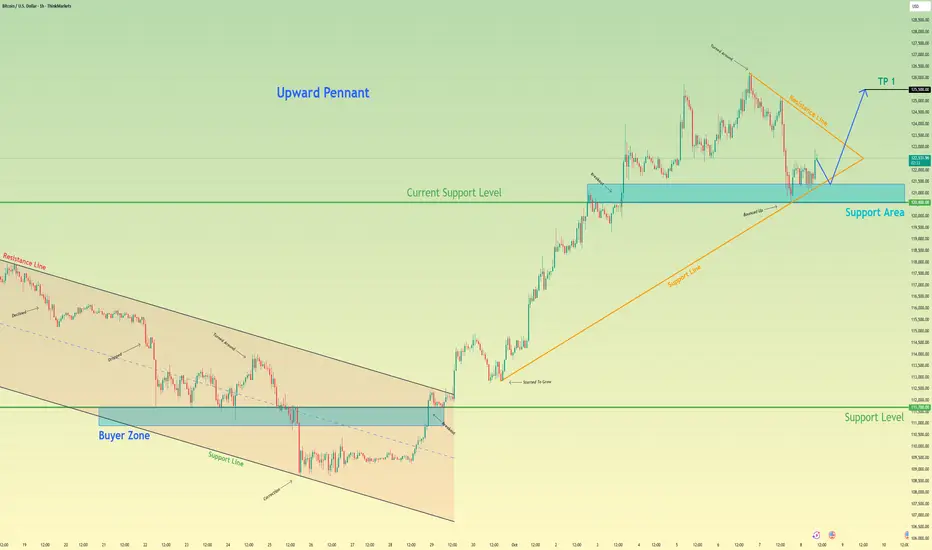
Bitcoin will Bounce From Pennant Support and Rally HigherHello traders, I want share with you my opinion about Bitcoin. The market structure for Bitcoin has recently undergone a major transition from bearish to bullish, following a decisive reversal from the 111700 support level. This shift triggered a breakout from the previous descending channel and gav
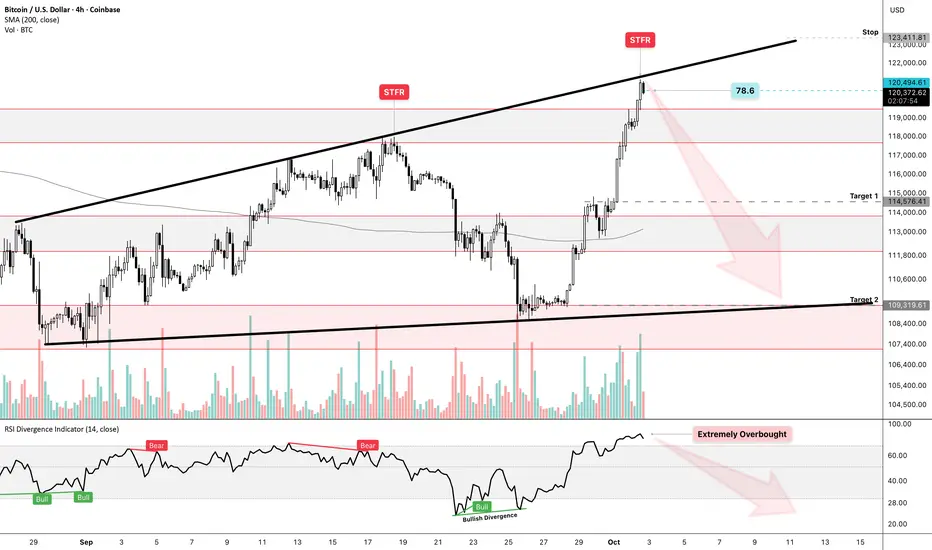
BTCUSD – Go Short or Go Broke | H4 Setup📝Thesis: Just entered a short on COINBASE:BTCUSD based on a confluence of technical and macro signals. This isn’t just about overbought RSI - it’s about asymmetric risk, deceptive bullish structure, and a broader bearish undertone most traders are ignoring.
📉 Setup Breakdown
RSI (H4): 85.12 –
Bitcoin: Uptrend Still Dominates After Surpassing 120,000 USDHello everyone,
Bitcoin has just experienced an explosive week, breaking the 120,000 USD mark and reaching a new high of 122,148 USD. Afterwards, it retraced slightly to around 121,600 USD – a natural pause after a strong rally, not yet a reversal signal.
Macro factors continue to provide moment

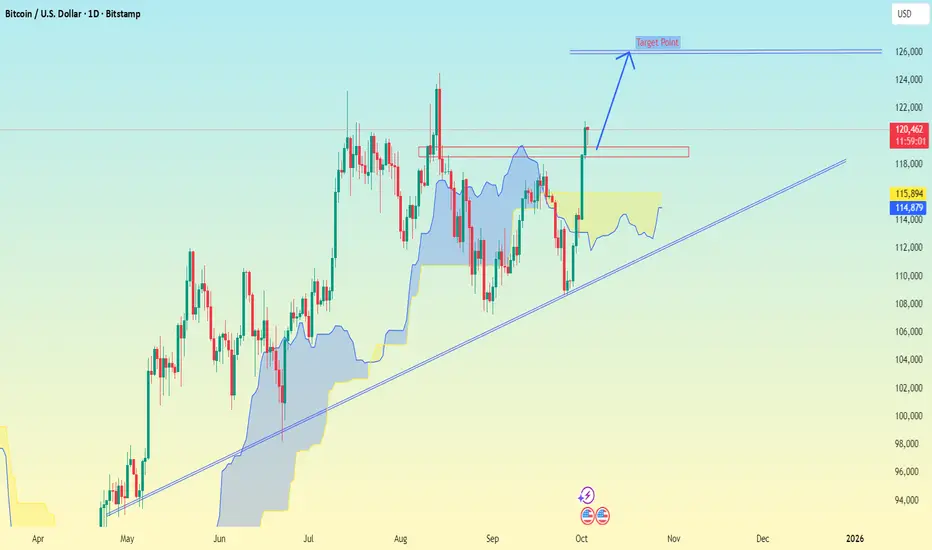
BTC/USDT (Bitcoin) – 1D timeframe..BTC/USDT (Bitcoin) – 1D timeframe with Volume Profile + Ichimoku Cloud + Downtrend line.
From my drawing and the arrow:
Current price is around $120,428.
There’s a downtrend line from the top still holding.
My arrow and label “Target Point” is pointing around $126,000 – $127,000 zone.
That are
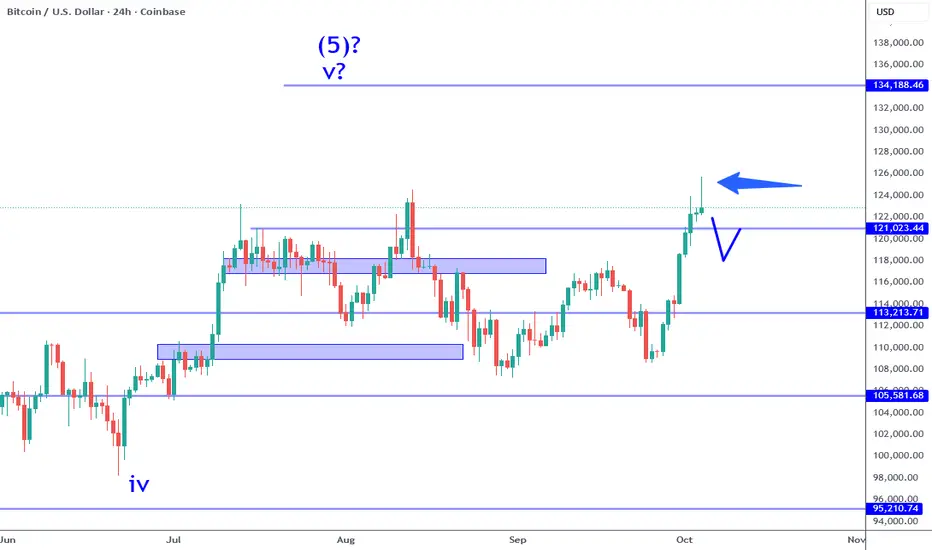
Bitcoin: 125K ATH Then Comes A Pin Bar?Bitcoin straight to new highs above 125K and now showing a bearish pin bar. This is qualifies as a failed high or fake out so far, especially if this candle closes like this. This recent price action signifies that the current consolidation is a wave 4 and this bullish move is likely the beginning o
TOP down analysis and Scaling the Range setups.Hey whats up traders,
lets have a look to the Timeframe alignment's, its a key point to clarity in the setups. Price is fractal and what is happening on one timeframe we can find on lower timeframe also.
📌 Why it's important to use correct timeframes?
- We should use timeframes based on what ty
See all ideas
Summarizing what the indicators are suggesting.
Oscillators
Neutral
SellBuy
Strong sellStrong buy
Strong sellSellNeutralBuyStrong buy
Oscillators
Neutral
SellBuy
Strong sellStrong buy
Strong sellSellNeutralBuyStrong buy
Summary
Neutral
SellBuy
Strong sellStrong buy
Strong sellSellNeutralBuyStrong buy
Summary
Neutral
SellBuy
Strong sellStrong buy
Strong sellSellNeutralBuyStrong buy
Summary
Neutral
SellBuy
Strong sellStrong buy
Strong sellSellNeutralBuyStrong buy
Moving Averages
Neutral
SellBuy
Strong sellStrong buy
Strong sellSellNeutralBuyStrong buy
Moving Averages
Neutral
SellBuy
Strong sellStrong buy
Strong sellSellNeutralBuyStrong buy
Displays a symbol's price movements over previous years to identify recurring trends.
Curated watchlists where BTCUSD.P is featured.

Gen 1 crypto: from little acorns grow
15 No. of Symbols

Proof of Work: Embracing the crunch
27 No. of Symbols
See all sparks