BTC is bullish now and many Traders don't see it !So if you pay attention to the BTC chart you can see that the price has formed a Ascending wedge which means it is expected to price move as equal as the measured price movement.( AB=CD )
NOTE: wait for break of the WEDGE .
Best regards CobraVanguard
BTCUSD.PI trade ideas
Fed rate cut in focus: Bitcoin eyes new ATHFed rate cut in focus: Bitcoin eyes new ATH
Markets are on edge ahead of today’s Fed decision, with a 25 bps cut to 4.1% widely expected. Traders see this as fuel for risk assets, though surprises could trigger sharp moves. Bitcoin leads the pack, backed by $230M ETF inflows and growing dominance over alts. Still, strong sell walls at $117K–119K signal heavy resistance.
Support remains firm at $111K–113K, where fresh demand continues to absorb supply from large holders. Momentum indicators show strength, similar to Q2 when BTC rallied from $105K to $120K.
Altcoins stay in the background: ETH faces outflows and struggles to hold above $4,500, while SEC delays on new ETF applications weigh on sentiment. Other majors like Solana and Ripple could see inflows if BTC stabilizes, but downside risks remain high if expectations disappoint.

BTCToday’s Elliott Wave analysis for BTCUSD suggests the pair is following its current wave count, with potential for continued bullish momentum if key support levels remain intact. Traders should watch for confirmation before entering positions.

Bitcoin - It is bullish either way!💎Bitcoin ( CRYPTO:BTCUSD ) still remains bullish:
🔎Analysis summary:
Yes, over the past couple of days we have been seeing a quite negative correction on Bitcoin. However, looking at the higher timeframe, Bitcoin remains totally bullish. So even if Bitcoin continues with the recent correction, it would ultimately result in a bullish all time high break and retest.
📝Levels to watch:
$60.000
SwingTraderPhil
SwingTrading.Simplified. | Investing.Simplified. | #LONGTERMVISION

MAJOR ISSUES IN BITCOIN FORMATION BEARISH PATTERN FORMED THE CHART OF BITCOIN POSTED .Is now forming a rather neg EW pattern . As the Dxy is in the last minor and major wave down nearing the End I AM RATHER VERY BULLISH ON DXY I JUST NEED A NEW LOW

UPDATE ON BTC SHORTS Good Short Area $116kUPDATE ON BTC SHORTS
Good Short Area $116k
More shorts from $116k
Targeting $113,200 or Down
Fake Breakout (According to TA)
Not a Financial advice

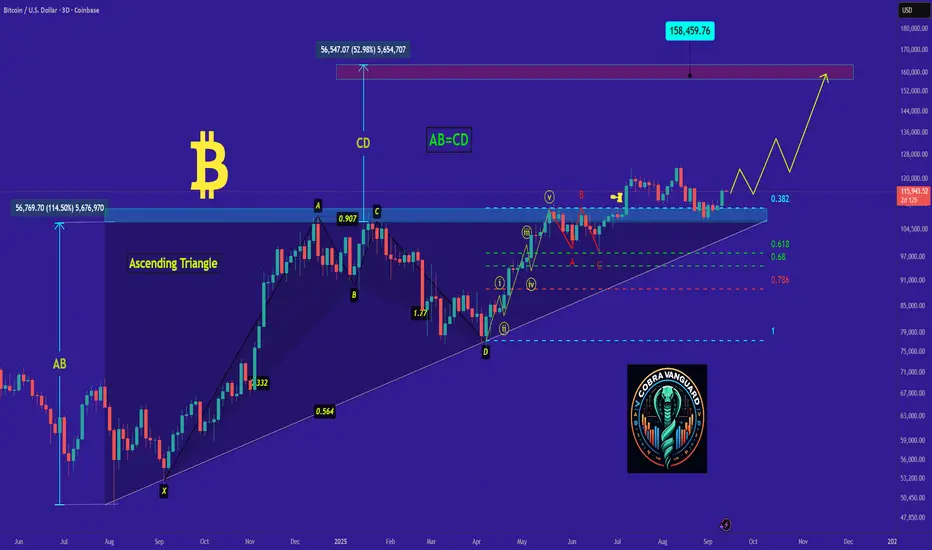
Bitcoin is bullish now & many Traders don't see it !!!Well, so far, the price has broken the triangle and the pullback is being completed. From here on, if nothing unusual happens, we can be hopeful that Bitcoin will reach $150k.
previous analysis
Bitcoin’s Next Bull MoveBitcoin’s Next Bull Move
Bitcoin is once again showing signs of strength, and the current setup offers a fascinating opportunity for traders.
If the price manages to break above the $116,900 level, there’s a strong technical case for a quick move toward the $119,000–$120,000 area, possibly within hours, or just a few days.
So why is this level so important? Let’s break it down step by step:
1. The Bull Flag in Action
Bitcoin is forming a bull flag, a classic continuation pattern that often appears after strong upward moves. The idea behind the bull flag is simple: price consolidates in a controlled pullback, only to resume its rally once the consolidation breaks.
Looking at the chart, you’ll notice that Bitcoin has respected these patterns several times in the past. If this current flag breaks to the upside, it naturally projects a target right around $119,000–$120,000, the next logical step in the ongoing bull trend.
2. Confirmation From a Head & Shoulders Breakout
What makes this setup even more compelling is that it aligns with a recently confirmed inverse head and shoulders pattern. The breakout from that formation points to the very same price levels—the $119k to $120k zone. This convergence of signals adds weight to the bullish scenario.
Even more exciting! The measured move aligns perfectly with the 100% Fibonacci extension, reinforcing the probability of price reaching those targets.
3. Volume Profile: Why $120k Matters
The Volume Range Visible Profile (VRVP) shows that the $116k–$120k region is a high-volume area. This means many positions have historically been taken here, which makes it both a magnet for price action and a tough level to break cleanly.
Above $120,000, things get more complicated, resistance builds, and momentum could slow down. But at the same time, it wouldn’t be surprising to see Bitcoin gravitate toward the next liquidity pocket around $124,000 if momentum remains strong.
4. Why This Moment Matters
Patterns repeat, and Bitcoin has a history of rewarding those who recognize them early . The current alignment of:
A bull flag setup,
A confirmed inverse head & shoulders
The 100% Fibonacci projection, and
A high-volume VRVP zone
creates a rare technical harmony that makes this move worth watching closely.
If Bitcoin breaks above $116,900 with conviction, the probability of a swift rally toward $119k–$120k becomes very high. From there, traders will be watching carefully how price reacts at the $120k threshold, because that’s where the next big battle begins.

BRIEFING Week #37 : Beware of the FOMCHere's your weekly update ! Brought to you each weekend with years of track-record history..
Don't forget to hit the like/follow button if you feel like this post deserves it ;)
That's the best way to support me and help pushing this content to other users.
Kindly,
Phil

On-Chain Analysis: Understanding the Real Behaviour of BTC & ETHHello everyone, trading crypto isn’t just about looking at charts. To stay ahead, you need to understand the actual behaviour of holders, large capital flows, and buying/selling pressure – and that’s the power of on-chain analysis.
1️⃣ MVRV – Profits Reveal Market Sentiment
MVRV = Market Value / Realized Value. Simply put, it shows the average profit/loss of holders.
High MVRV → many holders are in profit → risk of selling increases.
Low MVRV → many holders are at a loss → the market is more likely to bounce.
Practical example: BTC dropping to a low MVRV zone during a long-term uptrend is often a good entry, because weaker holders are less likely to sell and price can rebound.
2️⃣ NUPL – Market Psychology in a Single Number
NUPL = Net Unrealized Profit/Loss, measuring total unrealized gains or losses of holders.
NUPL > 0.6 → market is greedy, pullbacks likely.
NUPL < 0 → market is fearful, cheap buying opportunities emerge.
Combining NUPL with price action and volume helps you choose buying/selling moments wisely and avoid FOMO.
3️⃣ Whale Activity – Tracking Big Players
Monitor large wallets (usually ≥1,000 BTC/ETH).
Moving coins to exchanges → potential selling → price under downward pressure.
Moving coins to private wallets → supply decreases → price may rise.
Watching whale activity ahead of major moves helps spot real trends, which ordinary charts might not reveal.
4️⃣ Exchange Inflow/Outflow – Let the Money Speak
Large inflow → more BTC/ETH on exchanges → higher selling pressure, price drops.
Large outflow → coins withdrawn → supply tightens, price tends to rise.
Combine this with trend, breakout points, and crypto news to confirm upcoming moves.
5️⃣ Application Tips
No single on-chain metric is a guaranteed signal. The strength lies in combining them: MVRV + NUPL + whale activity + inflow/outflow + price action + volume.
Example: BTC enters a low MVRV zone, NUPL < 0, whales withdraw → potential buying zone, confirmed by H4/D1 chart breakout.
Wishing you all successful trading and profitable sessions!

Bitcoin: Dump over the weekend? Bitcoin showing weakness on the Daily so expect a retrace over the weekend.
Watch out, any spike will signal the top for the Daily.
On the next couple of days we'll know if it will be a dump or just the start of a sideways move.
Next week will be crucial for the weekly trend which most likely will fail to break the ALHs and start a sideways move between $112k and $124k.
Buckle up ladies and gentlemen wild ride is coming.
Use lev wisely. Don't be greedy.

Is Btc STILL following this fractal?If Btc (on the 1 Day) is following this Eth (4 hr) fractal, then Btc may soon see a lower low.
I hope I'm wrong. But I am cautious for several reason, as also indicated in my other previously published charts.
Trade safe...

BTCUSD Short: A Corrective Decline is AnticipatedHello, traders! The price auction for BTCUSD has been clearly defined by a large ascending channel. This bullish structure has guided the price higher through a series of higher highs and higher lows, with the demand zone 2 at the 110000 level acting as a major foundational low. The initiative has remained firmly with the buyers throughout this trend.
Currently, the auction is at a critical inflection point, having reached the upper supply line of the ascending channel. This test of the highs comes after a sustained rally, and the market is now in a key area where selling pressure is expected to emerge. This price action could indicate a phase of trend exhaustion.
The primary scenario anticipates a short-term corrective move from these highs. The expectation is that after a potential final push higher, the price will be rejected from the channel's resistance. A confirmed reversal would signal a temporary shift in control to sellers. The take-profit for this corrective play is therefore set at the 113400 level, targeting the major horizontal demand zone. Manage your risk!

BTCUSD – Healthy Correction Before the Next Rally?Hi everyone, Ken here!
Technically, BTCUSD is trading within a clearly defined ascending channel, with a bullish rhythm that’s hard to overlook. The recent retracement reflects a healthy correction, potentially setting the stage for the next upward move.
Price is now approaching a key support zone, marked by the lower boundary of the channel and a prior demand area. If this level holds, it could provide buyers with a strong re-entry opportunity. The next upside target is around 118,600, aligning with the channel’s upper boundary.
Of course, momentum may not appear right away — the market could consolidate, produce false breakdowns, or even accelerate sharply without much warning.
Bottom line: The uptrend remains in control. This pullback looks more like a step back to gather strength than a signal of reversal.
Good luck and happy trading!

BTC | Buy - Let's Go!Strategy: Impulse Correction
Direction: Bullish
Moving Average: Blue above Red
Fib Retracement: 38.2 reached
MACD > 0
1st Target = 116 805
2nd Target = 118 391
3rd Target = 120 435
Entry: 115 972
SL: 114 860
Trade 8/20

The Witch Hunt Against 0.5R – A Reversed Perspective on TradingThe case for 0.5R: probability over ego
Most traders focus on 1:2 or 1:3 targets – but here I’ll show why 0.5R with ATR can be an easier, more consistent approach for many.
Till today, I’ve posted 6 trade ideas here on TradingView. All of them hit their targets. That’s a 100% winrate – all with the exact same simple structure.
(On TradingView, published Ideas cannot be edited or deleted – so these trades are shown exactly as they happened.)
Here’s a recent example where the 0.5R concept played out perfectly:
Before diving into the details, let’s first define two key terms: R and ATR.
What is “R”?
In trading, “R” = one unit of risk. It’s the amount you are willing to lose on a single trade.
If you risk $100 per trade, then:
• If the stop is hit → –1R = –$100.
• If the target is hit → +0.5R = +$50.
So when I say “0.5R target,” it simply means half the size of the risk you took.
What is ATR?
ATR = Average True Range, a measure of market volatility.
It tells us how much price typically moves during a given period.
By default, ATR is calculated from the last 14 candles – this is the standard setting most traders use.
Using ATR makes stops and targets logical, not random.
For example:
• 2 ATR stop, 1 ATR target = 0.5R
• 3 ATR stop, 1.5 ATR target = 0.5R
Both setups respect market volatility while keeping the same risk/reward structure.
The Setup in Numbers
All my trades here used exactly this approach:
• Stop: 2 ATR (sometimes 3 ATR)
• Target: 1 ATR (or 1.5 ATR)
• Risk/Reward: 0.5R
For example, with ATR = 1200:
• Stop = 2 ATR = 2400 points = –1R
• Target = 1 ATR = 1200 points = +0.5R
One green Trading Unicorn beats two reds – that’s the 0.5R logic.
That’s the foundation. Everything else – winrate, psychology, consistency – builds on this.
The Dogma of 1:2R, 1:3R and Higher
The trading world has developed a kind of witch hunt against any setup below 1:2 or 1:3. It has become the so-called “professional standard.”
But here’s the truth nobody talks about:
• 1:3 rarely hits on the first attempt.
• It usually takes multiple tries – each one adding risk, losses, and stress.
• By the time one 1:3 target is finally hit, many traders have already lost money or burned mental energy.
On paper, high-R multiples look perfect.
In practice, for most traders, they are psychological torture.
One small green Trading Unicorn win is often worth more than chasing oversized targets that almost never arrive.
Visual breakdown:
• 1:3 R/R – great if it hits, but usually doesn’t on the first try.
• 1:2 R/R – “more realistic,” yet still often fails before reaching target.
• 0.5R ATR – smaller, faster, higher probability – it usually hits first.
Why 0.5R Flips the Script
A 0.5R setup often looks “too small” to many traders – but that’s exactly the point.
• High probability: most trades hit target on the first attempt.
• Not mentally exhausting: no long waiting, no constant pressure.
• Quick wins and confidence: reward comes fast, reinforcing discipline.
• Consistency: with an 80%+ winrate, just a couple winners cover the losses.
Example: If 1 trade loses (–1R), only 2 winners (+2 × 0.5R = +1R) are enough to breakeven.
This isn’t just math – it’s where probability and psychology align in practice.
And here’s the hidden edge: with smaller, faster ATR-based targets, you don’t need to commit to being a “bull” or a “bear.”
• Bulls chase big breakouts, but often wait too long.
• Bears fight the trend, but usually get stopped before reversal.
• With 0.5R, you don’t need to predict who’s right. You can profit both ways, even against the trend, because the distance to target is short and realistic.
And here’s an extra advantage most traders ignore: markets range about 70% of the time and trend only 30%.
That means setups that require huge trending moves (1:2, 1:3, etc.) automatically have fewer chances.
A 0.5R setup, however, thrives in both conditions – ranging or trending – giving you far more opportunities simply because your target is closer and hits faster.
The Trading Unicorn stands in the middle, keeping both bull and bear under control – that’s the real power of the 0.5R concept.
Leverage and the “Close Target Paradox”
Many dismiss 0.5R targets as “not worth it” because they look close on the chart.
But here’s the paradox:
• Thanks to leverage, even a small target can equal meaningful percentage gains.
• On a 10k account, 1% = $100. That can be made in a few minutes – sometimes seconds – with a single 0.5R trade.
• Whether the market is quiet or volatile, the math still works.
This means you don’t need to wait for “the perfect market.”
With ATR-based sizing and proper leverage, the 0.5R concept can be applied to crypto, metals, forex, or stocks – anytime, anywhere.
Strategy in Action
For me, the 0.5R system works best in:
• Quick breakouts
• Break of structure followed by a pullback to a key level
• Confluences stacking at support/resistance
• Then targeting a 1 ATR move out of that zone
It doesn’t matter if I trade 1m charts, 1h, or 4h. The principle is the same.
Here’s another recent trade hitting target:
The Psychological Trap
But let’s be real. This strategy has a dangerous side: it’s too tempting.
• If you can make 1% in 3 minutes, your brain immediately wants to repeat it.
• “Just one more quick trade” becomes the thought that destroys consistency.
• Survival instinct takes over. Ego wants more.
• Soon, rules are broken.
This is why discipline and rules are non-negotiable.
And why, many times, a mentor is necessary – to keep us from breaking our own system for the hope of more gains.
The Wine Analogy
Think of 0.5R like a glass of wine:
• One or two? It relaxes you, maybe even healthy.
• Ten glasses? You lose control, do things you regret.
The concept itself is not dangerous.
The problem is how you use it. With moderation and rules, it becomes a consistent tool. Without them, it can become self-destruction.
The Hidden Cost of Chasing Big R
Trading is not just about money. It’s also about emotional capital.
• Every missed big-R target eats away at confidence.
• Every time you intervene because you “couldn’t hold,” you reinforce bad habits.
• Eventually, you’re not just losing money – you’re losing trust in yourself.
This is why so many traders sabotage themselves. The targets they set are beyond their psychological tolerance.
AI sanity-check (do it yourself)
You don’t have to take my word for it. Anyone with an AI in their pocket can sanity-check this:
Inputs:
• Winrate: 80%+
• Outcomes (in R): +0.5R on wins, –1R on losses
• Risk per trade: 1% of current equity (compounded)
• Pace: max 4 trades/day
• Sample size: 100–1000 trades
• Market: BTCUSD, 1-minute
• Profiles: (A) 2 ATR stop / 1 ATR target, (B) 3 ATR stop / 1.5 ATR target
• Entry filter: only confluences & high-probability breakouts
• Include: compounding
Prompt to any AI:
“Run a Monte Carlo with the above inputs and return the median equity curve, drawdown distribution, and percentiles.”
Final Thoughts
The 0.5R ATR system is not a holy grail.
But it challenges the dogma of chasing huge R multiples at all costs.
• It shows that winrate × probability can be just as powerful as high reward multiples.
• It adapts across instruments, timeframes, and lifestyles.
• It doesn’t care about ego. It cares about results.
Trading is personal. For some, 1:3 works.
For others, 0.5R unlocks the consistency they’ve been searching for.
Don’t be the elephant trying to climb a tree just because everyone else says it’s “the way.” Find what works for you.
Hope this perspective gave you some value.
Cheers,
Trading Unicorn

$BTC Bearish Divergence on 1H Chart Near Key Support#BTC BearishBTC/USDT on the 1-hour timeframe is flashing a bearish structure with clear divergence. The immediate correction zone looks to be around $111K, with the $110.8K support acting as the deciding level. If that floor gives way, we could see a sharp drop toward $98K. But if buyers defend the level, it may reset as a new higher low, setting up continuation. With Fed data on deck today, expect liquidity grabs both ways—first stop likely downside before any rebound.

$BTC bitcoin update for FOMC CRYPTOCAP:BTC just like last post.Bitcoin still ping-ponging ahead of the FOMC meeting. Best-case scenario: we wick below Monday's low, then reclaim and rally if positive news hits. Otherwise, a breakdown could shift momentum to the bears.
watching around 114K for now.
what you think ? up or down?

BTCToday’s Elliott Wave outlook for BTCUSD suggests the market is respecting its current wave structure, with potential for further bullish continuation if key levels hold. Traders should monitor closely for confirmation.

BTCUSD – Target Hit: $116,833.25Bitcoin has reached the upside objective I mapped from the prior point of structure, tagging $116,833.25 in today’s session.

Bullish momentum to extend?The Bitcoin (BTC/USD) has bounced off the pivot which has been identified as a pullback support, and could rise to the 61.8% Fibonacci resistance.
Pivot: 113,062.07
1st Support: 110,869.14
1st Resistance: 118,296.79
Disclaimer:
The above opinions given constitute general market commentary, and do not constitute the opinion or advice of IC Markets or any form of personal or investment advice.
Any opinions, news, research, analyses, prices, other information, or links to third-party sites contained on this website are provided on an "as-is" basis, are intended only to be informative, is not an advice nor a recommendation, nor research, or a record of our trading prices, or an offer of, or solicitation for a transaction in any financial instrument and thus should not be treated as such. The information provided does not involve any specific investment objectives, financial situation and needs of any specific person who may receive it. Please be aware, that past performance is not a reliable indicator of future performance and/or results. Past Performance or Forward-looking scenarios based upon the reasonable beliefs of the third-party provider are not a guarantee of future performance. Actual results may differ materially from those anticipated in forward-looking or past performance statements. IC Markets makes no representation or warranty and assumes no liability as to the accuracy or completeness of the information provided, nor any loss arising from any investment based on a recommendation, forecast or any information supplied by any third-party.

BTC.USD Last low probability entry. Risk little!
Buy limit entry: 115,488 - 115,406
SL- 114,974
TP- 117,403.
Be careful as price approaches reversal POI
Take partials at 1:2RR

Bulish continuation?The Bitcoin (BTC/USD) is reacting off the pivot and could potentially rise to the 1st resistance.
Pivot: 114,561.75
1st Support: 111,336.85
1st Resistance: 117,304.22
Disclaimer:
The above opinions given constitute general market commentary, and do not constitute the opinion or advice of IC Markets or any form of personal or investment advice.
Any opinions, news, research, analyses, prices, other information, or links to third-party sites contained on this website are provided on an "as-is" basis, are intended only to be informative, is not an advice nor a recommendation, nor research, or a record of our trading prices, or an offer of, or solicitation for a transaction in any financial instrument and thus should not be treated as such. The information provided does not involve any specific investment objectives, financial situation and needs of any specific person who may receive it. Please be aware, that past performance is not a reliable indicator of future performance and/or results. Past Performance or Forward-looking scenarios based upon the reasonable beliefs of the third-party provider are not a guarantee of future performance. Actual results may differ materially from those anticipated in forward-looking or past performance statements. IC Markets makes no representation or warranty and assumes no liability as to the accuracy or completeness of the information provided, nor any loss arising from any investment based on a recommendation, forecast or any information supplied by any third-party.
