On-Chain Analysis: Understanding the Real Behaviour of BTC & ETHHello everyone, trading crypto isn’t just about looking at charts. To stay ahead, you need to understand the actual behaviour of holders, large capital flows, and buying/selling pressure – and that’s the power of on-chain analysis.
1️⃣ MVRV – Profits Reveal Market Sentiment
MVRV = Market Value / Realized Value. Simply put, it shows the average profit/loss of holders.
High MVRV → many holders are in profit → risk of selling increases.
Low MVRV → many holders are at a loss → the market is more likely to bounce.
Practical example: BTC dropping to a low MVRV zone during a long-term uptrend is often a good entry, because weaker holders are less likely to sell and price can rebound.
2️⃣ NUPL – Market Psychology in a Single Number
NUPL = Net Unrealized Profit/Loss, measuring total unrealized gains or losses of holders.
NUPL > 0.6 → market is greedy, pullbacks likely.
NUPL < 0 → market is fearful, cheap buying opportunities emerge.
Combining NUPL with price action and volume helps you choose buying/selling moments wisely and avoid FOMO.
3️⃣ Whale Activity – Tracking Big Players
Monitor large wallets (usually ≥1,000 BTC/ETH).
Moving coins to exchanges → potential selling → price under downward pressure.
Moving coins to private wallets → supply decreases → price may rise.
Watching whale activity ahead of major moves helps spot real trends, which ordinary charts might not reveal.
4️⃣ Exchange Inflow/Outflow – Let the Money Speak
Large inflow → more BTC/ETH on exchanges → higher selling pressure, price drops.
Large outflow → coins withdrawn → supply tightens, price tends to rise.
Combine this with trend, breakout points, and crypto news to confirm upcoming moves.
5️⃣ Application Tips
No single on-chain metric is a guaranteed signal. The strength lies in combining them: MVRV + NUPL + whale activity + inflow/outflow + price action + volume.
Example: BTC enters a low MVRV zone, NUPL < 0, whales withdraw → potential buying zone, confirmed by H4/D1 chart breakout.
Wishing you all successful trading and profitable sessions!
BTCUSD.PI trade ideas

Is Btc STILL following this fractal?If Btc (on the 1 Day) is following this Eth (4 hr) fractal, then Btc may soon see a lower low.
I hope I'm wrong. But I am cautious for several reason, as also indicated in my other previously published charts.
Trade safe...

BTCUSD Short: A Corrective Decline is AnticipatedHello, traders! The price auction for BTCUSD has been clearly defined by a large ascending channel. This bullish structure has guided the price higher through a series of higher highs and higher lows, with the demand zone 2 at the 110000 level acting as a major foundational low. The initiative has remained firmly with the buyers throughout this trend.
Currently, the auction is at a critical inflection point, having reached the upper supply line of the ascending channel. This test of the highs comes after a sustained rally, and the market is now in a key area where selling pressure is expected to emerge. This price action could indicate a phase of trend exhaustion.
The primary scenario anticipates a short-term corrective move from these highs. The expectation is that after a potential final push higher, the price will be rejected from the channel's resistance. A confirmed reversal would signal a temporary shift in control to sellers. The take-profit for this corrective play is therefore set at the 113400 level, targeting the major horizontal demand zone. Manage your risk!

BTCUSD – Healthy Correction Before the Next Rally?Hi everyone, Ken here!
Technically, BTCUSD is trading within a clearly defined ascending channel, with a bullish rhythm that’s hard to overlook. The recent retracement reflects a healthy correction, potentially setting the stage for the next upward move.
Price is now approaching a key support zone, marked by the lower boundary of the channel and a prior demand area. If this level holds, it could provide buyers with a strong re-entry opportunity. The next upside target is around 118,600, aligning with the channel’s upper boundary.
Of course, momentum may not appear right away — the market could consolidate, produce false breakdowns, or even accelerate sharply without much warning.
Bottom line: The uptrend remains in control. This pullback looks more like a step back to gather strength than a signal of reversal.
Good luck and happy trading!

The Witch Hunt Against 0.5R – A Reversed Perspective on TradingThe case for 0.5R: probability over ego
Most traders focus on 1:2 or 1:3 targets – but here I’ll show why 0.5R with ATR can be an easier, more consistent approach for many.
Till today, I’ve posted 6 trade ideas here on TradingView. All of them hit their targets. That’s a 100% winrate – all with the exact same simple structure.
(On TradingView, published Ideas cannot be edited or deleted – so these trades are shown exactly as they happened.)
Here’s a recent example where the 0.5R concept played out perfectly:
Before diving into the details, let’s first define two key terms: R and ATR.
What is “R”?
In trading, “R” = one unit of risk. It’s the amount you are willing to lose on a single trade.
If you risk $100 per trade, then:
• If the stop is hit → –1R = –$100.
• If the target is hit → +0.5R = +$50.
So when I say “0.5R target,” it simply means half the size of the risk you took.
What is ATR?
ATR = Average True Range, a measure of market volatility.
It tells us how much price typically moves during a given period.
By default, ATR is calculated from the last 14 candles – this is the standard setting most traders use.
Using ATR makes stops and targets logical, not random.
For example:
• 2 ATR stop, 1 ATR target = 0.5R
• 3 ATR stop, 1.5 ATR target = 0.5R
Both setups respect market volatility while keeping the same risk/reward structure.
The Setup in Numbers
All my trades here used exactly this approach:
• Stop: 2 ATR (sometimes 3 ATR)
• Target: 1 ATR (or 1.5 ATR)
• Risk/Reward: 0.5R
For example, with ATR = 1200:
• Stop = 2 ATR = 2400 points = –1R
• Target = 1 ATR = 1200 points = +0.5R
One green Trading Unicorn beats two reds – that’s the 0.5R logic.
That’s the foundation. Everything else – winrate, psychology, consistency – builds on this.
The Dogma of 1:2R, 1:3R and Higher
The trading world has developed a kind of witch hunt against any setup below 1:2 or 1:3. It has become the so-called “professional standard.”
But here’s the truth nobody talks about:
• 1:3 rarely hits on the first attempt.
• It usually takes multiple tries – each one adding risk, losses, and stress.
• By the time one 1:3 target is finally hit, many traders have already lost money or burned mental energy.
On paper, high-R multiples look perfect.
In practice, for most traders, they are psychological torture.
One small green Trading Unicorn win is often worth more than chasing oversized targets that almost never arrive.
Visual breakdown:
• 1:3 R/R – great if it hits, but usually doesn’t on the first try.
• 1:2 R/R – “more realistic,” yet still often fails before reaching target.
• 0.5R ATR – smaller, faster, higher probability – it usually hits first.
Why 0.5R Flips the Script
A 0.5R setup often looks “too small” to many traders – but that’s exactly the point.
• High probability: most trades hit target on the first attempt.
• Not mentally exhausting: no long waiting, no constant pressure.
• Quick wins and confidence: reward comes fast, reinforcing discipline.
• Consistency: with an 80%+ winrate, just a couple winners cover the losses.
Example: If 1 trade loses (–1R), only 2 winners (+2 × 0.5R = +1R) are enough to breakeven.
This isn’t just math – it’s where probability and psychology align in practice.
And here’s the hidden edge: with smaller, faster ATR-based targets, you don’t need to commit to being a “bull” or a “bear.”
• Bulls chase big breakouts, but often wait too long.
• Bears fight the trend, but usually get stopped before reversal.
• With 0.5R, you don’t need to predict who’s right. You can profit both ways, even against the trend, because the distance to target is short and realistic.
And here’s an extra advantage most traders ignore: markets range about 70% of the time and trend only 30%.
That means setups that require huge trending moves (1:2, 1:3, etc.) automatically have fewer chances.
A 0.5R setup, however, thrives in both conditions – ranging or trending – giving you far more opportunities simply because your target is closer and hits faster.
The Trading Unicorn stands in the middle, keeping both bull and bear under control – that’s the real power of the 0.5R concept.
Leverage and the “Close Target Paradox”
Many dismiss 0.5R targets as “not worth it” because they look close on the chart.
But here’s the paradox:
• Thanks to leverage, even a small target can equal meaningful percentage gains.
• On a 10k account, 1% = $100. That can be made in a few minutes – sometimes seconds – with a single 0.5R trade.
• Whether the market is quiet or volatile, the math still works.
This means you don’t need to wait for “the perfect market.”
With ATR-based sizing and proper leverage, the 0.5R concept can be applied to crypto, metals, forex, or stocks – anytime, anywhere.
Strategy in Action
For me, the 0.5R system works best in:
• Quick breakouts
• Break of structure followed by a pullback to a key level
• Confluences stacking at support/resistance
• Then targeting a 1 ATR move out of that zone
It doesn’t matter if I trade 1m charts, 1h, or 4h. The principle is the same.
Here’s another recent trade hitting target:
The Psychological Trap
But let’s be real. This strategy has a dangerous side: it’s too tempting.
• If you can make 1% in 3 minutes, your brain immediately wants to repeat it.
• “Just one more quick trade” becomes the thought that destroys consistency.
• Survival instinct takes over. Ego wants more.
• Soon, rules are broken.
This is why discipline and rules are non-negotiable.
And why, many times, a mentor is necessary – to keep us from breaking our own system for the hope of more gains.
The Wine Analogy
Think of 0.5R like a glass of wine:
• One or two? It relaxes you, maybe even healthy.
• Ten glasses? You lose control, do things you regret.
The concept itself is not dangerous.
The problem is how you use it. With moderation and rules, it becomes a consistent tool. Without them, it can become self-destruction.
The Hidden Cost of Chasing Big R
Trading is not just about money. It’s also about emotional capital.
• Every missed big-R target eats away at confidence.
• Every time you intervene because you “couldn’t hold,” you reinforce bad habits.
• Eventually, you’re not just losing money – you’re losing trust in yourself.
This is why so many traders sabotage themselves. The targets they set are beyond their psychological tolerance.
AI sanity-check (do it yourself)
You don’t have to take my word for it. Anyone with an AI in their pocket can sanity-check this:
Inputs:
• Winrate: 80%+
• Outcomes (in R): +0.5R on wins, –1R on losses
• Risk per trade: 1% of current equity (compounded)
• Pace: max 4 trades/day
• Sample size: 100–1000 trades
• Market: BTCUSD, 1-minute
• Profiles: (A) 2 ATR stop / 1 ATR target, (B) 3 ATR stop / 1.5 ATR target
• Entry filter: only confluences & high-probability breakouts
• Include: compounding
Prompt to any AI:
“Run a Monte Carlo with the above inputs and return the median equity curve, drawdown distribution, and percentiles.”
Final Thoughts
The 0.5R ATR system is not a holy grail.
But it challenges the dogma of chasing huge R multiples at all costs.
• It shows that winrate × probability can be just as powerful as high reward multiples.
• It adapts across instruments, timeframes, and lifestyles.
• It doesn’t care about ego. It cares about results.
Trading is personal. For some, 1:3 works.
For others, 0.5R unlocks the consistency they’ve been searching for.
Don’t be the elephant trying to climb a tree just because everyone else says it’s “the way.” Find what works for you.
Hope this perspective gave you some value.
Cheers,
Trading Unicorn

BTCUSD – Target Hit: $116,833.25Bitcoin has reached the upside objective I mapped from the prior point of structure, tagging $116,833.25 in today’s session.

BTC | Buy - Let's Go!Strategy: Impulse Correction
Direction: Bullish
Moving Average: Blue above Red
Fib Retracement: 38.2 reached
MACD > 0
1st Target = 116 805
2nd Target = 118 391
3rd Target = 120 435
Entry: 115 972
SL: 114 860
Trade 8/20

Bitcoin Cycles Update (4H Chart)BTC is tracking within a 175-bar cycle, and price is now in the later stage of the current cycle. After a bounce toward the 115k–116k zone, momentum looks to be stalling. The Stoch RSI is in overbought territory, hinting at cycle exhaustion.
If history repeats, we could see a corrective leg lower, with potential support in the 102k–106k range before the next cycle upswing develops.
In short: Cycle suggests we’re closer to a top than a bottom.

$BTC Bearish Divergence on 1H Chart Near Key Support#BTC BearishBTC/USDT on the 1-hour timeframe is flashing a bearish structure with clear divergence. The immediate correction zone looks to be around $111K, with the $110.8K support acting as the deciding level. If that floor gives way, we could see a sharp drop toward $98K. But if buyers defend the level, it may reset as a new higher low, setting up continuation. With Fed data on deck today, expect liquidity grabs both ways—first stop likely downside before any rebound.

Bullish momentum to extend?The Bitcoin (BTC/USD) has bounced off the pivot which has been identified as a pullback support, and could rise to the 61.8% Fibonacci resistance.
Pivot: 113,062.07
1st Support: 110,869.14
1st Resistance: 118,296.79
Disclaimer:
The above opinions given constitute general market commentary, and do not constitute the opinion or advice of IC Markets or any form of personal or investment advice.
Any opinions, news, research, analyses, prices, other information, or links to third-party sites contained on this website are provided on an "as-is" basis, are intended only to be informative, is not an advice nor a recommendation, nor research, or a record of our trading prices, or an offer of, or solicitation for a transaction in any financial instrument and thus should not be treated as such. The information provided does not involve any specific investment objectives, financial situation and needs of any specific person who may receive it. Please be aware, that past performance is not a reliable indicator of future performance and/or results. Past Performance or Forward-looking scenarios based upon the reasonable beliefs of the third-party provider are not a guarantee of future performance. Actual results may differ materially from those anticipated in forward-looking or past performance statements. IC Markets makes no representation or warranty and assumes no liability as to the accuracy or completeness of the information provided, nor any loss arising from any investment based on a recommendation, forecast or any information supplied by any third-party.

Bulish continuation?The Bitcoin (BTC/USD) is reacting off the pivot and could potentially rise to the 1st resistance.
Pivot: 114,561.75
1st Support: 111,336.85
1st Resistance: 117,304.22
Disclaimer:
The above opinions given constitute general market commentary, and do not constitute the opinion or advice of IC Markets or any form of personal or investment advice.
Any opinions, news, research, analyses, prices, other information, or links to third-party sites contained on this website are provided on an "as-is" basis, are intended only to be informative, is not an advice nor a recommendation, nor research, or a record of our trading prices, or an offer of, or solicitation for a transaction in any financial instrument and thus should not be treated as such. The information provided does not involve any specific investment objectives, financial situation and needs of any specific person who may receive it. Please be aware, that past performance is not a reliable indicator of future performance and/or results. Past Performance or Forward-looking scenarios based upon the reasonable beliefs of the third-party provider are not a guarantee of future performance. Actual results may differ materially from those anticipated in forward-looking or past performance statements. IC Markets makes no representation or warranty and assumes no liability as to the accuracy or completeness of the information provided, nor any loss arising from any investment based on a recommendation, forecast or any information supplied by any third-party.

BTCToday’s Elliott Wave outlook for BTCUSD suggests the market is respecting its current wave structure, with potential for further bullish continuation if key levels hold. Traders should monitor closely for confirmation.

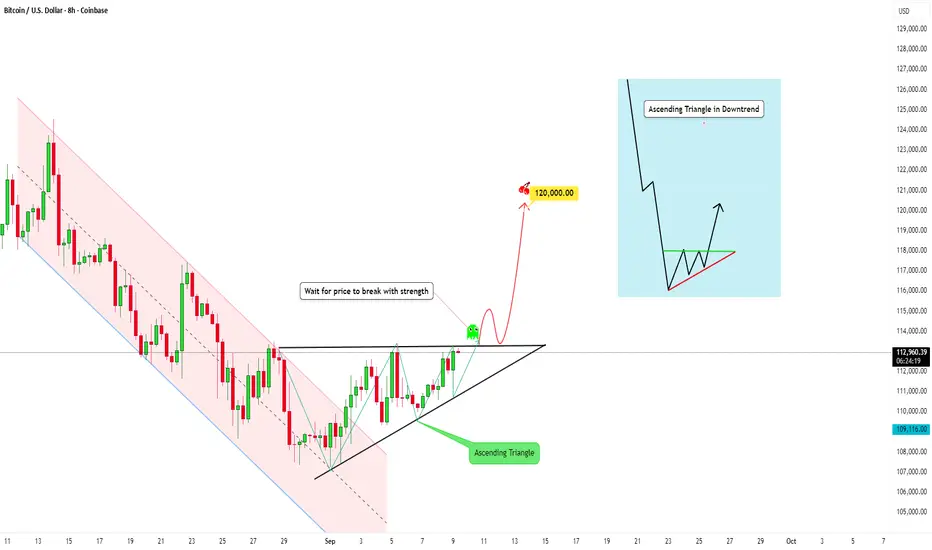
BTC has formed an Ascending Triangle in a DowntrendWhat is Happening Here?
If we take a look at Bitcoin, it's pretty interesting right now: we can observe an ascending triangle just formed. But this pattern took shape after a sharp drop in price.
An ascending triangle is a bullish continuation pattern:
- The resistance line stays horizontal (flat top).
- The support line is rising, creating higher lows.
So what does this mean?
This indicates that buyers are gradually pushing prices higher while sellers are consistently defending the resistance level.
And often with this pattern, the buying pressure overwhelms the sellers, causing a breakout to the upside.
🔹 Breakout expectation:
- Wait for breakout confirmation always! (strong candle close above resistance with volume), and/or on a retest of the broken resistance (now acting as support).
- With this pattern, if it breaks above strongly, the target can typically be measured by taking the height of the triangle and adding it to the breakout level.
🔹 Risk Factors:
- False breakouts can occur (price temporarily breaks resistance but falls back inside).
- If the pattern fails and price breaks below the rising trendline, it may signal bearish weakness.
✅ The reliability of the pattern increases on higher timeframes and with strong breakout volume.
In summary
An ascending triangle shows the following: Buyers are showing strength with rising lows, while resistance is being pressured repeatedly. A confirmed breakout above resistance could drive price toward a psychological target. Waiting for a strong breakout and possibly a retest helps reduce false signal risk.
Not financial advice, just sharing my thoughts on the charts.
Trade safely 😊
BTC long 120kadding BTCUSD to my limits. rate cut should boost crypto. then again there is the downside of selling the news. That could happen the following week. If 120k is not reached by then, I manually close
We are expecting a quite FOMC unless if the Fed got some surprises. Either a more dovish which is good or a hawkish shift which will have to close trades by market

btcusd📌 Current Prices & Context
BTC is trading around US$115,000-116,000 territory.
🔍 Momentum & Indicator Signals
Price is holding above its EMA50 in short-/medium-term charts (4H), giving dynamic support.
Economies.com
+1
Some indicators are showing overbought or weakening momentum (e.g. RSI in overbought zones, some bearish divergence).
Economies.com
+2
DailyForex
+2
The overall structure still has bullish lean, with higher lows being formed and certain demand zones being respected.
TradingView
+2
Babypips.com
+2
🟢 Bullish Case for Longs
If you’re thinking about a long trade, here’s what favors it:
Price holds above $114,000-$115,000 support. That zone seems to have reliably held demand.
A clear break above resistance near $117,000-$118,000 with good volume would likely open the way toward ~$120,000+ targets.
The dynamic support from moving averages (EMA50, etc.) can serve as trailing stops or zones to watch for bounce entries.
⚠️ Risks / Bearish Case
Things that could stop or reverse upside:
If BTC drops and closes below the ~$114,000 zone, it may test lower supports near $110,000-$107,000. That would weaken the bullish structure.
Resistance near $117,000-118,000 is rather strong; repeated rejections could lead to range-bound or small pullbacks.
Broader macro risks: interest rate decisions, ETF flow reversals, regulatory headwinds could also impact upside.
🎯 Potential Trade Plan for Long
Here’s a possible setup if you want to go long, framed as risk-reward:
Entry: near support around $114,500-115,500 (if bullish signal / bounce occurs)
Stop Loss: slightly below the low of the support zone, e.g. $113,000 or $112,500 depending on timeframe
Take Profit / Target: near the resistance area around $118,000-120,000 (if breakout)

Big Bears Waiting Near $118KNearing the finish of a small upside wave, there seems to be many bearfriends waiting near $118K. Surf carefully.

Today's BTCUSD Market AnalysisBTCUSD has shown little overall change compared to yesterday, with the broader market structure remaining intact. The support level remains firm, while esistance level continues to be concentrated in the 117,000–118,000
Buy 114500-115000
TP 115500-116500-117500
Daily-updated accurate signals are at your disposal. If you run into any problems while trading, these signals serve as a reliable reference—don’t hesitate to use them! I truly hope they bring you significant assistance

HalvingBuying $100 of Bitcoin every month for 8 years starting 9 years ago would have turned $9,600 into $115,062 (+1,098%) 🔥 check graph on dcabtc.com
BTC is an asset which is cyclic every halving which happens every 4 years price jumps up 2/3 times. In next 3 years you could have a turnover of 50% cause it's a volatile asset, but #HODL after next halving and you can triple you holdings.

Bitcoin Price To Climb Higher Amid Rising Institutional AdoptionBitcoin Price To Climb Higher Amid Rising Institutional Adoption, Yet Ethereum's Relative Value Puzzles Investors
The digital asset landscape presents a fascinating dichotomy. Bitcoin, the undisputed leader, appears poised for a significant ascent, with analysts increasingly confident in a rally toward the coveted $120,000 mark. This optimism is overwhelmingly fueled by a powerful and sustained wave of institutional adoption, underscored by staggering inflows into U.S. spot Bitcoin Exchange-Traded Funds (ETFs). However, a perplexing counter-narrative is unfolding with Ethereum. Despite its own significant institutional embrace and the successful launch of its own ETFs, the ETH/BTC price ratio remains stubbornly low, signaling a relative weakness against Bitcoin that has left many investors searching for answers.
Bitcoin's Bullish Momentum: The Unstoppable Force of Institutional Capital
The sentiment surrounding Bitcoin is palpably bullish. After a period of consolidation, the cryptocurrency has shown remarkable resilience, holding key support levels and demonstrating renewed strength. Bitcoin is trading at elevated levels, with technical analysts and market experts setting their sights on the next major psychological barrier of $120,000. A sustained break above this level is widely expected to trigger a fresh wave of buying pressure, potentially propelling the price toward new all-time highs.
A flurry of price predictions from various financial institutions and seasoned analysts paints a picture of widespread optimism. Forecasts range from conservative six-figure targets to highly bullish projections well above $200,000. These predictions are united by a common thread: the transformative impact of institutional adoption.
The primary engine driving this bullish outlook is the unprecedented success of U.S. spot Bitcoin ETFs. These investment vehicles have served as a regulated and accessible bridge for institutional capital to flow into the digital asset space. Recent weekly net inflows have been measured in the billions of dollars, reversing previous outflows and signaling a renewed and voracious investor appetite. Leading funds from major asset managers have been the primary beneficiaries, consistently attracting hundreds of millions in fresh capital.
This influx of institutional money represents a fundamental shift in how Bitcoin is perceived. Major institutions are actively adding exposure and incorporating Bitcoin into their long-term investment strategies. This is evidenced by the behavior of "whales"—large Bitcoin holders—who have been accumulating significant amounts, viewing price dips as buying opportunities. The growing institutional presence is also contributing to a reduction in Bitcoin's notorious volatility, making it a more attractive asset for diversified portfolios.
Further bolstering the bullish case are favorable macroeconomic conditions. With expectations for lower interest rates, the appeal of risk assets like Bitcoin is on the rise. A weaker U.S. dollar and lower borrowing costs historically create a fertile environment for assets with a fixed supply to thrive. The confluence of massive ETF inflows, strategic institutional accumulation, and a supportive macroeconomic backdrop has created a powerful tailwind for Bitcoin.
The Ethereum Conundrum: High Adoption, Low Ratio
While Bitcoin basks in the glow of institutional validation, the story for Ethereum is more nuanced. On the surface, Ethereum is experiencing its own institutional renaissance. The approval of spot Ethereum ETFs has been met with considerable enthusiasm, attracting billions in capital and providing a regulated pathway for traditional investors to gain exposure to the world's leading smart contract platform.
The inflow data for Ethereum ETFs has been impressive, at times even surpassing Bitcoin's on a monthly basis. Cumulative inflows have reached a significant figure, a clear testament to the growing recognition of Ethereum's value proposition, which extends beyond a simple store of value to encompass the vast ecosystems of decentralized finance (DeFi), non-fungible tokens (NFTs), and real-world asset (RWA) tokenization.
Institutions are not just buying ETH through ETFs; they are also actively participating in the network's staking mechanism. An unprecedented surge in staking activity has seen a significant portion of ETH's circulating supply locked away to secure the network and earn yield. This "supply squeeze" is fueled by both institutional players and large individual holders, underscoring the long-term conviction in Ethereum's future. With a large percentage of the total supply staked, the available liquidity on exchanges has dwindled, a factor that would typically be expected to exert strong upward pressure on the price.
Given this backdrop of robust adoption, significant ETF inflows, and a tightening supply, one would expect Ethereum to be gaining ground on Bitcoin. However, the ETH/BTC price ratio, a key metric that reflects the relative value of Ethereum to Bitcoin, tells a different story. This ratio has remained stubbornly below the 0.05 mark, a level that signals relative weakness for ETH. It currently hovers at a low level, far from its historical peak.
This persistent underperformance is a source of considerable debate. A higher ratio indicates that ETH is appreciating faster than BTC. The current suppression suggests that while absolute demand for Ethereum is strong, the demand for Bitcoin is even stronger.
Several factors may be contributing to this conundrum. Bitcoin's established brand and its narrative as "digital gold" give it a powerful first-mover advantage, particularly among institutional investors taking a conservative, phased approach. For many, Bitcoin is the initial and primary allocation.
Secondly, Ethereum's utility introduces complexities and risks compared to Bitcoin's simpler value proposition. The ongoing evolution of the network, while bullish long-term, may present a steeper learning curve for some investors.
Furthermore, a historical trend of Bitcoin outperforming Ethereum may have created market inertia, with capital continuing to flow into the asset with stronger recent relative performance. In essence, both assets are appreciating, but Bitcoin is doing so at a faster rate, keeping the ratio suppressed.
Beyond the Big Two: Other Trending Cryptos to Watch
While Bitcoin and Ethereum dominate, the broader cryptocurrency market is a hotbed of innovation. Investors are exploring a diverse range of projects with potential for significant growth, driven by several key trends.
Layer-2 Scaling Solutions: As Ethereum faces demand-driven congestion, Layer-2 solutions have become indispensable. Projects offering faster, cheaper, and more scalable environments for decentralized applications are capturing a growing share of activity and represent a crucial investment theme for ecosystem growth.
Integration of Artificial Intelligence and Blockchain: The convergence of AI and blockchain is gaining considerable traction, creating new possibilities in automated trading, decentralized organizations, and sophisticated dApps. Projects leveraging AI to enhance blockchain capabilities are attracting significant attention.
Tokenization of Real-World Assets (RWA): This is poised to be one of the most transformative trends. Representing physical assets like real estate and commodities as digital tokens on a blockchain has the potential to unlock trillions in illiquid assets, making them more accessible and tradable globally. This is expected to drive a new wave of adoption.
Meme Coins and Community-Driven Projects: While often speculative, meme coins continue to exert significant influence, demonstrating the power of community and viral marketing. Their enduring popularity highlights the importance of cultural relevance in the crypto space.
The altcoin market is characterized by higher volatility and risk. However, for investors with a high-risk tolerance, it offers the potential for outsized returns based on technological adoption and market trends.
The Road Ahead: A Market at a Crossroads
The cryptocurrency market is a study in contrasts. The overwhelming force of institutional adoption is propelling Bitcoin toward potentially historic highs. The success of Bitcoin ETFs has fundamentally altered the market structure, creating a sustained demand that shows no signs of abating.
Conversely, the curious case of the ETH/BTC ratio serves as a reminder of the market's complexity. While Ethereum's own institutional story is compelling, it has yet to translate into sustained outperformance against Bitcoin.
Looking ahead, the market's trajectory will be shaped by key factors. Central bank monetary policy will continue to play a crucial role. The continued growth of the ETF market will be a primary indicator of institutional sentiment. And ongoing innovation in scaling, AI, and tokenization will determine the next generation of leading projects.
For investors, the current environment offers both immense opportunity and significant risk. The bullish case for Bitcoin appears robust, but volatility remains. Ethereum's long-term value is undeniable, but its short-to-medium-term performance relative to Bitcoin is less certain. The altcoin market holds promise but requires careful navigation.
In conclusion, the narrative of rising institutional adoption is powerfully reshaping the digital asset landscape. As Bitcoin bulls eye their next target, the broader market watches closely, navigating the crosscurrents of innovation, regulation, and macroeconomic forces that will define the future of this transformative technology.

Forex market opening and its impact on BitcoinAs we mentioned in our analysis, Bitcoin had entered a range, and we said that we could trade inside it using the range strategy. We also noted that whichever side the range breaks, the price would encounter one of the zones marked with yellow circles, and we should be careful about fakeouts and a possible return into the channel. Now the price has reached that zone, and at the moment it’s not suitable for a short position until we get strong confirmation. My personal opinion is that the price will go up and then return back into the range. ✅

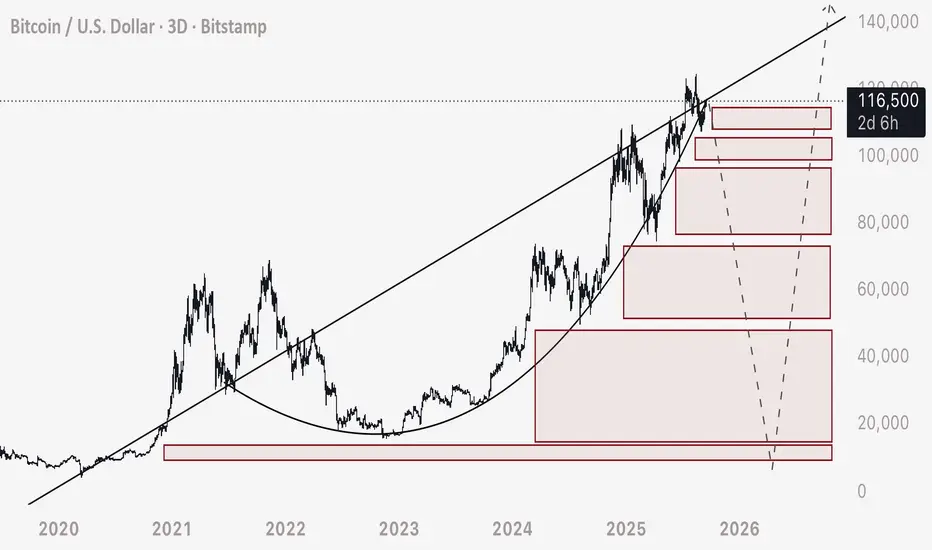
Bit Coin Short Term bearishThis chart presents an Elliott Wave analysis of Bitcoin (BTC/USD) on a 4-hour timeframe, shared by Wave Count Pro. The pattern shows a complex corrective structure unfolding within a well-defined channel, with key turning points labeled as A, B, C, D, and a projected E.
Currently, price action is approaching a critical decision zone around $117,211.36. The analysis suggests two potential scenarios:
Bullish Breakout: If the price breaks above the $117,211.36 resistance, it could trigger a strong bullish move toward the upper trendline, targeting around $140,218.55 (labeled as point E).
Bearish Rejection: A failure to break above this level could lead to a pullback toward the lower boundary of the channel, possibly completing a wave (e) before a potential rally.
Key Levels:
Buy Above: $117,211.36
Sell Below: $113,966.84
WaveCount Pro
Gautam Khanna

BTC 2017-2018 Bull Run Overlay on 2025-2026At first when I was projecting the BTC bull run for this round ('25 - '26) I was expecting around 120k. Once we hit 120k it didn't feel like euphoria, not even close. Also, considering the RSI we are not over bought. I was expecting the RSI to hit 90 before this bull run was on the decline. I don't use fractals that much, but I did this for fun to see what could possibly happen. What I believe is pretty compelling is the 70k bottom of support. I do strongly feel that the last 69k bull run top will be the new support. Will we hit 450k with BTC this round? I do believe it's entirely possible.
Let me know your thoughts.

BTC - Drawing your own Heatmaps and Understanding how BTC MovesAs of late I’ve been noticing more and more YouTube videos of analysts referencing coinglass heatmaps as a means of understanding where liquidity is.
Coinglass - if you read the details and disclaimer - is a prediction based algorithm and is not true or accurate data.
In fact, exchanges have no enforcement that encourages them to disclose data such as stop loss locations, leverage ratios, or liquidation zones.
To draw your own liquidity heat map, I demonstrate here how you can do that.
1) Determine the candle sets that move straight up or down - without price reclaiming that area.
2) Draw a box extending out from that section. Respectively these will be buy orders or sell orders.
3) Unlike limit orders for buys and sells, stop losses are extremely important - as they are limit orders that don’t automatically fill if price is at a premium or discount. They only fill if price crosses the exact price, setting off the order.
4) Use your liquidation boxes to determine where these hidden limit orders are in the chart. As we see currently, there is a mass of leveraged sell limit orders (long stop losses) stacked with little to no gaps in between them.
From here, we can understand how Bitcoin moves.
1) The majority of the market cap is leveraging liquidity. Liquidity used by traders leveraging their longs or shorts.
2) These orders leave above (or below) stop loss orders or liquidation prices, that act in the opposite way of traders direction. For example if a trader longs with $100 using 100x, he is leaving underneath his entry a sell order for the entire position size, or $10,000.
3) These stop loss orders trigger a natural chain reaction that fill, one into the next, causing the price to move fluidly as it triggers off the order block areas.
Since Bitcoin has been moving steadily up, sideways, up, sideways - for such a long period, we can deduce that there is a massive chain reaction of sell orders which will allow the price to drop aggressively and fluidly, without any active sell orders being placed by traders.
Traders looking at coinglass or other similar platforms, and stating there is a mass of short liquidity in the chart - are entirely wrong. Zooming out, we can see an overwhelming offset to the long positions left intact in the chart.
The bottom of the price drop will be the end of these stop loss orders. From there, price will leave a quick and quickly start returning to the higher levels.
Hope you found this helpful.