Bitcoin Daily Analysis – The Trend Is Our FriendGood morning, Guys,
I’ve prepared a fresh Bitcoin analysis for you.
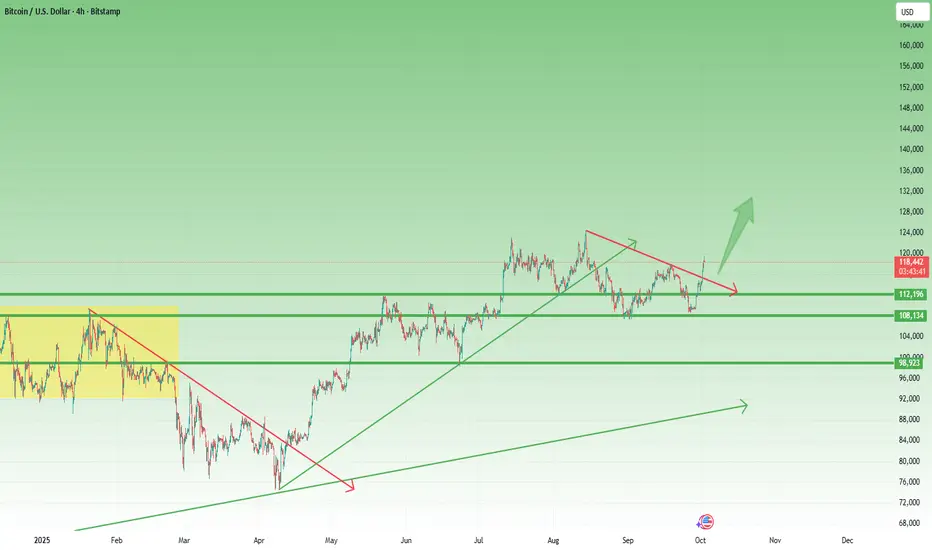
🔹 First off, I stand firmly behind my long-term targets of **127,000 – 137,000 – 146,000**. I previously shared these levels with you in a weekly analysis.
🔍 Now let’s shift to the 1-day chart:
What is Bitcoin telling us right now?
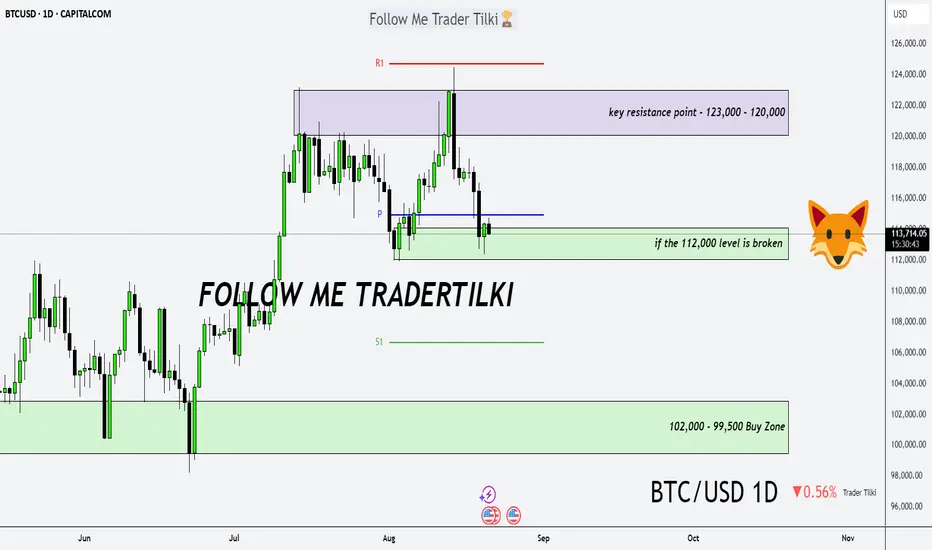
📉 If the **112,000 level breaks downward**, we could enter a correction phase toward **102,000** or even **99,500**. I expect strong buying interest to return from those zones.
📈 After that, we’re facing a key resistance structure between **123,000 – 120,000**.
But I believe this zone will also be broken—because we’re in an **uptrend**, and…
💬 **The trend is our friend. Never forget that.**
BTCUSD.PI trade ideas
BTCUSD: Watching for Exhaustion at the HighsHello everyone, here is my breakdown of the current Bitcoin setup.
Market Analysis
From a broader perspective, the price action for Bitcoin has been extremely volatile, with multiple failed breakdowns and breakouts. After a complex struggle, the most recent significant event was a powerful breakout above the 116800 level, followed by a successful retest, which confirmed the shift in control to buyers.
Currently, following that breakout, the price has entered a high-momentum rally. This upward impulse is strong but is becoming technically extended, which often increases the probability of a sharp corrective pullback as buyers begin to take profits.
My Scenario & Strategy
My scenario is a tactical short, aiming to capture this likely corrective move. After such a strong, impulsive rally, a pullback to test the original breakout level is a very common and healthy market dynamic. I'm anticipating that the price will make one last small push to a new high, where it will likely fail to find new buyers.
Therefore, the strategy is to watch for this exhaustion at the highs. A confirmed reversal would validate the short scenario. The primary target for this corrective move is the 116800 level, which aligns with the key Support zone.
That's the setup I'm tracking. Thank you for your attention, and always manage your risk.

BTC Daily Timeframe – Technical & Fundamental AnalysisBTC Daily Timeframe – Technical & Fundamental Analysis
Fundamentals:
In October 2025, the U.S. SEC is expected to decide on multiple crypto ETF proposals, making this month a potential turning point for institutional adoption. Market participants are anticipating the launch of spot crypto ETPs, which could bring in significant inflows.
The SEC also unveiled plans to revamp crypto regulations, aiming to ease compliance burdens for digital asset firms and provide clearer broker-dealer guidelines. Reduced regulatory uncertainty could attract more institutional participation.
Historically, Q4 has been one of Bitcoin’s strongest performance periods, providing a seasonal tailwind that may support further upside if macroeconomic conditions remain favorable.
Technicals:
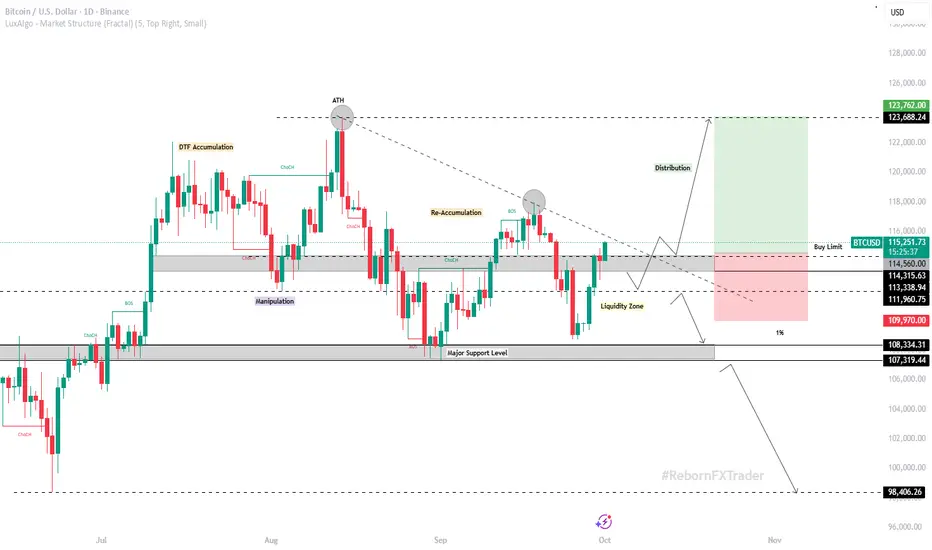
BTC recently created a new all-time high at 123,700 before breaking below its previous higher low. Price retraced down to the major key support at 108,100 before bouncing back.
Following the bounce, price formed lower highs, suggesting a re-accumulation phase before liquidity hunting. Liquidity has already been tested twice, and price has since broken above the minor key level at 113,400. BTC is now consolidating above the minor key area, indicating a bullish bias as long as the level holds.
📌 Trading Plan (DTF Bias – Bullish):
Point of Interest (POI / Buy Limit): 114,560
Stop Loss (SL): 109,970 (below liquidity zone)
Take Profit (TP): 123,762 (previous ATH)
📌 Disclaimer: This is not financial advice. Always wait for proper confirmation before executing trades. Manage your risk wisely and trade what you see—not what you feel.
ANFIBO | BTCUSD Analysis – Weekly Trading PlanHi guys! It's me, Anfibo. My plan last week gave us a good profit selling from 118,000 USD to 115,000 USD.
And over the past weekend, BITSTAMP:BTCUSD consolidated in a sideways range, consistently holding above key support. However, with the opening of the new week’s Daily candle, the market decisively broke down through this support zone, signaling that selling pressure is now taking clearer control.
From a technical perspective, the next critical support levels to monitor are:
• $113,000
• $111,000
• $109,500
Around the $110,000 region, I view this as a pivotal area to consider initiating spot entries or building larger long-term positions. This zone is not only a technically strong support level but also carries significant psychological weight for institutional and large-scale flows.
Imo, in the short term, BTC may still attempt a retest of the $115,000 level before resuming its downward trend, depending on lower-timeframe reactions. This creates an opportunity for traders to capitalize on corrective moves.
>>> My Trading Plan for the Week:
(1) SELL SCALP:
– ENTRY: around 115,000
– SL: 117,000
– TP1: 113,000
– TP2: 110,000
(2) BUY SETUP:
- ENTRY: 109,000 - 111,000
- SL: 107,000
- TP1: 117,500
- TP2: 122,000
- TP3: 128,000
This strategy is designed for short-term trades, taking advantage of volatility within the current range. For long-term investors, patience will be key—waiting for BTC to approach $110,000 or lower provides a strategic opportunity to restructure portfolios and scale into positions at more favorable prices.
👉 Conclusion: BITSTAMP:BTCUSD has broken out of its weekend consolidation and is now entering a fresh leg down. Short-term traders should look to sell corrective bounces, while long-term investors should focus on accumulation opportunities near $110,000 - a level that could serve as a “strategic entry” for the upcoming cycle.
WISH EVERYONE A NEW WEEK FULL OF ENERGY! ;)

BTC at a Critical Juncture Bulls Defending major zoneBitcoin has converted a key supply zone into a strong demand zone. All eyes are now on this critical level as price action tests this make-or-break support.
BTC is holding above the key demand zone at $106,269 - $108,715. This is the bull market's defensive line. A strong bounce here keeps the primary uptrend intact, with eyes first on $124,517 and ultimately the $135,627 - $139,616 target zone.
However, the recent rejection from the $117k supply zone shows sellers are present. A decisive break below this demand support would signal weakness, likely triggering a move down toward $98,384.
The next major leg will be decided at the current zone.
Bulls need to hold this ground to fuel the next rally toward $140K.
Are you buying the dip in this zone, or waiting for a breakdown to confirm a deeper correction?
Drop your prediction in the comments "Bullish bounce or bearish breakdown"?

BTCUSDBTCUSD
- Break of Structure
- Fair Value Gap
- Double Bottom as an corrective pattern in Short Time Frame
- Resistance Level
- Order Block

October 2 Bitcoin Bybit chart analysisHello
It's a Bitcoin Guide.
If you "follow"
You can receive real-time movement paths and comment notifications on major sections.
If my analysis was helpful,
Please click the booster button at the bottom.
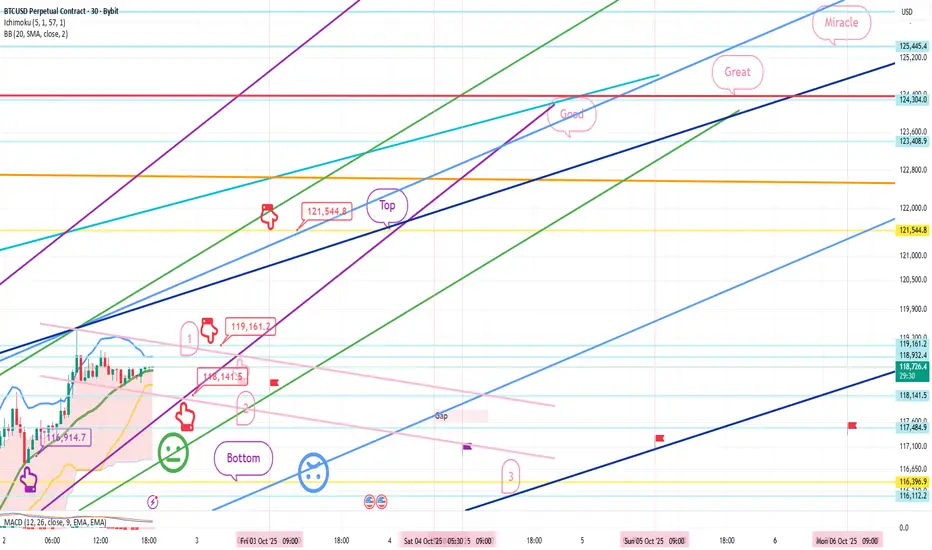
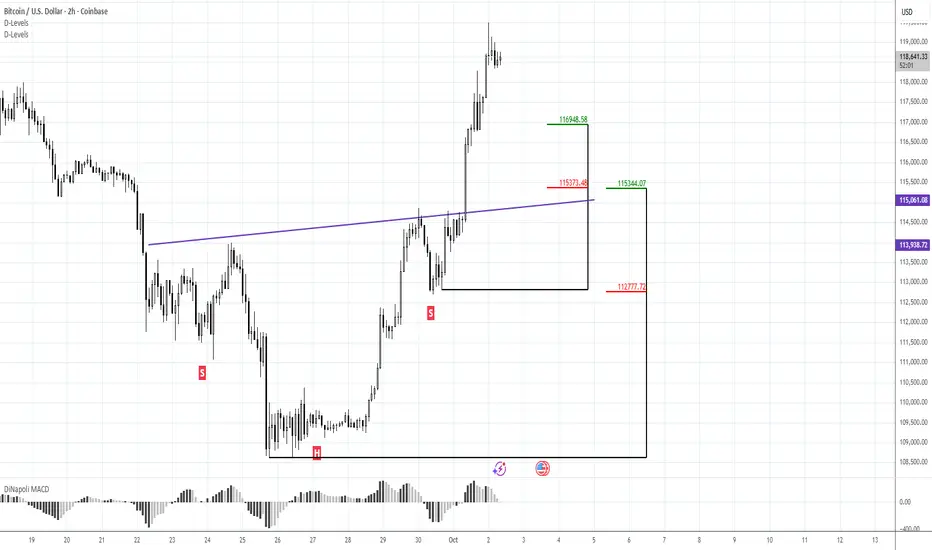
This is a 30-minute Bitcoin chart.
The bottom left shows yesterday's long position re-entry point, $116,914.7, indicated by a purple finger.
We will continue with the trend-following strategy.
*Red finger movement path:
Long position strategy
1. $118,668.2 long position entry point / Stop loss price if the green support line is broken
2. $119,161.2 long position primary target -> Target prices in order from the top to the miracle level
If the strategy is successful, the first section is the long position re-entry point,
and a new high is reached after the great breakout.
The second section is the final long position entry point.
If the green support line is maintained until the second section,
it will become an upward sideways market.
If the light blue support line holds through the weekend and next week,
it could continue to rise as it's a mid-term uptrend line.
Please keep this in mind.
Bottom -> I've left up to three sections.
You can check the prices of the major support and resistance lines above and below the section I've left or by dragging.
Please use my analysis as a reference only.
I hope you operate safely, with a principled trading strategy and stop-loss orders in place.
Have a nice holiday until next Friday.
I'll be back on Friday.
Thank you.
Next Upside BTC target is 126-127.30K. Beware of OverboughtMorning folks,
So BTC not has just formed big H&S but already completed it. But it is not a reason for upset. We consider 126-127.30K as the next upside target, based on weekly butterfly scenario .
Still, due to very fast action market hits overbought on daily chart. We prefer to wait for tactical pullback, somewhere to 117K or or even 115.3K support levels before thinking about long entry.
I mark this idea as" bearish" because of retracement expectations, but overall context is bullish of course...
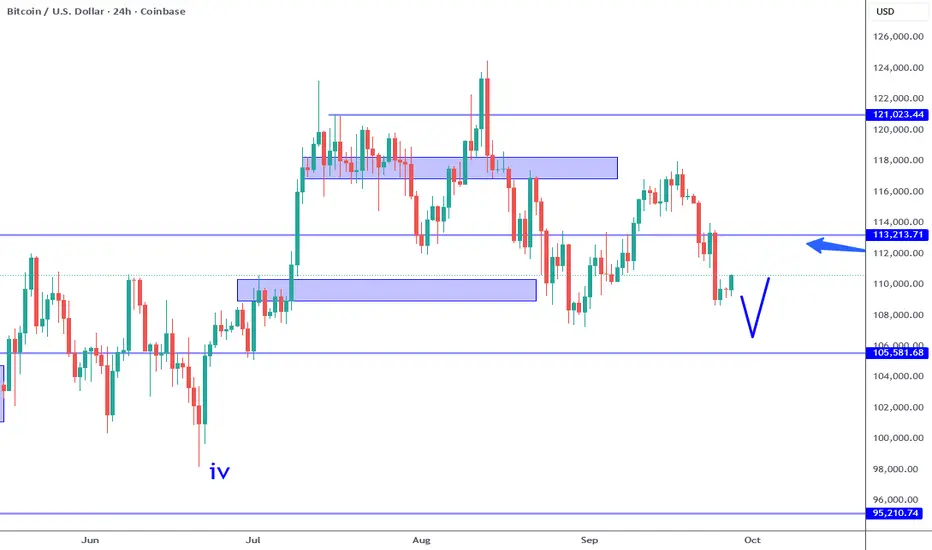
Bitcoin: Higher Probability At Range Levels.Bitcoin range is defined by the blue rectangles on this chart. Range low is around the 105 to 108K area and the range high is around the 115 to 118K areas. The 113K area happens to be near the midpoint of this range which means price action here is MOST random. Over the previous week, I pointed out the 113K potential support, and during the week there was a test followed by a bullish engulfing candle. I characterized this as a long, yet now we see that Bitcoin had alternate ideas. There is NO way to forecast price action, the best we can do is come up with reference points and then evaluate the price action that appears.
While the bearish rejection of the 113K area looks very negative, it is meaningless over the bigger picture. The broader trend has not changed, it is generally bullish and the shorter term trend is consolidating (likely the broader wave 4). Keep in mind, historical price action offers a way to gauge risk, strength, weakness BUT does NOT offer any way to accurately forecast the future. Like poker, this is a game of INCOMPLETE information and in order to navigate effectively we MUST adjust as the market provides new pieces of the puzzle.
As of now, here are the levels I am watching: range support 105K, 108K, range resistance 118K, 121K. It is all about how price action behaves IF it reaches one of these areas. Since I do not short on this time frame, that limits me to looking for bullish reversal at these support levels, otherwise there is not much else to do. IF the resistance is reached, even if sell signals occur on this time frame, if I was planning to short, I would be extra selective since there is still a greater chance of a bullish breakout based on the price structure.
The illustration on the chart shows one potential scenario which I believe has a greater probability. IF adverse catalysts occur, then it can completely negate this idea even with confirmation present. The predefined RISK and position sizing aspect is key when it comes to navigating this market optimally. There are many ways to define these variables, one that I use is the Trade Scanner Pro which utilizes the ATR to define risk, etc. Position sizing is another story, but beyond the scope of this article.
Range bound markets are hard to trade if you are too focused on the small picture. You can obtain higher probability outcomes simply by waiting for price areas that carry much more meaning historically. By preparing in advance, you can anticipate price behavior rather than react to price spikes or internet hype. For Bitcoin, it is simply about WAITING for the range support/resistance and confirmation patterns with structured risk management.
Thank you for considering my analysis and perspective.
BTC vs USD: Macro Liquidity vs TechnicalsBitcoin is at a hinge point.
Technical View: Weekly volume profile looks bearish, but if BTC closes above 119,465.52 the setup flips into an explosive breakout.
Macro View: The dollar is boxed (96.7–98.3) and fiscal stress + Fed cut bets are weighing on USD. Gold is at record highs on safe-haven demand. In this environment, macro liquidity can override technical ceilings.
That’s why I’ve stepped back to scalping until the macro picture stabilizes. The market is running on liquidity hunts, not clean structure.
🔑 Levels to Watch
BTC: Weekly close >119,465.52 → ignition higher
DXY: Breakout from 96.7–98.3 range decides cross-asset direction
When macros dominate, technicals bend. Patience and risk control matter more than chart perfection here.

This month Will Define This Entire Crypto Cycle🎯 October Just Started — And It Might Define This Entire Crypto Cycle 📈
Happy October, everyone — a month with a powerful pattern.
If history repeats, this could be a defining moment:
2017 saw a 5x BTC rally in 60 days,
2021 delivered a 2.5x in just 45 days.
Now it’s 2025 , and we’re watching the charts line up once again. 🔁
We’ve been long Bitcoin since two days ago, right off the support at the bottom of the channel — a level we’ve tracked since March 14, 2023 .
That same chart gave us:
42K (hit summer 2023)
46K (initial rejection, later support)
And now, we’re targeting 127,370 → 138K–140K as part of the final macro wave. 🚀
Ethereum is showing strength too. From a solid buy zone near 4,000 , I still believe the next key levels are 6,443 and 10,364 .
Altcoins? Let’s talk dominance:
Bitcoin Dominance is still high (~58%) but could drop toward 56.91 — giving room for alts to breathe.
Ethereum Dominance remains in a clear descending channel, with a clean target of 18.29% dominance.
📊 We’ve revisited Ethereum vs. BTC charts, and I remain long ETH here with a 0.06 BTC target.
Other setups:
Solana support at 204.81 , targets 240 and 276 .
XRP ? I remain cautious — still preferring ETH over XRP based on recent cycles.
Total Market Cap still shows bullish structure, aiming for 4.8T and later 6.5T .
We’ve seen the October pattern repeat across cycles. While the exact altcoin winners change (XLM & XRP in 2017, ETH in 2021), the macro truth remains:
Bitcoin tends to lead — and October tends to explode.🔥
Thought of the Day 💡
“Cycles evolve, but the rhythm remains. Each October is a chance — not a promise. But charts give us a map, and right now, the map points up.”
Disclaimer
I share market views for educational and entertainment purposes only. This is not financial advice. I am not a licensed advisor. Trade at your own risk and always manage your capital responsibly.
One Love,
The FXPROFESSOR 💙
ps. it's a video..watch it and let me know your thoughts

$BTC anatomy of a steady trendConstructive price action within a steady uptrend since beginning of Jan 2023

Cryptocurrency : The New Normal & The World of Leverage Trading.📌 Cryptocurrency: The New Normal & The World of Leverage Trading ⚔️ ( A Sweet Killer! )
🌍 Why Are Traders Shifting to Crypto? COINBASE:BTCUSD BITSTAMP:ETHUSD COINBASE:SOLUSD
✔️ Lower capital required compared to stocks
✔️ Fewer gaps (24/7 market = no overnight gap-up/down shockers)
✔️ High leverage opportunities (control bigger trades with smaller margin)
✔️ Global accessibility (Binance, Bybit, OKX, CoinDCX, Mudrex etc.)
📊 Types of Trading in Crypto
💠 **Spot Trading** → In India, 30% tax on capital gains ( check according to your country ).
💠 **Options & Futures** → Taxed as *Business Income* ( like F&O in stocks ). No flat % rule.
⚡ What is Leverage?
👉 Leverage means using *small capital* to control a *large trade size* , because the exchange lends you money.
Think of it like **margin trading** in stocks — but much more aggressive.
🔹 Example 1 : Normal Trade style ( No Leverage )
suppose you have 💰 Capital = $10,000
Bought BTC at Price = $10,000,000
* You can buy 0.001 BTC ( 10000 ➗ 10,000,000 ).
* If BTC rises 10% → Profit = $1,000 (+10%)
* If BTC falls 10% → Loss = $1,000 (-10%)
👉 Risk & reward move in proportion to your capital.
🔹 Example 2 : Leverage Trade style ( 10x Leverage )
suppose you have 💰 Capital = $10,000
opted Leverage = 10x
New Trade Size ( margin ) = $1,00,000 ( you can now utilize this margin amount for trading )
* You can buy 0.01 BTC ( 10000 ➗ 10,000,000 ).
* If BTC rises 10% → Profit = $10,000 (+100% return)
* If BTC falls 10% → Loss = FULL $10,000 ( Liquidation 🚨 )
👉 A 10% move = your account will be blown.
🔹 Example 3:
suppose you have 💰 Capital = $10,000
opted Leverage = 50x (Extreme ⚠️)
New Trade Size ( margin ) = $5,00,000 ( you can now utilize this margin amount for trading )
* You can buy 0.05 BTC ( 50000 ➗ 10,000,000 ).
* If BTC rises just 2% → Profit = $10,000 (+100% return)
* If BTC falls just 2% → FULL $10,000 loss ( Liquidation 🚨 )
* If BTC rises just 10% → Profit = $50,000 (+500% return)
* If BTC falls just 10% → FULL $10,000 loss ( Liquidation 🚨 )
👉 Tiny moves in high volatile asset class = jackpot or wipeout/blown.
⚔️ Key Takeaways :
1️⃣ Leverage multiplies profits 💸 but also multiplies losses too💀 ( a sweet killer! )
2️⃣ Crypto is *highly volatile* (10–20% daily moves are common) → High leverage is extremely risky, if not managed well.
3️⃣ Beginners should **never use more than 2x–3x leverage**
👉 In simple words: **Leverage is a double-edged sword ⚔️**
Used wisely → You’re a king 👑
Used recklessly → You’re broke 🥀
---
🚘 Liquidation Explained ( ex: Car Analogy )
Imagine you pay $10,000 ( as a security ) to rent a car worth $1,00,000. (That’s 10x leverage).
* The car is in your hands, but $90,000 still belongs to the owner of car (exchange).
* If the damage goes beyond your $10,000 margin → the owner takes back the car immediately.
👉 That’s liquidation: when your loss = your margin.
🔹 Case 1: Normal Trade style ( No Leverage )
Margin = $10,000 → Buy BTC.
If BTC drops 10% → Loss = $1,000.
You still have $9,000 left.
✅ No liquidation. Just a normal loss.
🔹 Case 2: 10x Leverage Trade style
Margin = $10,000
New Trade Size ( margin ) = $1,00,000
* BTC rises 10% → Profit = $10,000 (+100%)
* BTC falls 10% → Margin wiped = Liquidation 🚨
🔹 Case 3: 20x Leverage Trade style
Margin = $10,000
New Trade Size = $2,00,000 ( margin )
* BTC rises 5% → Profit = $10,000 (+100% return)
* BTC falls 5% → Margin wiped = Liquidation 🚨
👉 Just 5% against you = Account gone.
🔹 Case 4: 50x Leverage Trade style (High-Risk Zone ⚠️)
Margin = $10,000
New Trade Size = $5,00,000 ( margin )
* BTC rises 2% → Profit = $10,000 (+100% return)
* BTC falls 2% → FULL $10,000 loss = Liquidation 🚨
👉 Just 2% against you = Blown account = Game over.
🎯 Final Word
Leverage = Power ⚡
But in crypto’s volatile world, it’s also a **trap for the impatient**.
* Liquidation is directly proportionate to Leverage.
* Smart traders use small leverage.
* Impulsive traders burn out with high leverage.
💬 Question for you: What’s the **highest leverage** you’ve ever used in a trade? Drop it below 👇 (Be honest—we’ve all been tempted!)
If this Idea gave you a value information then please, Boost it, share your thoughts in comments, and follow for more practical trading!
Happy Trading & Investing!
@TradeWithKeshhav and team

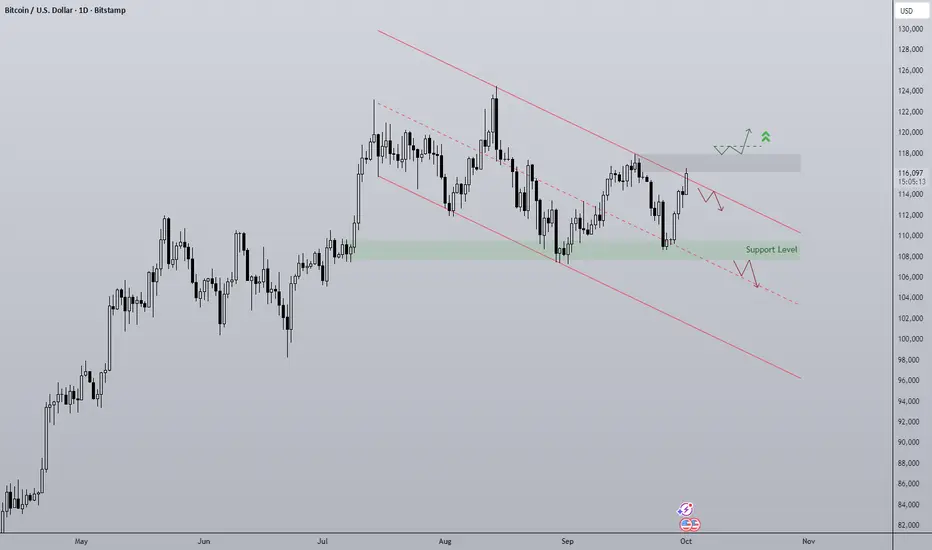
Bitcoin in Q4 As "Uptober" begins the layout for Bitcoin is as follows:
- Downtrend on the daily officially since 18th September but really it began after the SFP of ATH on August 14th.
- The origin of the rally to ATH has served as support twice since at $108,000
- Diagonal trendline resistance being tested as Q4 begins, seasonality shows October is very strong for returns, 21.89% average since 2019.
- Compression of the range inevitably leads to a breakout in either direction.
Bullish scenario is reclaim of $117,500 to push towards ATH.
Bearish scenario is a loss of $108,000
BTC/USD Analysis: Bullish Continuation in FocusBitcoin continues to demonstrate strength following its recent recovery. After periods of consolidation and controlled retracement, the market shows clear signs of accumulation, with buyers maintaining momentum. Each upward leg has been supported by liquidity absorption, reflecting steady confidence in higher valuations.
The current structure suggests that even if retracements occur, they are likely to serve as a foundation for further expansion. Market behavior highlights resilience, with the broader trend still pointing toward bullish continuation. Bitcoin remains positioned for progressive growth, with sentiment and structure both aligning in favor of buyers.

BITCOIN USD UPDATE🚀 “117,998.17” — We Hit the Trigger
We pierced a massive rally threshold today (117,998.17) — a short squeeze or momentum flush — yet dollar and gold remain locked in ranges. That dissonance tells you this is a liquidity-game market, not a clean trend.
We’re still trading in what I’d call an overpriced arena — volatility amplified, direction masked. Price action will mislead until a big macro break comes.
The dollar remains boxed: Value Area High ~98.322 / Low ~96.747. Gold, meantime, is ripping higher under safe-haven flows, hitting record highs amid shutdown fears and rate cut bets.
Meanwhile, bitcoin is getting a bullish tailwind. Whale accumulation, institutional demand, and macro narratives favoring digital gold are pushing sentiment.
Macro catalysts (Fed, U.S. jobs, fiscal politics) could fuel either direction — but the setup is leaning toward asymmetric upside in risk assets if USD weakens.
LOOK OUT:
Liquidity hunts likely before clarity — expect fake-outs.
Dollar must break its box for cross-pairs and cryptos to trend.
Bitcoin is better aligned with the upside in this regime than dollar or gold.

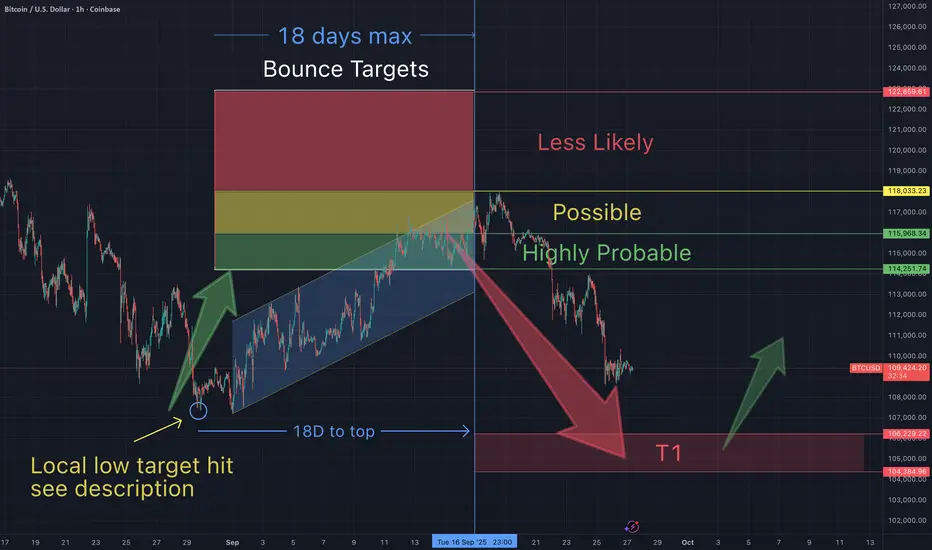
You will ask yourself, "how did he know Btc would do that"?On Aug 9th, I suggested Btc would bottom as low as 107,700, before a bounce.
On Sept 9th I suggested Btc had bottomed at my target, and would bounce to between $114K-118K (within 18 days)...the form a lower low. Day 19 began this current retrace.
Each of these predictions have come true with the exception of the lower low (below $107K). So congratulations to everyone who have been making gains based on my everything I have been charting.
The question remains, will the "3 red week down rule" and my statistical analysis of it's historical price action continue to play out? So far it looks that way. If so, there's another bounce incoming at my red T1.
PS I don't point out my accuracy to brag, but moreso I want to accomplish 2 things.
1-Prove that TA works - for all those non believers (and I encourage you to learn).
2-Keep track of my accuracy stats (and so should you...how else would we know who we should follow).
BITCOIN Did the 1W MA20 just save the day??On one of our recent analyses we talked about the importance of the 1W MA20 (red trend-line) for Bitcoin (BTCUSD) and the continuation of its non-stop bullish trend since the April 07 2025 Low.
As mentioned then, BTC was likely to extend the trend as long as the 1W candles keep closing above the 1W MA20. The three times a candle didn't, since June 2023, the price declined more to hit (or come very close to) the 1W MA50 (blue trend-line).
Last week was again a successful 1W candle close above the 1W MA50, third time in a month (since August 25) to do so. Technically that solidifies it as a Support and as long as it holds, Bitcoin has more probabilities to repeat at least a +96.38% rally ('weakest' rally it had on this Bull Cycle) and test $145000.
So do you think the 1W MA50 just saved the day and a new rally is ahead of us? Feel free to let us know in the comments section below!
-------------------------------------------------------------------------------
** Please LIKE 👍, FOLLOW ✅, SHARE 🙌 and COMMENT ✍ if you enjoy this idea! Also share your ideas and charts in the comments section below! This is best way to keep it relevant, support us, keep the content here free and allow the idea to reach as many people as possible. **
-------------------------------------------------------------------------------
💸💸💸💸💸💸
👇 👇 👇 👇 👇 👇

September 29 Bitcoin Bybit chart analysisHello
It's a Bitcoin Guide.
If you "follow"
You can receive real-time movement paths and comment notifications on major sections.
If my analysis was helpful,
Please click the booster button at the bottom.
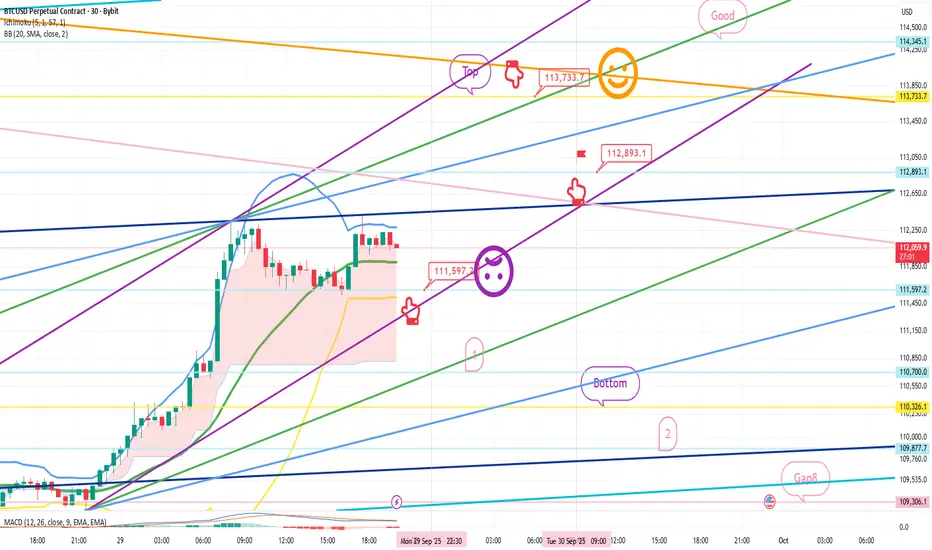
This is a Bitcoin 30-minute chart.
There are no Nasdaq indicators released today.
I developed a strategy based on the rising pattern.
*Red finger movement path:
One-way long position strategy
1. $111,597.2 long position entry point / Stop loss if the purple support line is broken
2. $113,733.7 long position first target -> Good second target
If the strategy is successful, the 112,8K level indicated
can be used as a long position re-entry point.
Up to the first section below, the price is moving sideways to the right.
From the bottom section touch, there's a high probability of a decline to the Gap 8 retracement level.
Please check the bottom support line and section 2 indicated below.
Up to this point,
I ask that you use my analysis for reference only.
I hope you operate safely, with a focus on principled trading and stop-loss orders.
Thank you.
BTCUSD NEXT POSSIBLE MOVE BTC is currently holding strong above key support zones, showing bullish momentum building up. If the market continues to respect this structure, a possible upward move can be expected. A breakout above the resistance could trigger fresh buying pressure, opening the way for higher levels. Overall, price action is suggesting that buyers are still in control, and any sustained strength could lead BTC toward new highs in the coming sessions.

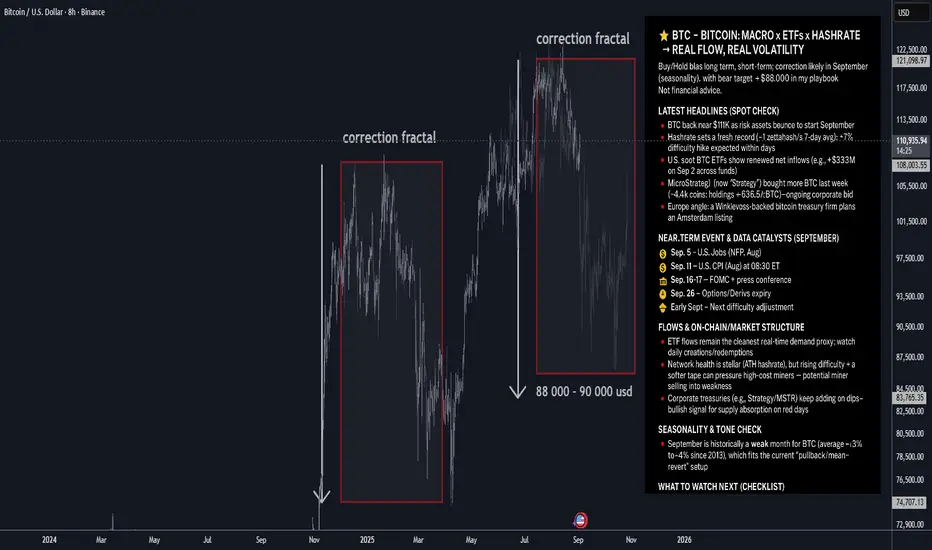
BTC — Bitcoin: Macro x ETFs x Hashrate → Real Flow, Real Volatil⭐️ BTC — Bitcoin: Macro x ETFs x Hashrate → Real Flow, Real Volatility
Buy/Hold bias long term; short-term: correction likely in September (seasonality), with bear target ≈ $88,000 in my playbook.
🔥 Latest headlines (spot check)
🔸BTC back near $111K as risk assets bounce to start September.
🔸Hashrate sets a fresh record (~1 zettahash/s 7-day avg); a >7% difficulty hike is expected within days. Network is the strongest ever, but miner margins tighten.
🔸U.S. spot BTC ETFs show renewed net inflows (e.g., +$333M on Sep 2 across funds). Flows remain a key daily demand gauge.
🔸MicroStrategy (now “Strategy”) bought more BTC last week (~4,4k coins; holdings ≈ 636.5k BTC)—ongoing corporate bid.
🔸Europe angle: a Winklevoss-backed bitcoin treasury firm plans an Amsterdam listing, signaling appetite for listed BTC exposure in the EU.
🗓 Near-term event & data catalysts (September)
🔸Fri, Sep 5 — U.S. Jobs (NFP, Aug) at 08:30 ET. Labor softness would bolster rate-cut odds and risk appetite; a beat could do the opposite.
🔸Wed, Sep 11 — U.S. CPI (Aug) at 08:30 ET. Inflation surprise drives real-rate expectations → BTC beta.
🔸Tue–Wed, Sep 16–17 — FOMC + press conference. Policy path & dot plot = macro volatility for BTC.
Fri, Sep 26 — Options/Derivs expiry:
• Deribit monthly BTC options expire 08:00 UTC (last Friday rule).
• CME Bitcoin monthly options settle Sep 26 as well.
These expiries often amplify gamma flows and spot-vol.
Early Sept — Next difficulty adjustment likely >7% up (tightens miner economics short-term).
Medium-dated overhang
Mt. Gox creditor deadline: Oct 31, 2025. Any schedule/details update could swing “supply overhang” narratives.
📈 Flows & on-chain/market structure
🔸ETF flows remain the cleanest real-time demand proxy; watch daily creations/redemptions. 🔸Sustained positives tend to align with spot strength; outsized outflows can weigh on price.
🔸Network health is stellar (ATH hashrate), but rising difficulty + a softer tape can pressure high-cost miners → potential miner selling into weakness.
🔸Corporate treasuries (e.g., Strategy/MSTR) keep adding on dips—bullish signal for supply absorption on red days.
🧠 Seasonality & tone check
September is historically a weak month for BTC (average ~−3% to −4% since 2013), which fits the current “pullback/mean-revert” setup.
📣 Social/flow buzz (signals, not noise)
🔸ETF flow posts (Farside, Bloomberg desks) are getting traction again—watch after U.S. close for prints.
🔸Saylor/Strategy buying headlines keep the “corporate bid” narrative front-and-center.
🧭 Levels & plan (author’s framework)
🔸Bias: Long-term constructive; near-term: correction mode likely extends through September (seasonality + event risk).
🔸Bear target: $88,000 (where I’d expect volatility to attract responsive buyers).
🔸Invalidation for bears (tactical): A strong reclaim/close above ~$113K–$115K with improving 🔸ETF inflows would weaken the pullback thesis.
🔸Sizing: Respect macro data days (NFP/CPI/Fed) and options expiry week—expect higher realized vol.
🗺 What to watch next (checklist)
🔸Daily U.S. spot BTC ETF flows (post-close updates). Momentum if creations persist; caution on redemptions clusters.
🔸Sep 5 — NFP (Aug) 08:30 ET. Risk-on if soft; risk-off if hot.
🔸Sep 11 — CPI (Aug) 08:30 ET. Headline/core surprises steer the FOMC tone.
🔸Sep 16–17 — FOMC + presser. Watch guidance on cuts, balance sheet, and growth.
🔸Sep 26 — Deribit & CME monthly expiries. Positioning/“max pain” dynamics into that Friday.
Difficulty adjustment (early Sept). If >7% up as projected, monitor miner behavior/sell pressure.
Bitcoin hr Bearish Cycle Ready To Kick in. Watch out Bulls a drop is around the corner, 1hr Bearish Cycle is once again setting up for the weekend.
Early bears that enter with liquidation point below $125165 will be Rekt there is where we short....short....short with lov lev.
Time to build up a short position.
Next 1hr tf drop is just a regular retrace within a Daily Bullish Cycle .
Buckle up ladies and gentlemen and get ready for another wild ride.
Play it right, play it safe and know the rules of the game.

Bitcoin: Third Time’s a Charm at 120k?Two days ago, in my last BTC analysis, I mentioned that bulls had to defend 112k at all costs. Losing it would have opened the gates toward 100k.
Fortunately for the bullish camp, the defense worked. Bitcoin didn’t just hold the line—it pushed higher and broke through the 115k resistance, which had been reinforced by a falling trendline.
Now, with price trading around 118,600, the market is once again staring at the critical 120k barrier.
________________________________________
Why 120k Is So Important
• BTC has already tested this level twice this year, only to be rejected both times.
• Each failure sparked corrections, making 120k not just a number but a milestone for sentiment and structure.
• If bulls can finally conquer and hold above it, the door to new all-time highs swings open.
________________________________________
Technical Structure
• 108k: A solid support.
• 112k: The battleground of the past few months—resistance, support, resistance, etc is now reconquered.
• Trendline Break: The falling trendline gave way, giving bulls the momentum they needed.
The chart is building constructively, with strong supports.
________________________________________
Third Time’s a Charm?
Markets don’t often give three chances at the same key level. The third test usually decides the story.
My stance: buy dips. As long as 112k remains intact, I expect BTC to break 120k and head toward a new ATH.
So, will 120k finally fall on the third attempt? My conviction is stronger than before. 🚀