Bitcoin hr Bearish Cycle Ready To Kick in. Watch out Bulls a drop is around the corner, 1hr Bearish Cycle is once again setting up for the weekend.
Early bears that enter with liquidation point below $125165 will be Rekt there is where we short....short....short with lov lev.
Time to build up a short position.
Next 1hr tf drop is just a regular retrace within a Daily Bullish Cycle .
Buckle up ladies and gentlemen and get ready for another wild ride.
Play it right, play it safe and know the rules of the game.
BTCUSD.PI trade ideas

Bitcoin: Third Time’s a Charm at 120k?Two days ago, in my last BTC analysis, I mentioned that bulls had to defend 112k at all costs. Losing it would have opened the gates toward 100k.
Fortunately for the bullish camp, the defense worked. Bitcoin didn’t just hold the line—it pushed higher and broke through the 115k resistance, which had been reinforced by a falling trendline.
Now, with price trading around 118,600, the market is once again staring at the critical 120k barrier.
________________________________________
Why 120k Is So Important
• BTC has already tested this level twice this year, only to be rejected both times.
• Each failure sparked corrections, making 120k not just a number but a milestone for sentiment and structure.
• If bulls can finally conquer and hold above it, the door to new all-time highs swings open.
________________________________________
Technical Structure
• 108k: A solid support.
• 112k: The battleground of the past few months—resistance, support, resistance, etc is now reconquered.
• Trendline Break: The falling trendline gave way, giving bulls the momentum they needed.
The chart is building constructively, with strong supports.
________________________________________
Third Time’s a Charm?
Markets don’t often give three chances at the same key level. The third test usually decides the story.
My stance: buy dips. As long as 112k remains intact, I expect BTC to break 120k and head toward a new ATH.
So, will 120k finally fall on the third attempt? My conviction is stronger than before. 🚀
BTCUSD NEXT POSSIBLE MOVE BTC is currently holding strong above key support zones, showing bullish momentum building up. If the market continues to respect this structure, a possible upward move can be expected. A breakout above the resistance could trigger fresh buying pressure, opening the way for higher levels. Overall, price action is suggesting that buyers are still in control, and any sustained strength could lead BTC toward new highs in the coming sessions.

ETH ShortAs always these are leveraged trades so if direction changes on the 4hr look to exit. Another SFP Setting up on 12HR. Just like BTC most likely we take previous lows on 12 hour before the real breakout.

BITCOIN HIGH PROBABILITY SETUP SOON!!!🚨 BTCUSD HIGH PROBABILITY SELL SETUP 🚨
* Here We Can See Clearly The Next Potential Moves For BTC Coming Hours/Days.
* Keep Your Eyes Close On Your Trading Positions.
* Happy PIP Hunting Traders.
FXKILLA.

BTC longs till ATHLast few posts haven't been the most accurate however all the longs were executed on SPOT and not leverage so the trades were still profitable none the less. Im seeing another opportunity to go for bitcoin longs here until ATH. This trade will be taken on leverage instead of SPOT due to the over extended nature of price.

BTC 4H UpdateIn the last chart, we projected four upside targets:
TP1: $127,398
TP2: $130,077
TP3: $1302,845
TP4: $134,000 – $135,000
Price action has been moving in line with that projection and is now approaching the first key target (TP1).
If price breaks and holds above $126,000, continuation toward $130,000 (TP2) and higher levels remains the main scenario.
If rejection occurs at any of these zones, a pullback into local supports is likely before the next leg higher.
The reaction around TP1 will be decisive in confirming whether the path toward $135,000 remains intact.
This is not financial advice. Trade according to your own plan and risk management.

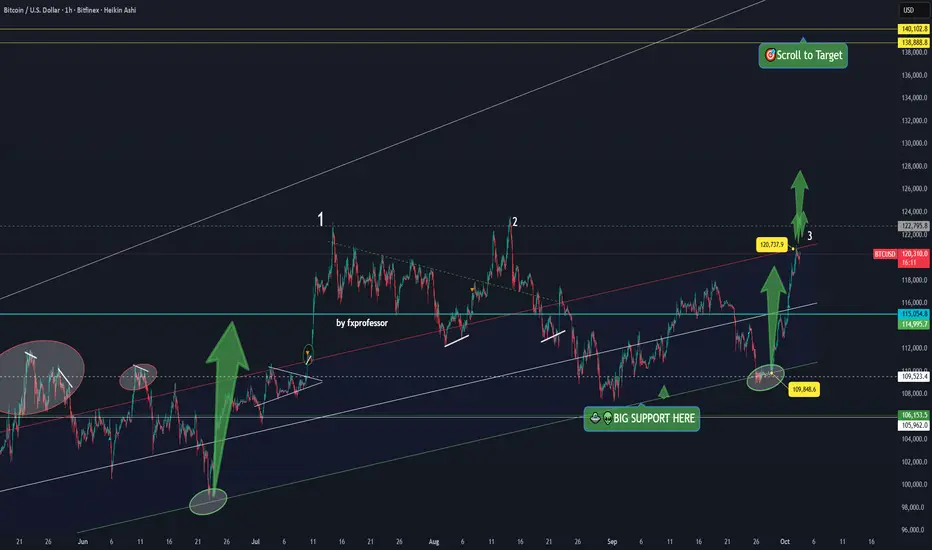
Bitcoin Friday Update: Third Attempt at Breakout📈🚀 Bitcoin Friday Update: Third Attempt at Breakout 🎯
Friday often brings momentum, and this one might not disappoint.
Yesterday, I highlighted the level at $120,737 — the very top of the move. And here we are again, pressing for the third attempt higher inside the same ascending channel I’ve been sharing with you for weeks.
🔑 Current Setup
Entry from the lower band near $110,000 has aged well.
We are now testing the upper red boundary around $120,800.
A clear break above opens the path to:
→ $122,000
→ $138,800 (main technical target)
⚖️ Long vs Short
Long bias remains valid as long as price holds inside the ascending channel.
A short attempt? Technically possible here, but risky .
→ If price breaks above the red resistance line, shorts will need to exit quickly.
Remember, manipulation faked out traders twice before around this zone. But this time it’s October, and cycle compression is on our side.
🌍 Macro Context
Rate hikes continue.
Gold and stock indices have already moved higher.
Bitcoin, historically lagging, may now have catch-up ground to cover.
This aligns with the broader cycle thesis — October is rarely quiet.
🕒 Weekend Outlook
✅ If Bitcoin breaks out → Expect altcoins to light up this weekend.
❌ If Bitcoin fails → Likely a slow, sideways weekend.
But my read? This weekend looks set to be exciting.
💡 Thought of the Day
“Did the Market take a pause for Bears to Load on Shorts?? Or is it Longs that get smashed next?” I think the First!
Trade wisely.
One Love,
The FXPROFESSOR 💙
Bitcoin To 103,792$ within 10 days - options king!As the title says, you can easily place options trades with my analysis, don't bet a lot though, small amounts for you to hedge your normal portfolio, but you can see great returns from it.
you can also place some 30+ day options for longer term outlooks such as BTC to 80K.
I am the person that has predicted every twist and turn of this market, and more financial meltdown is coming your way.
see my linked ideas for how we predicted the collapse of bitcoin from ATH and we expect further collapse.
You should see BTC at 40k within the next 8-9 months.

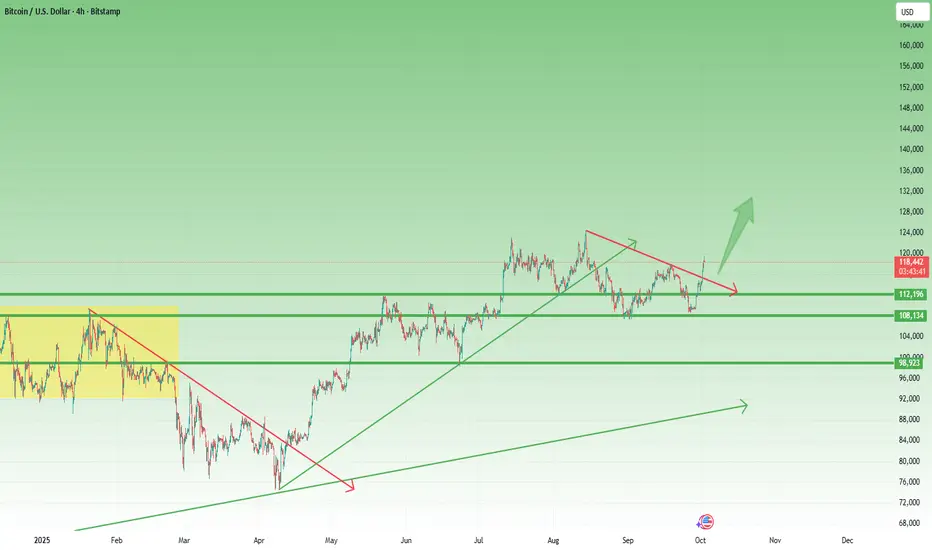
BTC Target $ 130.000Bitcoin has consolidated in a base region for a possible push to new highs, this consolidation could take it to prices in the $130,000 region.
Today considered a safe haven asset, with the sharp fall of the Dollar, it is gaining prominence, as is Gold in new flights.
Important regions marked may be key points for a new ATH as well as the structure that supports this movement
We have some Pullback regions that can be good triggers for long, remembering that there is a structure driving this price, breaking it we can have a stronger correction

BTC Digital Asset Amid #Bitcoin? $150,000 Target in Sight? BTC: Undervalued Digital Asset Amid #Bitcoin? $150,000 Target in Sight? 🚀
BTC at $111,000 (-1%), undervalued with growing adoption amid X buzz on wealth and upward moves—analysts project $125,000-$200,000 for 2025, average $150,000 implying 35% upside, pondering if institutional inflows drive surge. 📈
**Fundamental Analysis**
Market cap $2.21T with circulating supply 19.93M; undervalued as hedge against inflation with high ROI potential from ETF inflows and central bank interest, fundamentals bolstered by halving-reduced supply.
- **Positive:** Store of value appeal; institutional adoption rising.
- **Negative:** Volatility; regulatory uncertainties.
**SWOT Analysis**
**Strengths:** Limited supply scarcity; global liquidity.
**Weaknesses:** Energy consumption concerns; price swings.
**Opportunities:** ETF expansions; sovereign reserves.
**Threats:** Government bans; alternative cryptos.
**Technical Analysis**
Chart consolidating post-rally with building momentum. Price: $111,000, VWAP $110,500.
Key indicators:
- RSI: 55 (neutral with upside room).
- MACD: Positive crossover signal.
- Moving Averages: Above 50-day $100,000, 200-day $80,000 (bullish).
Support/Resistance: $100,000/$120,000. Patterns/Momentum: Bull flag targeting $150,000. 📈 Bullish | ⚠️ Bearish.
**Scenarios and Risk Management**
- **Bullish:** Sentiment rebound to $120,000; DCA on support tests for cost averaging.
- **Bearish:** Market correction drops to $100,000.
- **Neutral:** Ranges $110,000 on volume buildup.
Risk Tips: 1% risk per trade, stops at $100,000, diversify holdings, DCA to mitigate swings. ⚠️
**Conclusion/Outlook**
Bullish on regulatory tailwinds. Watch ETF flows. Fits #Bitcoin theme with adoption upside. Take? Comment!

AI forecast suggests consolidationAfter the big energetic move we just saw, the AI suggests the market needs to catch it's breath
Don't expect too much excitement over the next couple of days

BITCOIN - BULLISH MOVE!Hello Traders!
The Bitcoin failed to create a new lower low!
The price broke the resistance line!
So, I expect a bullish move🚀
______________
TARGET: 116830.00🎯

The Last Bitcoin Bear Trap Before Q4 2025Today, let’s face the reality: monthly candles are in distribution. But this is the last bear trap before October. Either take advantage of this opportunity or run away with paper hands. This dip will end very soon, as the Stoch RSI rebounds from the bottom and the RSI completes a hidden bullish divergence from the lows

Why Zcash pump signals the end of the cycle? Back testing Zcash pump for past 3 cycles indicates that every time the cycle topped, Zcash will do a late pump within 21 days at most.
Zcash did a 2x in 5 days since September 29. this indicates that the cycle top is very close (mid october)

Bitcoin is ready for a vertical move and a stealthy surgeToday, let's examine why our work in this cycle isn't over yet, and why we haven't seen the peak or the cycle top. Key on-chain indicators still haven’t recognized the top, and we need to wait for its vertical move to begin. Every dip is just the market’s final slope and represents a buying opportunity. We are ready for the final phase of the market in Q4

Report: Bitcoin (BTC / USD) — September 27, 20251) Asset Overview
Description: Bitcoin is the first decentralized cryptocurrency (launched January 2009, whitepaper by Satoshi Nakamoto). Proof-of-work protocol with UTXO model, primary uses: store of value and peer-to-peer medium of exchange.
Tokenomics: Max supply 21,000,000 BTC; circulating supply ~19,925,781 BTC (27/09/2025). Emission decreases via halvings (~every 4 years; last halving 2024). No native burning mechanism.
Governance & development: Open-source development (Bitcoin Core and related clients); protocol changes via community, miners and maintainers consensus.
2) Key On-chain Metrics & Economic Data
Price (snapshot 27/09/2025): ~$109,400 per BTC (spot average).
Market cap: ~$2.18T (approx).
Circulating supply: ~19.93M BTC.
Hashrate & security: Network hashrate at all-time highs (strong security and miner participation; varies with difficulty and price).
Active addresses / transactions: Daily active addresses and transactions remain elevated; moderate growth post-ETF adoption.
Average fees: Volatile — spikes during congestion; Lightning Network absorbs some micro-payments.
Value metrics: MVRV and SOPR indicate episodic profit realization during price swings; NVT remains relatively high versus alt-season.
Concentration: Significant holdings by early adopters and large addresses (“whales”); liquid supply limited relative to market cap.
Market liquidity: Deep liquidity on major exchanges (Coinbase, Binance, Kraken, Bitstamp, etc.) and derivatives markets; slippage increases for very large orders.
Sources: exchanges available in TradingView.
3) Price & Market Analysis (last 12 months)
12m performance: BTC exhibited wide volatility; current level ~$109k (snapshot date). Specific 12m highs/lows available from exchange feeds.
Volatility: Historically higher than traditional assets; recent volatility reduced relative to speculative peaks but still elevated vs. gold/equities.
Benchmarking: Partial correlation with S&P 500 and macro risk sentiment; generally correlated with ETH during rallies but retains market leadership.
Trading & volumes: High spot and derivatives volumes; occasional large liquidations during strong moves.
Primary venues: Widespread trading across centralized exchanges and OTC desks; growing influence from spot ETFs.
4) Technical Analysis (brief)
Trend (daily/weekly): Price action above many medium-term moving averages after rallies/mean reversion; key levels cited around $104k (support) and $112k (resistance).
Indicators: Daily/weekly RSI oscillates between neutral and bullish; MACD shows variable momentum. 50/200 MA crosses inform short/medium-term bias.
Suggested supports/resistances: Supports: $95k–$100k, $80k. Resistances: $112k–$120k, psychological $150k.
5) Fundamental & Network Analysis
Adoption & infrastructure: Growing institutional integration (ETFs, custody), extensive Lightning Network infrastructure. Adoption as a store of value and portfolio diversifier.
Competitors / substitution risk: Ethereum and other L1s provide smart contract functionality and DeFi; they do not directly replace BTC’s primary “digital gold” function but compete for investor capital.
Primary risks: Regulatory restrictions, market events (leveraged liquidations), supply concentration, exchange/custody operational risks; 51% attack is theoretically possible but costly given current hashrate.
Security & audits: Mature protocol with extensive open-source review; main risks are in layer-2s, custodial solutions and external smart contracts.
6) Outlook & Scenarios (1–3 years)
Conservative: Institutional adoption stable, moderate volatility, price range-bound $60k–$120k if macro conditions worsen.
Base: Gradual adoption via ETFs and payment rails; price target $120k–$200k over 2–3 years if institutional demand persists.
Optimistic: Strong institutional demand + restricted liquid supply + favorable macro → potential to exceed $200k within 1–3 years.
Key drivers: ETF/custody adoption, favorable regulation, macro (inflation/rates), layer-2 development, retail sentiment.
Risk mitigation: Diversification, secure custody (cold storage/multisig), position sizing and stop-loss, hedging with options/futures.
7) Conclusion & Recommendations
Risk/return profile: BTC is a high-volatility asset with medium-to-long-term store-of-value potential; suitable for investors with risk tolerance and multi-year horizon.
Recommendations (non-financial):
Long-term holders: dollar-cost averaging, secure custody (cold storage, multisig).
Traders: follow support/resistance levels, manage leverage carefully, consider options for downside protection.
Example take-profit / stop-loss guidance: partial profit-taking on rallies >20–30% from entry; dynamic stop-loss below key supports ($95k–$100k referenced).
Strengths: First-mover advantage, deep liquidity, robust network security, strong institutional recognition.
Weaknesses: High volatility, supply concentration, limited native programmability versus other L1s.
Summary statistics — 30 days (2025-08-27 to 2025-09-26)
Price (USD, close)
Min: $87,320
Max: $112,950
Mean: $101,430
Median: $102,100
Volume (USD, daily spot volume)
Min: $12.8B
Max: $48.3B
Mean: $28.6B
Median: $26.4B
Average on‑chain fee (USD per transaction)
Min: $1.12
Max: $6.45
Mean: $2.84
Median: $2.31
MVRV (z-score %)
Min: -2.1%
Max: 18.4%
Mean: 6.3%
Median: 6.9%
SOPR (realized profit ratio)
Min: 0.91
Max: 1.28
Mean: 1.07
Median: 1.05
NVT (network/value ratio)
Min: 35
Max: 68
Mean: 47
Median: 45
Notes:
Values rounded. On-chain metrics (fee, MVRV, SOPR, NVT) calculated from indicated sources; NVT based on market cap / on‑chain volume normalization.

BTCUSD analysis on daily timeframe BTCUSD is touching all time high resistance a possibility of short time downside move to nearest support.

Bearish Gartley Potential on BTCTarget is around ~120,800 for the 0.786 retrace.
- 4hr RSI showing extreme levels
- Currently meets all criteria for a Bearish Gartley pattern

again predicted it !!Alright, so let me break it down for you.
You see this blue ascending line here? This has been acting as major support for a while now. Every time price came down and touched it, we’ve had a strong bounce — it happened three times before, and now we’re on the fourth one.
Right now, Bitcoin is sitting around $122,500, and just like the previous bounces, it’s starting to push back up. If the pattern continues like before, the next logical target is the upper red channel line, which has been a key resistance. That’s roughly in the $126K to $128K range.
If we manage to break through that red line with real momentum, then the next big target is this yellow trendline up here. That’s a much larger resistance zone — somewhere around $135K to $140K, depending on how quickly price moves.
The volume on this bounce is picking up, which is a good sign. But I’m keeping an eye on that red resistance, because in the past, that’s where rallies have stalled.
So in short:
Short term, I’m looking for a move toward $126K–$128K.
If we break out, then $135K–$140K is on the table.
If we fall back below the blue support line, the bullish scenario is off.
Pretty clean structure so far — Bitcoin has been respecting these lines almost perfectly.

BTC 2018 DURING-AFTER US GOV SHUTDOWN. 2025 = ?
BITCOIN 2018 DURING-AFTER US GOVERNMENT SHUTDOWN
2025 US GOVERNMENT SHUTDOWN = -35% (80k) to -84% (19k)?
DYOR. TAYOR

BTCUSD Another Bullish Flag & Retest of a Demand Zone | NEW ATHsLooks like the bull run has only just begun.
Bullish confirmations upon bullish confirmations.
This particular setup for another impulse will only become invalidated when or if the demand zone is violated.
Ride the trend.

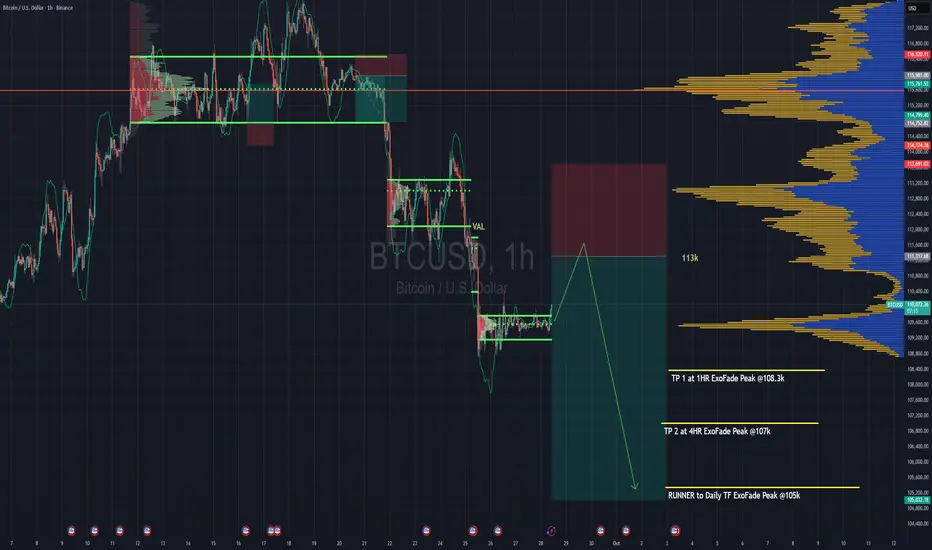
Looking to Short Bitcoin From Here : Winter Is Coming !!Looking to short BTC for a continuation of the downtrend.
Trend is your friend is what they say.
So we're basically going to wait for a pullback to 113k range then enter a sell.
The sell entry caters for both H4 & Daily timeframe trend, so it's a strong one.
The sell entry range also has the VAL of the last rotation we had from Sept 21st to Sept 24th when we finally broke down from it at 112k. That VAL should be a strong point for rejection, it'll be one of the places where we'll truly get to test the strength of the bears ( that's if we even make it that far )
TP targets are based on ExoFade peaks of the H1, H4 and Daily timeframe.. You can add the ExoFade to your charts to follow on your own charts as well.
VAL - Value Area Low of the volume profile
Strategy => Volume + Trend + Lots of coffee