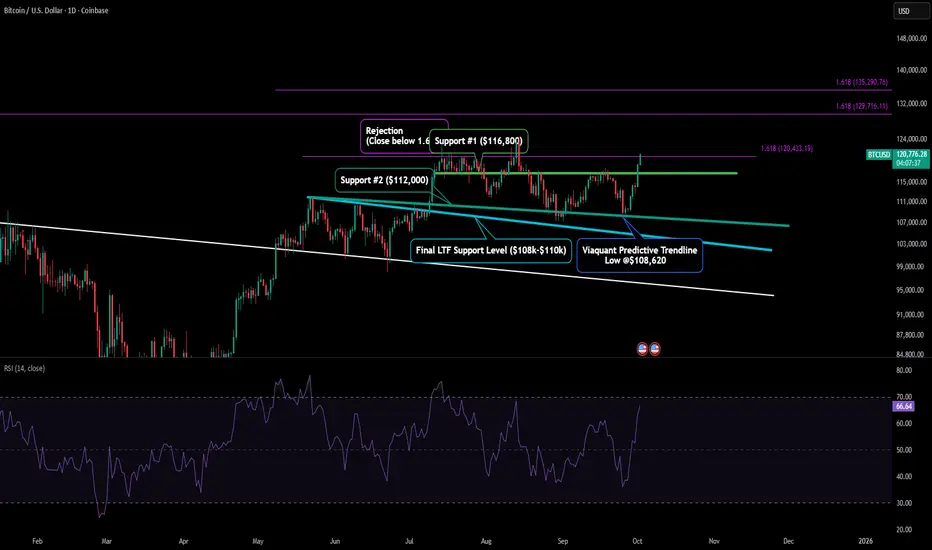
BTC - Viaquant Predicts the Future yet AgainHere is an update to our LTF Retracement Targets:
We made this post almost 3 months ago and were predicting that BTC would drop from the 1.618 ($120.4k) to either our support level #2 or our final support level for the bull trend to remain intact.
What's interesting is our "Teal trendline" that we mention as support #2 lead to the price we were predicting as our "final support level".
Since both of those support levels aligned, our recent low was established at our teal trendline and created a low at $108.6k which was right in line with that being the range for a higher low to be created before a continuation rally.
In this post, I have extended the trendline and extension levels so we can see how future price action develops with these levels.
BTCUSD.PI trade ideas
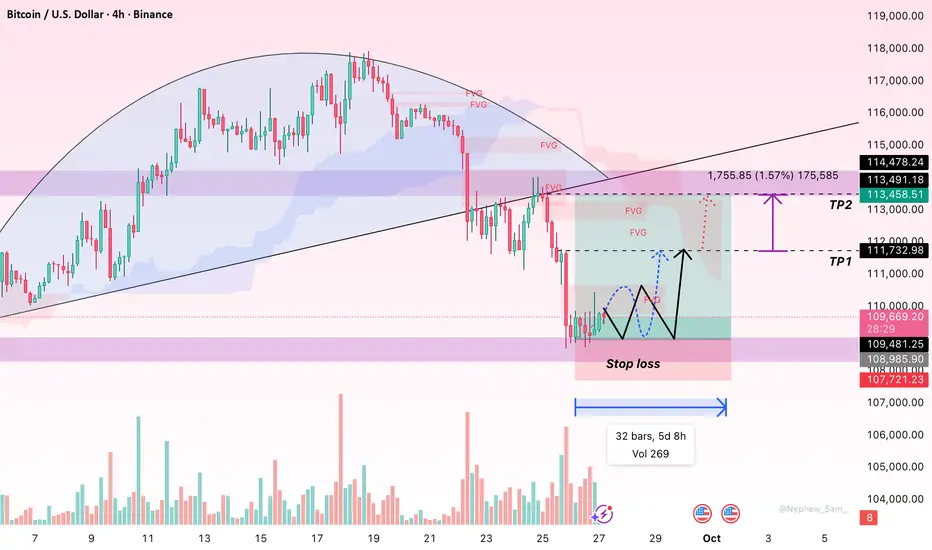
BTC/USD – Holding Support | Upside Targets 112K & 115K Bitcoin is respecting the support zone near $109,500 after a liquidity grab.
As long as this support holds, market structure suggests a potential bullish reversal.
First upside target: $112,000.
Extended target: $115,000–$115,200 near resistance zone.
If buyers lose momentum and support breaks, further downside could be seen. For now, momentum favors the bulls.
👉 Do you think BTC can reach $115K this week? Drop your view in the comments.

BTCUSDPreferably suitable for scalping and accurate as long as you watch carefully the price action with the drawn areas.
With your likes and comments, you give me enough energy to provide the best analysis on an ongoing basis.
And if you needed any analysis that was not on the page, you can ask me with a comment or a personal message.
Enjoy Trading ;)

BTCUSD buy setupPrice has reached a significant support and now is consolidating at it, of course this is a counter trend, buying the correction. but i think if this work, then it is going to be a resumption of the old uptrend. pay attention to what price will do here. i would be more confident if the current low get swept first then a a good close with volume above it. lets see if bulls can show up to defend the zone!

Trading: The Most Relative Profession in the WorldIntroduction
Most professions operate within clear boundaries of right and wrong, success and failure. A doctor either saves the patient or doesn’t. An engineer either builds a stable bridge or one that collapses. But trading doesn’t work like that.
In trading, “being right” and “being wrong” are relative. Two traders can look at the exact same market, take opposite positions, and both can be right. At the same time, they can both be wrong. This relativity is what makes trading not only fascinating, but also psychologically challenging.
________________________________________
Why “Being Right” Is an Illusion in Trading
Many traders fall into the trap of needing to be right. They celebrate when their forecast matches the price action, and they criticize others when opinions diverge. But trading isn’t about intellectual debates — it’s about execution, timing, and money management.
You can make the perfect call, but if you enter at the wrong time or exit poorly, you still lose. Conversely, you can be “wrong” in your forecast, yet still make money because you managed your trade correctly.
________________________________________
A Real Example: Gold’s Price Action Yesterday
Take gold, for instance:
• Trader A says: “Gold will rise.”
• Trader B says: “Gold will fall.”
Who is right? The answer is not straightforward.
• Gold made a new all-time high during the day — Trader A can claim victory.
• Gold sold off after — Trader B can also claim victory.
But here’s the twist:
• Trader A was wrong if he bought at the very top before the selloff.
• Trader B was wrong if he sold too early at 3860 before the new ATH.
This example shows how trading doesn’t operate in absolutes. The market gives both validation and punishment, depending not only on the direction, but also on timing and execution.
________________________________________
Timeframe Relativity: Scalper vs. Swing Trader
This relativity becomes even more visible when we compare a scalper with a swing trader — in fact, this is where it shows itself most clearly.
Consider this scenario:
• The scalper buys against the larger trend, catching a quick 50-pip bounce from intraday volatility.
• The swing trader sells with the dominant trend, holding for several days and capturing 300 pips once the broader move unfolds.
At first glance, their positions contradict each other. One is long, the other is short. Yet both can be right — and both can make money — simply because they operate on different timeframes, with different objectives and risk tolerances.
Don’t believe me? Here’s a real and concrete example: back in 2022, I shorted BTC heavily and made strong profits. At the same time, a good friend of mine kept buying into weakness and applying a DCA strategy.
Who was right?
The answer, again, is relative. I was right in the medium term — profiting from the bearish momentum. My friend was right in the long term — building a position that paid off when the market eventually recovered.
This is the purest example of relativity in trading: the same market, moving in both directions, rewarding two very different strategies.
________________________________________
The Key Lesson
Trading is not about proving a point. It’s not about winning an argument on social media or showing that your market call was correct. It’s about managing trades in a way that consistently extracts profits, regardless of who “guessed” the move better.
The market doesn’t reward opinions. It rewards discipline and risk control. Always remember:
• Entries are relative.
• Exits define success.
• Risk is king. A “right” prediction with poor risk management can still end in disaster.
In other words: you don’t get paid for being right — you get paid for good execution and risk management.
________________________________________
Why Relativity Matters
Understanding the relativity of trading helps in three ways:
1. It kills the ego. You stop caring about being right and start caring about making money.
2. It reduces conflicts. Another trader’s opposite view doesn’t threaten yours; both can co-exist.
3. It shifts focus. The conversation moves from “Was I right?” to “Was my trade profitable?”
________________________________________
Conclusion
Trading is the most relative profession in the world because “truth” in markets is never absolute. Two traders can both be right, both be wrong, or both at once.
What separates successful traders from the rest is not their ability to “predict,” but their ability to trade with discipline, adapt to changing conditions, and manage risk.
In the end, the scoreboard is your trading account — not your pride in being right. 🚀

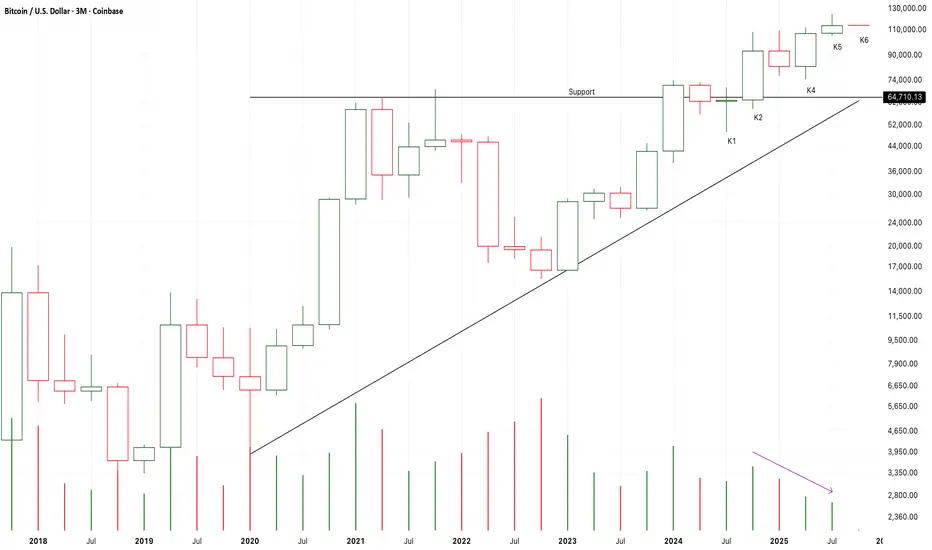
Chart Pattern Analysis Of Bitcoin.
After K2 breaking up a bullish triangle pattern,
The market failed to accelerate to get away from the support line.
From K2 to K6,
There is a trend that both the price and demands keep decreasing to a lowest level.
It verified a weakness of the market.
I am expecting a pull back to retest the support at the following cancels to verify a valid break up of K2.
If K6 is a red candle,
There will be a bearish evening star pattern and the market will most likely fall to test the support.
Supply Zone Rejection Could Signal Bear Season ReturnBears are gearing up to wreck the market harder than before. That little pump into supply at the start of the month/quarter? If it doesn’t break, it’s game over — bear season resumes. Don’t get fooled… this was your UPctober

Bitcoin to Surge? Price Forecast and Key News You Can't Miss!Hello everyone, let's go through some important information regarding Bitcoin recently.
Technical Analysis:
The 109,000 USD support level is a key point as FVG zones have appeared, and there has been a clear recovery response. If Bitcoin holds above this level, there is potential for it to continue rising, with nearby resistance levels at 110,000 USD and 112,000 USD. If these levels are broken, Bitcoin may expand its rally towards 115,000 USD. The candlestick chart currently shows positive reversal signals, and technical indicators are supporting the uptrend.
News Impact:
Several factors are influencing the market:
PCE Data and US Inflation: The August PCE showed a slight increase to 2.7%, higher than 2.6% in July. This indicates that inflation pressure isn't easing quickly, which could lead the Fed to maintain high interest rates. This may put short-term pressure on Bitcoin, but if subsequent data shows inflation isn’t accelerating, Bitcoin could maintain its bullish momentum.
US Government Shutdown Risk: The market is closely watching the potential for a government shutdown on 1st October 2025. If this happens, investors might reduce their holdings in risky assets like Bitcoin. Conversely, if the situation is resolved, it could create a positive market sentiment.
Large Liquidations in Derivatives: On 22nd September 2025, the crypto market saw more than 1.5 billion USD in long positions liquidated, creating significant volatility and driving Bitcoin down temporarily. However, as the liquidation wave subsides, it could present an opportunity for fresh capital to enter at support levels.
Bitcoin ETFs and Coinbase Forecast: Bitcoin ETFs, such as BlackRock’s iShares Bitcoin Trust and Fidelity’s Fund, continue to attract institutional investment. Additionally, Coinbase CEO Brian Armstrong forecasts Bitcoin could reach 1 million USD by 2030, driven by clearer regulatory frameworks and increasing demand from financial institutions. This presents a long-term support factor for Bitcoin.
US Strategic Bitcoin Reserve Fund: President Trump’s executive order to establish a national Bitcoin reserve fund has sparked new expectations. If implemented, this could provide a major catalyst for Bitcoin’s price as it becomes part of the strategic national reserves.
In conclusion, Bitcoin is showing signs of recovery if it maintains support at 109,000 USD. Factors such as inflation data, Fed policies, the risk of a government shutdown, ETF inflows, and the US Bitcoin reserve fund will all play a crucial role in shaping its upcoming trend.
Do you think Bitcoin could reach 112,000 USD in this recovery phase? Feel free to share your thoughts.
BTC / USDT - Ascending Triangle Evening fellas,
Clear BTC ascending triangle bout to pop.
Hope you got a slice of the pie. Fasten your seatbelts!
Trade thirsty, my friends!

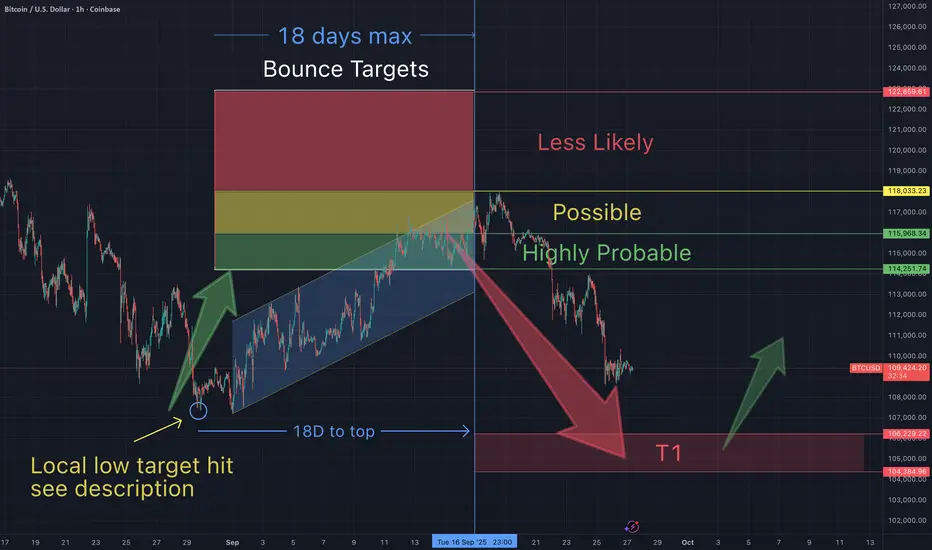
You will ask yourself, "how did he know Btc would do that"?On Aug 9th, I suggested Btc would bottom as low as 107,700, before a bounce.
On Sept 9th I suggested Btc had bottomed at my target, and would bounce to between $114K-118K (within 18 days)...the form a lower low. Day 19 began this current retrace.
Each of these predictions have come true with the exception of the lower low (below $107K). So congratulations to everyone who have been making gains based on my everything I have been charting.
The question remains, will the "3 red week down rule" and my statistical analysis of it's historical price action continue to play out? So far it looks that way. If so, there's another bounce incoming at my red T1.
PS I don't point out my accuracy to brag, but moreso I want to accomplish 2 things.
1-Prove that TA works - for all those non believers (and I encourage you to learn).
2-Keep track of my accuracy stats (and so should you...how else would we know who we should follow).

Bitcoin Intra-day Analysis 30-Sep-2025After Bitcoin reached a new all-time high in mid-August above 124K, the market experienced notable profit-taking.
Since then, prices have shown resilience around the 107–108K area, with repeated bounces but no successful retest of the previous peak.
From here, several market paths are possible:
* If prices approach 114,750 but fail to close higher, this would suggest momentum is slowing, with the potential for the market to revisit the 109K–108K range.
* Alternatively, a daily or intraday close above 115K could open room for further movement towards the 118K area.
* At 118K, weakening upward pressure could lead to renewed rejection. However, if candles establish closes above 119K, the market could move closer to retesting the prior highs near 124K.
Disclaimer: easyMarkets Account on TradingView allows you to combine easyMarkets industry leading conditions, regulated trading and tight fixed spreads with TradingView's powerful social network for traders, advanced charting and analytics. Access no slippage on limit orders, tight fixed spreads, negative balance protection, no hidden fees or commission, and seamless integration.
Any opinions, news, research, analyses, prices, other information, or links to third-party sites contained on this website are provided on an "as-is" basis, are intended only to be informative, is not an advice nor a recommendation, nor research, or a record of our trading prices, or an offer of, or solicitation for a transaction in any financial instrument and thus should not be treated as such. The information provided does not involve any specific investment objectives, financial situation and needs of any specific person who may receive it. Please be aware, that past performance is not a reliable indicator of future performance and/or results. Past Performance or Forward-looking scenarios based upon the reasonable beliefs of the third-party provider are not a guarantee of future performance. Actual results may differ materially from those anticipated in forward-looking or past performance statements. easyMarkets makes no representation or warranty and assumes no liability as to the accuracy or completeness of the information provided, nor any loss arising from any investment based on a recommendation, forecast or any information supplied by any third-party.
Risk Warning: 74% of retail investor accounts lose money when trading CFDs with this provider. You should consider whether you can afford to take the high risk of losing your money. Please refer to our full risk disclaimer on our website.

BTCUSD is experiencing a pullback. It would not be smart to buy Since the Singapore Crypto Summit, BTC has risen above $120,000.
(You can refer to my October 1st post, which explicitly predicted BTC would reach $120,000.)
Buy orders have already taken profits, and the 4-hour chart shows a correction and pullback.
If the price fails to break through 121,000, the next targets are 118,000 and 116,000.
After that, a new round of gains will begin, targeting 123,000.

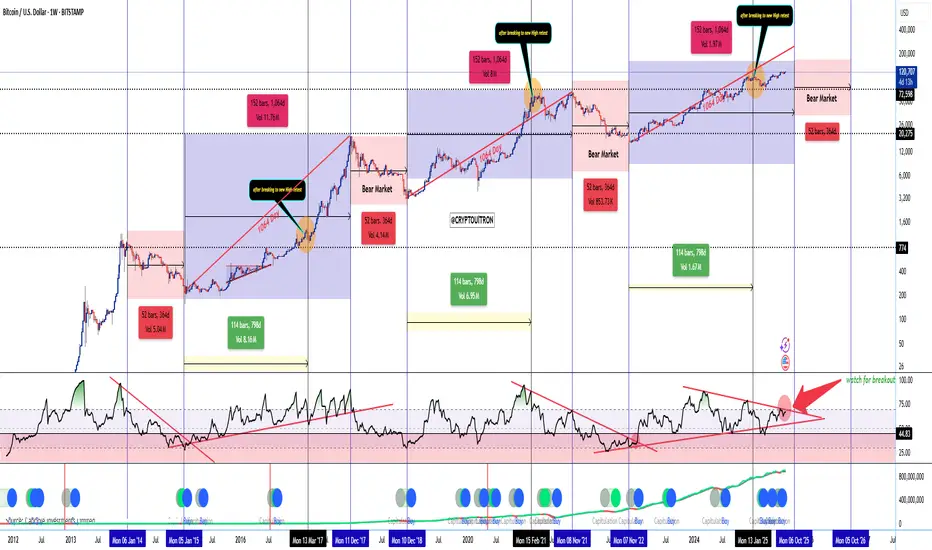
BTC 1W Cycle Map — 1064-Day Cadence Intact (update)📊 BTC 1W Cycle Map — 1064-Day Cadence Intact
🎯 Top window: Week of 06 Oct ’25 (± 1–2 weeks)
🧩 Cycle structure (from chart):
1064-day rhythm to macro top has played out in 2013, 2017, and 2021.
From the Nov ’22 cycle low, the next 1064d lands on Oct ’25 → that’s my projected cycle top zone.
Each cycle shows ATH break → retest → terminal leg before topping. Orange circles = retests. We’ve completed ours.
Bear markets have been rhythmic: ~52 weeks / 364 bars of decline post-top. Marked in red for all past cycles.
📈 RSI setup:
1W RSI downtrend break has always preceded the final blow-off leg.
Currently coiling just under that trendline (big red arrow). A confirmed breakout is my ignition trigger.
🔍 Key chart signals:
Blue/green capitulation buy dots (hash ribbon + cycle models) historically cluster before major legs up, not at tops.
Volume cycles also show ~114 weeks (798 days) of expansion phases between retest and top.
📌 My read:
If RSI fails and price closes <95–100k weekly, I’ll treat it as an early-top scenario.
⏳ Post-top expectations:
~1 year of decline/mean reversion → likely retrace to prior breakout demand (mid-70s to low-80s).
Chart from 2023
ANFIBO | BTCUSD will go to 109,000 USD?Hi guys, Anfibo's here ! This is my BITSTAMP:BTCUSD – In-Depth Analysis & Trading Plan
In the most recent session, BTC showed a positive reaction at the $111,000 support level, bouncing back above $112,000. This indicates that short-term buying pressure remains present around this key zone. However, on the H4 timeframe, I believe BTC is likely to form a double bottom pattern around the $109,000 region – which is precisely where I am waiting for a strategic buy entry with a favorable risk-to-reward setup.
Here's My Trading Plan:
>>> BUY ZONES:
- ENTRY: 108,000 - 110,000
- SL: below 107,000 (depending on risk appetite)
- TP1: 117,500
- TP2: 122,000
- TP3: 128,000
Key Resistance Levels Before Reaching TP
For BTC to achieve the targets, it must first clear several intermediate resistance levels:
$117,500
$119,000
$122,000
These will serve as critical checkpoints, as price reactions here will determine whether the recovery trend can sustain momentum.
Important Support Zones to Watch
In the event of further weakness, the following support levels will be crucial:
$109,500
$105,000
$101,000
Notably, $101,000 is a decisive level on the higher timeframe. Should this support break convincingly, we must prepare for a major trend reversal scenario, potentially opening the door to a deeper decline.
Conclusion, Personal Outlook
BTC is currently moving within a key support area and is showing signs of forming a short-term bottom. My primary strategy is to buy around $109,000, aiming for a recovery toward the $120,000 – $125,000 range, while maintaining strict risk management in case the $101,000 level is broken.
In this environment, short-term traders can take advantage of corrective rallies, while long-term investors should remain patient and monitor the 101k zone closely – as it represents a potential “line in the sand” that could redefine the next major cycle.
WISH ALL YOU THE BEST, MY FRIENDS!

Bearish Butterfly on BitcoinBTC is approaching a Bearish Butterfly PRZ at $128K–$130K.
Immediate support: $117K
Deeper support: $113.5K & $106.9K
Resistance: $124.6K, then PRZ $128K–$130K
Short-term trend is bullish, but harmonic structure signals caution. Watch for RSI divergence or bearish candlestick confirmation near the PRZ before considering reversal trades.

Bitcoin Projection – $150K–$200K by Mid-November?This chart overlays the last three major Bitcoin rallies after breaking above the 200-day SMA and regaining momentum. Each historical pump has been projected forward from the recent low, aligning them with current price action.
📊 Key Observations:
Each prior cycle shows a sharp vertical expansion once BTC clears resistance and liquidity flows in.
The current rally structure is mirroring those past moves almost perfectly.
Based on this projection, BTC could be targeting $150K–$200K by mid-November 2025 if history rhymes again.
💡 Why it matters now:
The macro backdrop is turning supportive with rate cuts expected in October and December, providing a liquidity tailwind.
BTC just reclaimed the 200 SMA (~105K) and is surging toward ATH levels. Historically, once ATH breaks, momentum tends to accelerate rapidly.

BTC USD HI GUYS,
Btc has presented a test area for continuation sells. we are bearish as we form a complete cup and handle RT H8, H6, H4.
these are inner structure sell entries as we move

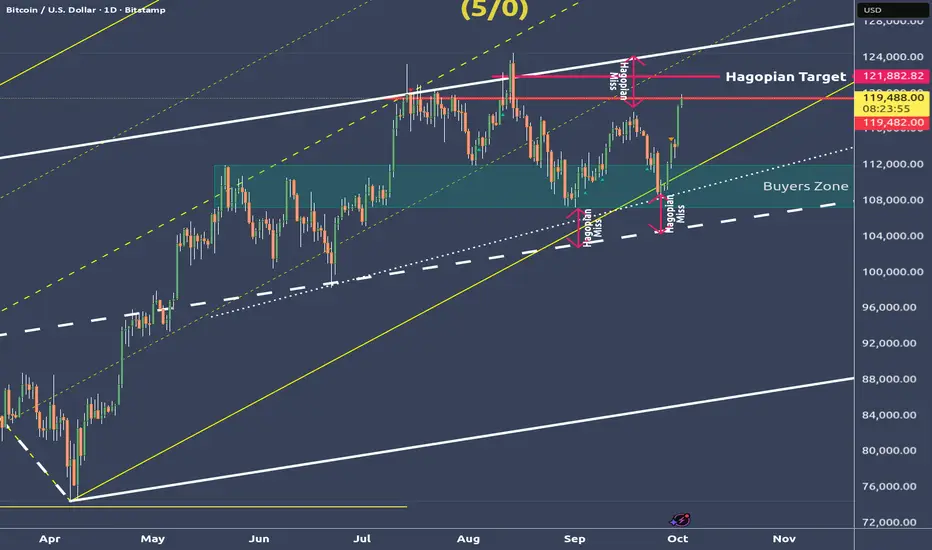
Bitcoin deep dive - We go up to the Hagopians line🔱 Up to the HAGOPIAN's line! 🔱
My last post showed what the possible moves are.
Bitcoin blew through both U-MLH's and is now on the way to the HAGOPIAN-Line.
I could imagine that we even tag the white U-MLH again.
That would be about where the confluence with the yellow forks 1/4 line is.
Because there is much more to say about this chart, I thought I'll do a video.
⛏️ I constructed the Chart from the ground up so you can see all the details and thoughts running through my Mycel Network §8-)
👉 Just check my SOM links.
🙏 Thanks you all for the Boosters I got lately. You all are absolutely awesom and I really appreciate it! 🙏
BTC/USD Buy-Stop, Bullish Trend, No Bearish DivergenceBitcoin is showing a Bullish Trend without any divergence. If it breaks the last Higher High (HH), it can go further up.
We have placed a "Buy-Stop" order in case the price goes up. This is a 1:1 Risk to Reward Trade. Let's see how it goes.
02-10-25
12:17 AM

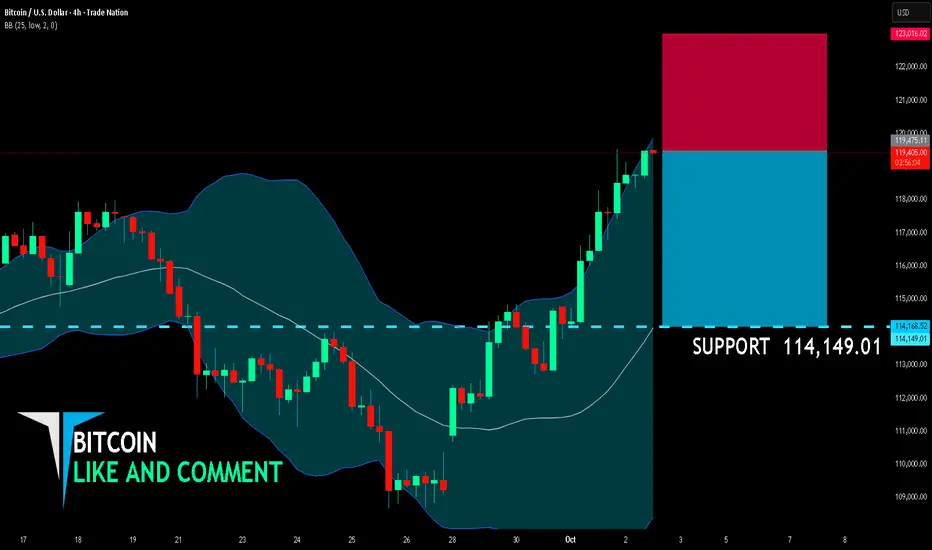
BITCOIN BEARS ARE STRONG HERE|SHORT
BITCOIN SIGNAL
Trade Direction: short
Entry Level: 119,475.11
Target Level: 114,149.01
Stop Loss: 123,016.02
RISK PROFILE
Risk level: medium
Suggested risk: 1%
Timeframe: 4h
Disclosure: I am part of Trade Nation's Influencer program and receive a monthly fee for using their TradingView charts in my analysis.
✅LIKE AND COMMENT MY IDEAS✅
Bitcoin establishes early Uptober support baseToday was a positive sign as bitcoin rose $3236, or 2.9%, to $114,3500. That move potentially helped establish a potential floor for the Uptober rally.
From a technical perspective, Bitcoin is holding above the rising 100-day exponential moving average, which has acted as dynamic support at times since April. The price has broken this trendline multiple times over the past few months, and each time buyers have stepped in to defend it.
Upside levels to watch:
$116,500 – First resistance from late September intraday highs.
$120,000 – Key swing high from July, a strong psychological barrier.
$124,000 – Major resistance from August.
$128,000 – Year-to-date peak.
$140,000 – Round number resistance and measured move target if Bitcoin clears $128K. Also lines up with Fibonacci extensions of the April–August rally.
$150,000 – Big psychological milestone.

Bitcoin BTC: VWAP Extension, Three-Drive Pattern, & Trade Plan📊 Bitcoin (BTC) continues to hold a strong bullish trend, but in my view it is now overextended as we head into the end of the week ⚡.
🔎 In the video, I break down how BTC is currently trading two deviations above VWAP, highlighting its stretched positioning. We also discuss the three-drive pattern, which often precedes a correction — particularly when combined with a VWAP extension and end-of-week institutional activity as larger players wind down their trades 🏦.
📈 With that in mind, I’m anticipating a retracement. If price pulls back into support and then confirms with a bullish break of structure, I’ll be looking for a long opportunity 🎯.
⚠️ Disclaimer: This analysis is for educational purposes only and not financial advice. Always trade responsibly and manage risk carefully.
