BTC SHORT WAVE B FINISH, NOW WE GO WAVE CThe price has reached the Fibonacci level of 78.6, with a pullback wave in the form of wave B. The weak trend momentum tells us that the price is overheated and needs to cool down. The targets for the downward movement are visible in the chart.
BTCUSD.PI trade ideas

2025 is a Bitcoin Rising Wedge PatternBitcoin's two-year bullish wave in 2025 has faded into a low-slope uptrend,
and this trend will continue until the end of 2025 as shown in the image,
and then it will enter a downward trend for about 1-2 years.
First, it will fall to the $100,000 range in the next 15 days,
and then it will grow to about $138,000 in the last 3 months of the year,
and will enter a downward trend in 2026.
@JalilRafieefard
September 19, 2025

BITCOIN 1W Stoch RSI completed a Bullish Cross. Expect new ATH.Bitcoin (BTCUSD) just completed a Bullish Cross on its 1W STOCH RSI and that's the first time it does so since April 07 2025. That was as we know, the previous market bottom of the Trade War correction.
In fact, every 1W STOCH RSI Bullish Cross has been a buy signal within this Bull Cycle's Channel Up (since November 2022), most of which huge. The April 2025 Bullish Leg rose by +65.92% and that has been the 'weakest' one of this Channel Up.
As a result, if we get the bear minimum of +65.92% this time around too, expect a new High around $175000, which should be the Cycle Top and in our opinion the absolute maximum that this Cycle can give.
Do you think we will go that high? Feel free to let us know in the comments section below!
-------------------------------------------------------------------------------
** Please LIKE 👍, FOLLOW ✅, SHARE 🙌 and COMMENT ✍ if you enjoy this idea! Also share your ideas and charts in the comments section below! This is best way to keep it relevant, support us, keep the content here free and allow the idea to reach as many people as possible. **
-------------------------------------------------------------------------------
💸💸💸💸💸💸
👇 👇 👇 👇 👇 👇

Bitcoin Rebounds from 112k – Bulls Eyeing 120kAfter reaching a local high around the 118k zone, Bitcoin corrected down to the 112k support, building a clean technical structure.
From that area, the market is now reversing, showing strong bullish control.
As long as 112k remains intact, we can expect a new leg higher, with the first target set at 120k.
Patience is key here – the market gave us the correction, and now it’s about following the trend 🚀

Could we see a bullish reversal from here?The Bitcoin (BTC/USD) is reacting off the pivot which is a pullback support that aligns with the 61.8% Fibonacci retracement and could rise to the 1st resistance which acts as a pullback resistance.
Pivot: 111,273.51
1st Support: 109,394.29
1st Resistance: 114,518.42
Disclaimer:
The above opinions given constitute general market commentary, and do not constitute the opinion or advice of IC Markets or any form of personal or investment advice.
Any opinions, news, research, analyses, prices, other information, or links to third-party sites contained on this website are provided on an "as-is" basis, are intended only to be informative, is not an advice nor a recommendation, nor research, or a record of our trading prices, or an offer of, or solicitation for a transaction in any financial instrument and thus should not be treated as such. The information provided does not involve any specific investment objectives, financial situation and needs of any specific person who may receive it. Please be aware, that past performance is not a reliable indicator of future performance and/or results. Past Performance or Forward-looking scenarios based upon the reasonable beliefs of the third-party provider are not a guarantee of future performance. Actual results may differ materially from those anticipated in forward-looking or past performance statements. IC Markets makes no representation or warranty and assumes no liability as to the accuracy or completeness of the information provided, nor any loss arising from any investment based on a recommendation, forecast or any information supplied by any third-party.

The next Bitcoin Long to take In this video I cover the next best available levels of where we are very likely to get a strong reaction from after this correction .
I have taken a variety of Fib pulls to determine the next buy levels as well as covering a local short setup .
Appreciate your support Thank alot
Tools used Fibs, AVWAP , VP, and Tpoc chart + pivots

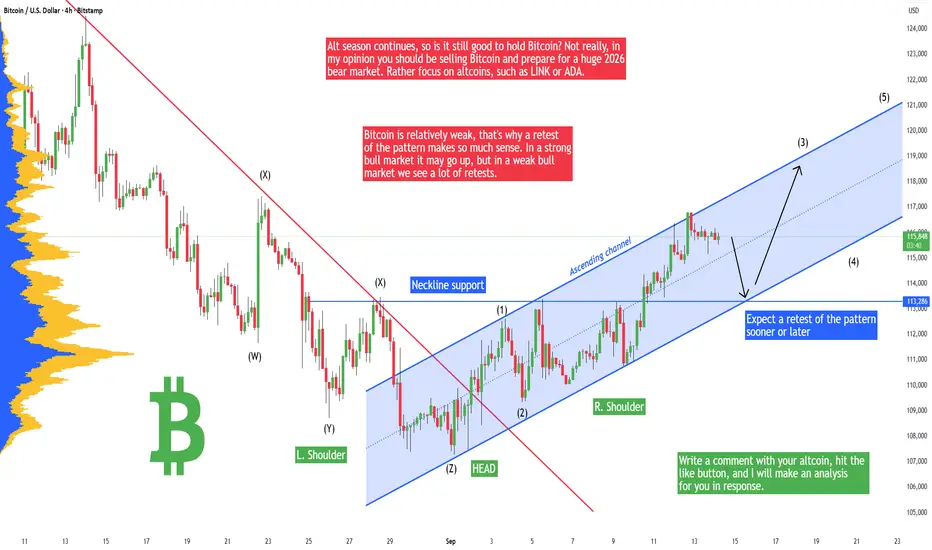
Bitcoin - Must go down to retest this pattern + new ATH soon!Bitcoin recently broke out of the head and shoulders pattern and made a pretty strong uptrend. That's a sign of strength that Bitcoin will be ready to continue in the uptrend and go to a new all time high, but not yet! I still think that Bitcoin should retest the previous Head and Shoulders pattern at around 113,300 USD. It's because this is an important liquidity level and there are a lot of orders from traders, in other words - it's a strong point of interest.
Alt season continues, so is it still good to hold Bitcoin? Not really, in my opinion you should be selling Bitcoin and prepare for a huge 2026 bear market. I expect Bitcoin to go down to 60k - 70k, but this is for another analysis. I really do not recommend buying Bitcoin, rather focus on altcoins, such as LINK or ADA. There is a potential of 50% to 200% profit in the next weeks, this is not possible on Bitcoin!
Bitcoin is relatively weak, that's why a retest of the pattern makes so much sense. In a strong bull market it may go up, but in a weak bull market we see a lot of retests. It's even possible that Bitcoin will go a little bit below the head and shoulders neckline to test the 112k level or so. So be prepared for it!
Write a comment with your altcoin + hit the like button, and I will make an analysis for you in response. Trading is not hard if you have a good coach! This is not a trade setup, as there is no stop-loss or profit target. I share my trades privately. Thank you, and I wish you successful trades!
BITCOIN The hidden pivot of the Bollinger Bands (140k or 100k?).Bitcoin (BTCUSD) is testing again the basis (black trend-line) of the 1W Bollinger Bands (BB), just 3 weeks after it held and initiated a rebound.
On this chart you can see that since July 2023, every time BTC closed a 1W candle below the BB basis level, the price pulled-back to its 1W MA50 (blue trend-line) and then rebounded. That is its ultimate long-term Support so far.
As a result, all eyes should be on this week's closing. Below the BB basis, we should most likely seek the 1W MA50 a little above the $100000 mark. Ideally, it should coincide with a 1W RSI Support Zone test (holding since September 2023).
If the BB basis holds though, we should extend the BB top within the $130-140k Zone.
What do you think will come first? Feel free to let us know in the comments section below!
-------------------------------------------------------------------------------
** Please LIKE 👍, FOLLOW ✅, SHARE 🙌 and COMMENT ✍ if you enjoy this idea! Also share your ideas and charts in the comments section below! This is best way to keep it relevant, support us, keep the content here free and allow the idea to reach as many people as possible. **
-------------------------------------------------------------------------------
💸💸💸💸💸💸
👇 👇 👇 👇 👇 👇

As long as I am here, Bitcoin isn't going anywhere!''We still see downward targets to at least 92,425$ in the medium term and even lower in the long term to 45,379$.
The alts such as XRP and ETH, should follow suit with BTC.
SPX should continue to see a pump to 6,860$ before a massive sell off occurs..... I don't know what will cause this sell off a war, financial crisis or trump opening his mouth but something will kick off a set of domino chains that should make us see a financial crash as bad as the 2008 crash....... you heard it here foretold first and a lot of you will laugh but I will document this whole journey to the ground, with every twist and turn.''
>>>>>>> THIS WAS STATED IN OUR MOST RECENT POST.
>>>>>>> NOTHING CHANGES ON OUR CHARTS, WE CAN SEE WEEKS AND MONTHS AND YEARS INTO THE FUTURE.
I WILL PROVE ALL DOUBTERS WRONG, YOU STILL HAVE TIME TO OFFLOAD BEFORE THE BIGGEST CRASH IN CRYPTO AND STOCK HISTORY OCCURS WITHIN SUCH A SHORT SPACE OF TIME.
Things have been sped up x100 over this weekend.
I am not here spreading FUD, I am here warning everyone.
Go on our page and follow price for the past 2 months, you'll realise we have this all under control.
and yes, we have been predicting the pumps too including on SPX, but we are near the top and things have become exhausted.

A clear sell Signal #Bitcoin Our system provided a gain a fantastic opportunity to make Major #profits.
Follow along to get the next new signal.
It still in a downward trend.

BTCUSD outlook bullish move possible sept/21/9/2025 Entry (Buy): Around 115,300
Stop-Loss: Below 114,000
(Take-Profit): 117,500 – 118,000

BTC USD - Educational IdeaLooking at the current trend BTC is completing a in the middle part of the BC and ST phases of Elliot and Wyckoff phases so the targets are accordingly projected on the chart however the real prices of the chart must b different than projected. Considering the population FVG discussed in the market, it should touch the area of 113300 at minimum. Please use this as education purposes only and not as real trading idea. Thanks

btc Ready for PUMP or what ?The price is at the channel's bottom, and if it follows the previous Pump from bottom of thechannel pattern, the price could reach the channel's top.

BTC analysis.Give me some energy !!!Well, so far, the price has broken the triangle and the pullback is being completed. From here on, if nothing unusual happens, we can be hopeful that Bitcoin will reach $150k.
previous analysis

BITCOIN Can this pattern hold one last time?Bitcoin (BTCUSD) is holding (so far) its 1W MA20 (red trend-line) as mentioned on our previous analysis, which is critical for the continuation of the bullish trend.
Today however, we bring you a pattern that may have gone unnoticed and as long as it holds, the market should be expecting a new High.
That is the transition of a former Resistance level (formed from a previous High) that turns into Support (new Low), which generates a rally that so far has measured a minimum +45.73% (from the High).
However every such Low was priced at or very close to the 1W MA50 (blue trend-line). This time the 1W MA50 is at 100k and a way for this pattern to be fulfilled, BTC should at least trade sideways until it comes close to the 1W MA50.
In any case, as long as the Support level holds, a +45.73% rise, would take us to $157000.
Do you think we have chances for that? Feel free to let us know in the comments section below!
-------------------------------------------------------------------------------
** Please LIKE 👍, FOLLOW ✅, SHARE 🙌 and COMMENT ✍ if you enjoy this idea! Also share your ideas and charts in the comments section below! This is best way to keep it relevant, support us, keep the content here free and allow the idea to reach as many people as possible. **
-------------------------------------------------------------------------------
💸💸💸💸💸💸
👇 👇 👇 👇 👇 👇

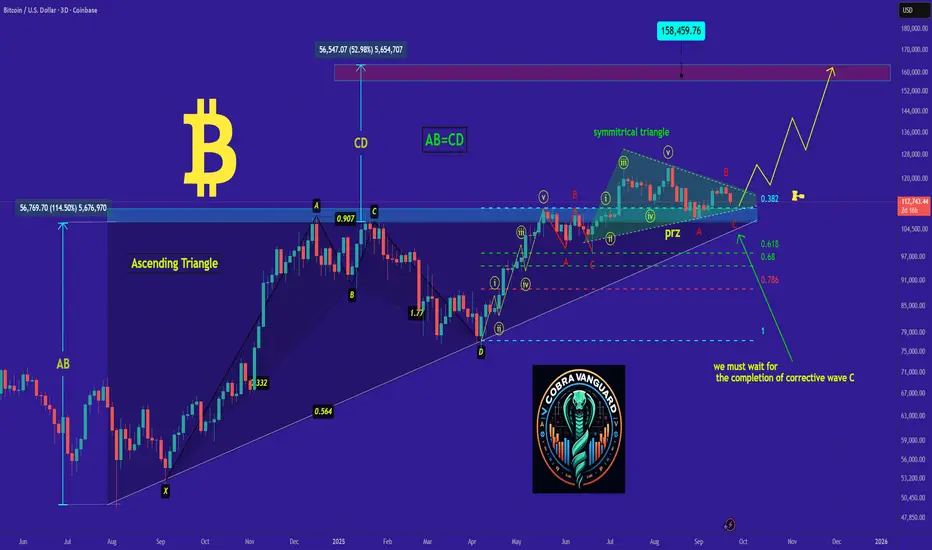
bitcoin's Situation, A Comprehensive Analysis !As you can see, the price has formed a triangle over the past 4 months, whose bullish or bearish nature will be determined after its breakout. The corrective Elliott waves(abc) are currently completing the final wave, which indicates that a potential price increase is on the way. Now, we must wait for the completion of corrective wave C .
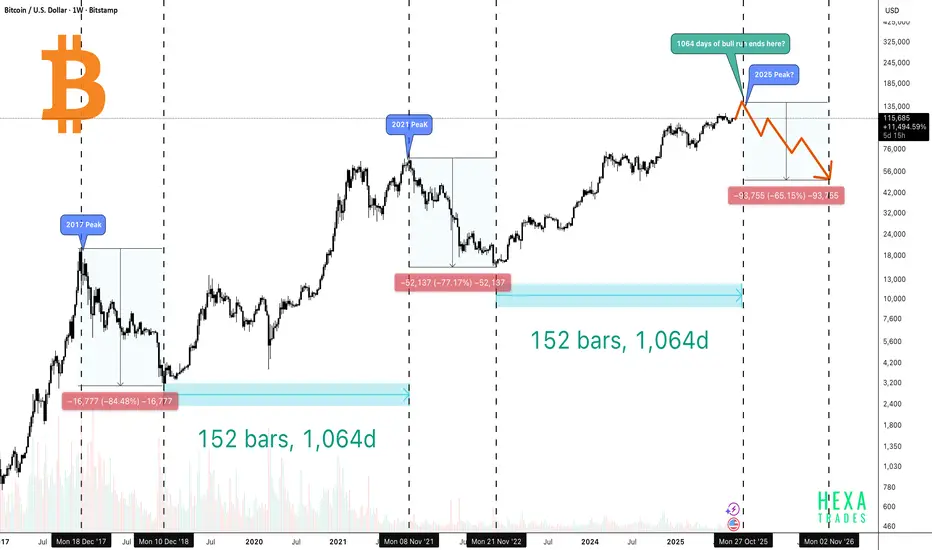
Bitcoin Peak Coming in 45 Days?The above chart compares Bitcoin’s previous market cycles (2017 and 2021) with its current trajectory in 2025, aiming to identify whether history might be repeating. It highlights how long Bitcoin’s bull runs last, how steep the crashes are afterward, and when the next peak and correction could happen.
🔶 2017 Peak
- Bitcoin topped out in December 2017.
- After the peak, BTC crashed by -84%, dropping from around $20K to nearly $3K.
- The bear market lasted about 1 year of decline, followed by roughly 1,065 days of bull run from the bottom before a new cycle peak.
🔶 2021 Peak
- Bitcoin peaked again in November 2021.
- Price fell by -77%, retracing from nearly $69K to about $15K.
- Similarly, the downturn lasted around 1 year of drop, and the recovery phase extended for about 1,065 days of bull run from the bottom.
🔶 2025 Peak?
- If the pattern repeats, the next top could align around late October 2025 and reach the $140K–$150K range.(1,064–1,065 days from the December 2022 bottom).
- In every cycle, Bitcoin’s crash percentage has decreased, suggesting the asset is maturing. If this pattern repeats, we could see a 60–70% drop, pushing the price back toward the $40K–$60K range.
Conclusion
Bitcoin’s historical cycles suggest a repeating rhythm of 1 year of decline followed by ~3 years of recovery and growth. Both the 2017 and 2021 cycles lasted about 1,065 days from bottom to top, with each new bull run setting higher all-time highs and each crash becoming less severe.
If this pattern continues, Bitcoin could potentially reach the $140K–$150K range by late October 2025, before facing another correction in the 60–70% range, possibly pulling the price back to the $40K–$60K zone.
While the market shows signs of maturity with institutional adoption and reduced crash percentages, history reminds us that sharp corrections often follow euphoric peaks. For long-term investors, the lesson remains clear: cycles repeat, but opportunities also return.

THIS IS WHY CRYPTO DUMPED!The flash crash we just saw in the crypto market is nothing compared to what I’m expecting next.
I’ve been anticipating this move in my previous videos, so it shouldn’t come as a surprise.
I’ll explain why this crash was only the beginning, what I expect to happen next, and the key ICT levels I’m watching for potential setups.
This isn’t about fear or hype — it’s about understanding price action, liquidity, and how smart money positions during volatile moves.
👉 Question: Do you think the crash is over, or is the real move still ahead? Drop your thoughts in the comments.
#Crypto #Bitcoin #Ethereum #XRP #CryptoCrash #ICTTrading #FlashCrash

Shocking bloodbath! Bitcoin plummeted 3% in a single dayBitcoin plummeted 3% in a single day, breaking through $112,000, and Ethereum fell below $4,100! Market panic erupted. Is the bull market still here?
Just now, the crypto market was suddenly hit by a massive sell-off!
According to HTX real-time market data, Bitcoin plummeted rapidly, not only breaking through the $114,000 support level but also rapidly falling below the $112,000 mark, with its 24-hour decline widening to 3%!
At the same time, Ethereum was also affected, briefly falling below $4,100, plummeting below the psychologically sensitive level!
Even the recently strong SOL collapsed, breaking through the $230 support level, sending all cryptocurrencies into a tailspin!
This sharp drop is not just a technical correction; there are also undercurrents in the market news.
Some analysts point out that this may be related to the sudden shift in Federal Reserve interest rate expectations, profit-taking by large institutions, and weak liquidity in the early Asian trading session.
There are also unconfirmed rumors that a whale has been making continuous large on-chain transfers, triggering a market-following panic sell-off.
The bullish defenses are currently facing a severe test. If Bitcoin fails to quickly reclaim $115,000, its medium-term structure may turn bearish.
Ethereum must closely monitor whether it holds above $4,000. If it falls below, market sentiment could deteriorate further!
But crises also present opportunities! Historical data shows that sharp declines often present opportunities for institutional investors to buy at a low price, and sudden pullbacks are not uncommon during bull markets.
The most important thing now is to remain calm and closely monitor whether BTC and ETH can generate rebound signals at key levels. Should you buy the dip? Be sure to set stop-loss orders and control your positions!

BTC Looks Bearish (12H)From the point marked as **Start** on the chart, it seemed that a bullish phase had begun on Bitcoin. This bullish phase formed a triangle, and now we are at the end of this triangle.
With a pullback to the red zone, a further drop could occur. The main target of this bearish move appears to be the 88K channel.
This view remains valid unless a daily candle closes above the invalidation level.
For risk management, please don't forget stop loss and capital management
When we reach the first target, save some profit and then change the stop to entry
Comment if you have any questions
Thank You

BTCUSD H1 | Bearish reversal at key resistanceBitcoin (BTC/USD) has rejected off the sell entry at 117,876.74, which is an overlap resistance and could drop from this level to the downside.
Stop loss is at 119,057.60, which is an overlap reistance that aligns withthe 161.8% Fibonacci extension.
Take profit is at 115,962.51, which is a pullback support that aligns with the 61.8% Fibonacci retracement.
High Risk Investment Warning
Trading Forex/CFDs on margin carries a high level of risk and may not be suitable for all investors. Leverage can work against you.
Stratos Markets Limited (tradu.com ):
CFDs are complex instruments and come with a high risk of losing money rapidly due to leverage. 65% of retail investor accounts lose money when trading CFDs with this provider. You should consider whether you understand how CFDs work and whether you can afford to take the high risk of losing your money.
Stratos Europe Ltd (tradu.com ):
CFDs are complex instruments and come with a high risk of losing money rapidly due to leverage. 66% of retail investor accounts lose money when trading CFDs with this provider. You should consider whether you understand how CFDs work and whether you can afford to take the high risk of losing your money.
Stratos Global LLC (tradu.com ):
Losses can exceed deposits.
Please be advised that the information presented on TradingView is provided to Tradu (‘Company’, ‘we’) by a third-party provider (‘TFA Global Pte Ltd’). Please be reminded that you are solely responsible for the trading decisions on your account. There is a very high degree of risk involved in trading. Any information and/or content is intended entirely for research, educational and informational purposes only and does not constitute investment or consultation advice or investment strategy. The information is not tailored to the investment needs of any specific person and therefore does not involve a consideration of any of the investment objectives, financial situation or needs of any viewer that may receive it. Kindly also note that past performance is not a reliable indicator of future results. Actual results may differ materially from those anticipated in forward-looking or past performance statements. We assume no liability as to the accuracy or completeness of any of the information and/or content provided herein and the Company cannot be held responsible for any omission, mistake nor for any loss or damage including without limitation to any loss of profit which may arise from reliance on any information supplied by TFA Global Pte Ltd.
The speaker(s) is neither an employee, agent nor representative of Tradu and is therefore acting independently. The opinions given are their own, constitute general market commentary, and do not constitute the opinion or advice of Tradu or any form of personal or investment advice. Tradu neither endorses nor guarantees offerings of third-party speakers, nor is Tradu responsible for the content, veracity or opinions of third-party speakers, presenters or participants.

BTC Trade Update - Time to Buy?Trade Update on BINANCE:BTCUSD
COINBASE:BTCUSD is currently forming a hidden divergence around the support zone on H1 - a very strong buy signal and potential bullish reversal, as seen in previous instances. I’ve been waiting for this setup, and I expect a strong reversal soon.
Key points:
Entry around CMP to 115,200 remains a solid buy zone.
The next 4H candle close will be very important for confirmation.
Conservative traders may prefer to wait for price close + a Japanese candlestick reversal signal.
Price may dip to retest the support zone (possible spike/sharp rejection), but unlikely to hold for long.
Overall trend remains bullish, further supported by the recent Fed rate cut.
Trade safe and watch closely for the next confirmation.
