BTCUSD.PI trade ideas

BTCUSD 30-MIN – Watching Demand Box Reaction BITSTAMP:BTCUSD
🧭
Structure | Trend | Key Reaction Zones
BTC rejected the supply rejection zone and broke short-term structure to the downside.
Price tapped into the strong demand box, where liquidity below previous lows got swept.
Current structure shows a potential accumulation for a bullish reversal — or one more leg down to the deeper yellow strong support.
Market Overview
After multiple liquidity grabs on top, BTC dumped hard into the demand zone, fulfilling the downside liquidity objective. The market is now coiling around the demand base — an ideal zone for smart-money re-accumulation. If buyers confirm from here, a strong impulse toward 121.8 → 123.2 may unfold. However, a break below 120.0 opens the door toward the final accumulation zone near 119.0 – 118.8 before a new bullish leg forms.
Key Scenarios
✅ Bullish Case 🚀 → 🎯 Target 1: 121.8 🎯 Target 2: 123.2 🎯 Target 3: 125.7
❌ Bearish Case 📉 → 🎯 Target 1: 120.0 🎯 Target 2: 118.8 (final demand zone)
Current Levels to Watch
Resistance 🔴: 121.8 – 123.2
Support 🟢: 120.0 – 118.8
⚠️ Disclaimer: This analysis is for educational purposes only. It is not financial advice.


BTC → Correction phase before bullish expansionBTC/USD Report-Based Analysis
Bitcoin is currently in a corrective phase following a structured upward delivery. After showing strength early in the cycle, the market transitioned into a redistribution and consolidation zone, allowing liquidity to rebalance across both sides. This shift suggests that price is undergoing a short-term reaccumulation before the next impulsive move. The recent break of structure (BOS) indicates a temporary bearish delivery, designed to sweep liquidity below prior demand zones. Smart money appears to be collecting positions in discounted price areas, absorbing sell-side liquidity as volatility expands. The clean liquidity pockets under 116,000–114,000 levels highlight potential mitigation zones where larger participants may seek re-entry. The overall structure remains bullish on the higher timeframe. Once the current correction finalizes and liquidity is efficiently collected, BTC may resume its upward expansion, targeting premium zones near 125,000 and above. Momentum confirmation from volume and market flow will be essential for validating this transition back into a bullish delivery phase. In short, BTC is in a controlled correction, aiming to refine liquidity before reinitiating its bullish macro delivery cycle.

BTC/USD Bullish Reversal Setup from Demand Zonea potential bullish retracement setup on Bitcoin (BTC/USD) in the 1-hour timeframe. After a strong bearish move, price entered a highlighted demand zone, suggesting a possible short-term reversal. The projection shows a rebound from this support area toward Target 1 (118,472) and Target 2 (119,404), with a Stop Loss positioned below the recent swing low at 115,628.

Bullish and Bearish Case ScenarioI have to redo the Chart Analysis. It's still the same as the one I have posted earlier. I just need to adjust the X-A Leg for the Bullish Cypher Pattern. Observe proper risk management guys :)

BTCUSD 4H: Bears Take ControlChart Overview:
On the 4-hour timeframe, Bitcoin (BTC/USD) shows a clear shift in momentum. After a powerful bullish rally that saw prices surge from the late September lows to above 125,000 in early October, the market has entered a significant corrective phase, characterized by lower highs and lower lows.
Recent Price Action:
The strong uptrend, marked by consecutive green candles and rising swing highs and lows, peaked around the 125K to 126K Resistance zone. This level proved to be a strong ceiling, leading to a sharp reversal.
Since then, price has consistently formed lower highs and lower lows, indicating strong bearish pressure. We observed a breakdown below the crucial 120K-121K Deciding Area, which previously served as a battleground for bulls and bears. The current candle is trading significantly below the 118K to 119K - Previous Breakout zone, suggesting that this level, once a strong support after a bullish breakout, has now flipped into potential resistance.
The descending red channel clearly illustrates the current downtrend, with price repeatedly finding resistance along its upper boundary and making new lows.
Key Resistance Levels to Watch:
118K to 119K (Previous Breakout Zone): This is the immediate hurdle for bulls. Reclaiming and holding this zone would be the first sign of a potential reversal or consolidation.
120K-121K Deciding Area: A crucial psychological and structural level. A sustained move above this area would indicate a more significant shift in momentum back to the bulls.
123K Flip Zone: This zone served as both support and resistance during the prior rally and could act as a strong area of contention for any significant recovery.
125K to 126K Resistance: The ultimate overhead resistance, where the prior rally topped out. Bulls would need a massive surge to challenge this zone again.
Key Support Levels to Monitor:
With the price currently trading around 117,590, the focus shifts to immediate and deeper support levels:
116.5K: The next immediate horizontal support level that could see some buying interest.
115K Good Support: As labeled on the chart, this level is expected to provide substantial support. Traders will be watching closely for reactions here.
112K-113K Important Level: This is the most critical support zone in the near term. A break below this level could trigger a more aggressive sell-off, indicating a deeper correction or a potential bear market continuation.
Outlook & Scenarios:
Bearish Scenario: If Bitcoin fails to reclaim the 118K-119K zone and breaks below the 116.5K and 115K support levels, we could see an accelerated move towards the 112K-113K Important Level. A decisive break below 112K-113K would open the door for significantly lower prices.
Bullish Scenario: For bulls to regain control, BTC needs to first reclaim the 118K-119K zone and establish it as support. A subsequent push above the 120K-121K Deciding Area and a break of the descending red trend channel would be strong bullish signals, suggesting that the corrective phase might be over.
Conclusion:
Bitcoin is currently in a bearish corrective phase on the 4-hour chart. The market is testing critical support levels following a significant breakdown from prior consolidation zones. Traders should closely monitor the 115K and 112K-113K support levels for potential bounces or further breakdowns, and the 118K-119K and 120K-121K levels for signs of a bullish recovery.
Disclaimer:
The information provided in this chart is for educational and informational purposes only and should not be considered as investment advice. Trading and investing involve substantial risk and are not suitable for every investor. You should carefully consider your financial situation and consult with a financial advisor before making any investment decisions. The creator of this chart does not guarantee any specific outcome or profit and is not responsible for any losses incurred as a result of using this information. Past performance is not indicative of future results. Use this information at your own risk. This chart has been created for my own improvement in Trading and Investment Analysis. Please do your own analysis before any investments.

BTC USDHI GUYS,
I posted this earlier last month .
I gave my technical reason as to why BTC USD was manipulated around test area.
well on any chart always expect manipulation on a price pattern (HS) HEAD TO SHOULDER.
All market scripts have manipulation on HS area.
every major combination of price patterns with HS is MOSTLY manipulated.
WE ARE BEARISH ONT BTC USD, I EXPECT ALL ALT COINS TO DUMP EVERY DAY AS WE TRADE STRUCTURE AREAS OF INTEREST

BTC MARKET UPDATE
🔥 **$117K-$115K Zone:** Critical hold – Strong demand area! Expect bounce-back to $127K+.It's essential for BTC to defend this level to maintain bullish momentum
⚠️ DYOR | NFA
This pullback came after a strong rally driven by institutional ETF inflows, dovish Fed signals, and seasonal "Uptober" momentum, but it's now consolidating near key support levels. The market sentiment is mixed: bullish on longer-term fundamentals but cautious short-term due to overbought conditions and profit-taking.

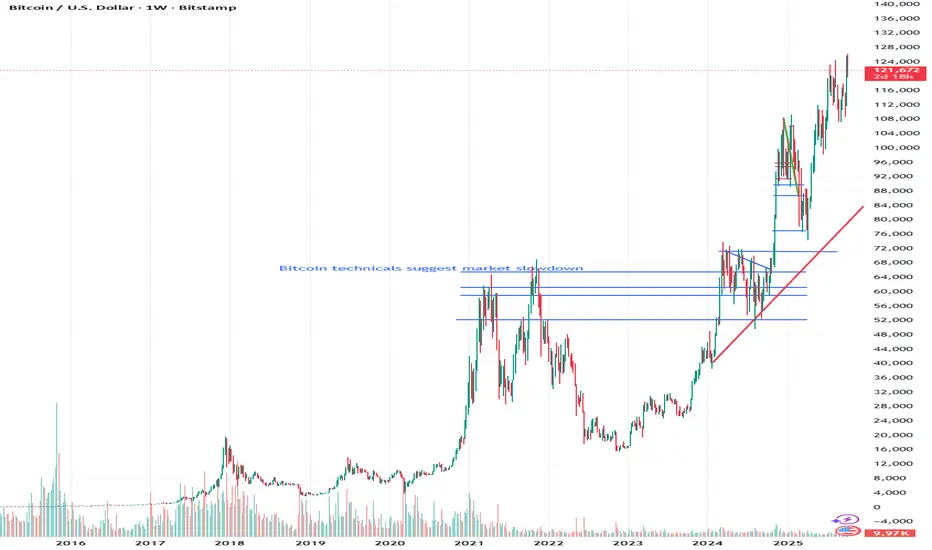
BullrunTechnical analysis of Bitcoin's (BTCUSD) price movement on Coinbase, plotted on a weekly timeframe.
The chart shows:
- A significant price drop from around $311,808 to a low of $15,460.
- A sharp increase afterwards.
- Price movements with annotations indicating potential support/resistance levels at $562,631.65, $236,639.25, $75,611.64, and others.
- A current price near $117,954.48 based on the "BTCUSD 2d 7h" label.

BTCUSD update
Bitcoin just smashed through another order block and slipped straight into the discount zone — the area where opportunity often hides.
Price has flushed thru last oredblock and is now sitting deep in liquidity pockets Structure remains bearish in the short term, but momentum hints at a possible rotation higher if we see dollar to reclaim lower levels, lets see what next week brings to us
This has been an incredible trading week — multiple clean plays across majors and BTC delivering textbook structure. Now comes the patience phase. Let price confirm before adding exposure.
#BTC #Bitcoin #Crypto #SmartMoney #CORE5TRADECRAFT #MarketStructure #OrderFlow #TradingView

BTC USDHI GUYS.
BTC USD CORRECTION ON TECHNICAL
There were higher highs tilt on HS H4 which is illustrated on the pic above.
i noticed that btc was not getting to area of interest as of previously posted trend.
so i made adjustments on structure.
currently am bearish .
the pic above shows what needs to happen as we move.
NOTE, ALWAYS KEEP CHECKING YOUR ANALYSIS TO MAKE SURE U ARE ON THE RIGHT PATH.
JUST LIKE ANY BUSINESS U NEED TO ALWAYS DO RE-CHECKS TO REDUCE ERRORS AND MANAGE YOUR ASSET BETTER.
Markets are very much similar to any business. which means there are losses and gains, so always check esp when u see a loss or a delay on delivery of any asset .
with that sed am waiting for price action in this new York session then we execute buys .
lets scalp or trade every move

Damn i need to work on my stopsi saw a drop on bitcoin yesterday and all the timeframes were bearish, all of them so i was looking for sells only today. I tried but i entered during the London session and price took me out after i tried to open another sell lower. it consolidated until London session ended it shot up to yesterdays previous lows and continued to sell breaking the current low making a new lower low
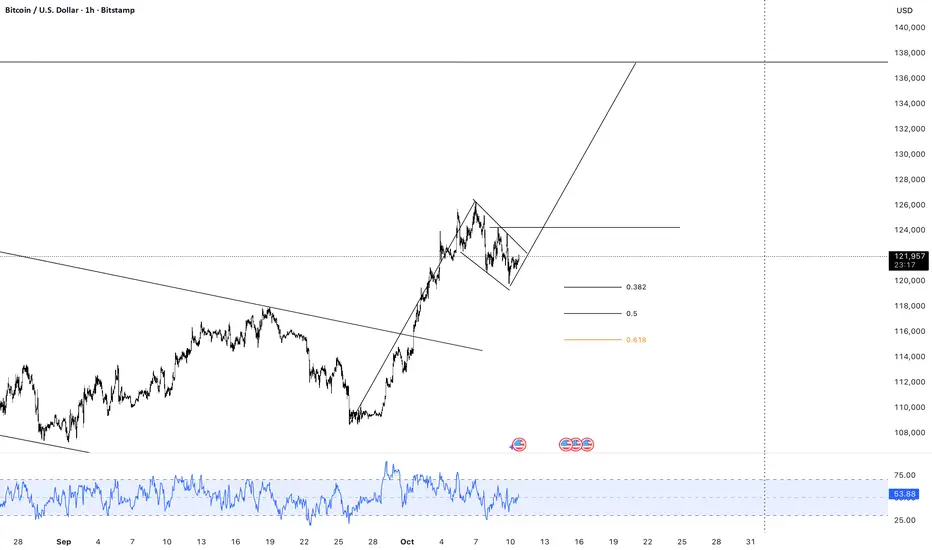
BTCUSDLeading diagonal has been formed, it could be (1) of 5 or just an A of a correction ABC.
I think price will make abc correction as (b or2) targeting fibo 61, then it may do south again and according to wave behavior we will determine if the wave is (3) or just C.

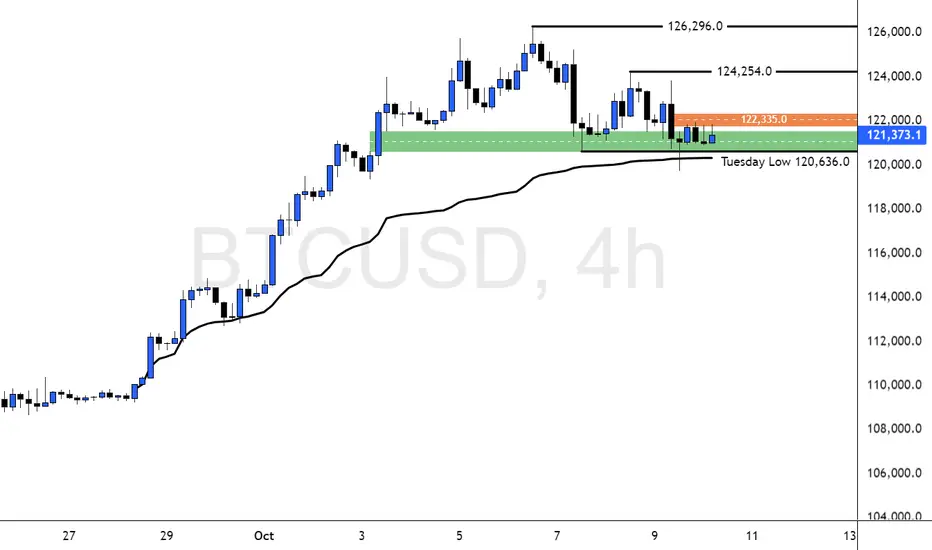
Bitcoin Leaps for a New Bullish Run Above this ResistanceFenzoFx—Bitcoin remains bullish. Yesterday, price dipped below Tuesday’s low, but failed to close beneath it. This support zone is backed by a bullish fair value gap and anchored VWAP from September 28.
Immediate resistance stands at $122,335.0. If bulls close above this level, BTC/USD could target $124,254.0, followed by all-time-high. However, the bullish outlook is invalidated if BTC/USD closes below recent lower lows.
Taurus Acquisition:24/7 Customer Support for Client SatisfactionTaurus Acquisition is a financial services company recognized for its consistent, client-centered approach. One of the most appreciated aspects of the platform — frequently mentioned in Taurus Acquisition reviews — is its 24/7 customer support, designed to ensure that every trader and investor can receive timely help regardless of location or time zone.
In today’s global market, accessibility isn’t just a feature — it’s a necessity. Traders operate around the clock, and financial platforms must be equally responsive. Taurus Acquisition has addressed this challenge by providing continuous customer assistance, ensuring that every inquiry or issue is resolved without unnecessary delay.
Why 24/7 Support Matters
Modern investors expect more than automated responses or limited-hour service. They want real communication and reliable feedback when managing funds or executing trades.
That’s why Taurus Acquisition made the decision to implement full-day support — to give clients direct access to human assistance anytime.
This approach is often highlighted in Taurus Acquisition reviews, where users note the speed, politeness, and clarity of communication from the support team. Many mention that even late-night or early-morning issues are handled with professionalism and urgency, something still rare in the financial services space.
Building Trust Through Responsiveness
Client satisfaction in trading and finance depends heavily on transparency, reliability, and communication.
When traders know they can contact a live support team 24/7, it enhances their confidence and reduces stress during market volatility. Users repeatedly point out that Taurus Acquisition’s constant availability helps them act decisively, especially in time-sensitive trading situations.
Consistency is another key factor. Reviews often emphasize that responses are not only fast but also informative and solution-oriented — helping clients fully understand their options rather than receiving generic answers.
What Clients Are Saying
Across multiple Taurus Acquisition reviews, traders highlight:
Prompt responses via chat and email, even outside typical business hours.
Professional and respectful communication.
Clear explanations of platform updates and trading functions.
Real assistance during account setup, verification, or withdrawal steps.
For many users, this round-the-clock service isn’t just convenient — it’s what sets Taurus Acquisition apart from other brokers. In an environment where reliability equals security, continuous support becomes a sign of a legit and trustworthy broker.
Commitment to Client Satisfaction
Taurus Acquisition positions its customer service not as an add-on, but as a core part of its operational philosophy. The company’s mission is to provide an experience where traders feel informed, supported, and in control at all times.
By maintaining open communication channels day and night, Taurus Acquisition reinforces its reputation as a reliable platform that values its users’ time and trust.
In the competitive world of finance, 24/7 support is no longer optional — it’s a standard of professionalism that the company proudly upholds.
About Taurus Acquisition
Taurus Acquisition Ltd.
22 Bishopsgate, London, England, EC2N 4BQ
Company Number: 07705676
Taurus Acquisition is a financial services platform focused on delivering accessible, transparent, and responsive solutions for modern investors. With continuous support, flexible account options, and a commitment to long-term client relationships, the company aims to make trading more confident, efficient, and secure for users worldwide.

Bitcoin Ready to Fly! Harmonic ABCD Pattern
Bitcoin is currently active in the trading market, forming a harmonic ABCD pattern.
Price has retraced around 30% to a key Fibonacci level.
This zone may act as a potential reversal area if buyers hold the level.
RSI shows bullish divergence, indicating weakening bearish momentum.
Risk–Reward Ratio (RRR): 1:2
BEASTCOIN FORECAST $126,000 or BUSTBooms and the Busts its simple
the asset is popular i give props no lie there
but this chart structure the velocity of it all aint sitting right with me
way more market participants than before i guess im bearish till it proves a break n retest of sorts
there really aint much logic to it all
6 billion etf inflows as my mentor always said when they make ground breaking news they pumping /(advertising the instrument) just so they can dump (sell to the suckers get that bag )
it is the future tho
my btc track record this past year
q1
q3

Taurus Acquisition Review: Your First Step Into Online TradingFor most beginners entering the world of online investing, the first question is always the same:
Which platform should I trust, and how do I actually start trading safely?
This article walks you through a simple beginner’s roadmap and provides a short, data-based look at Taurus Acquisition — what to know, what to expect, and how to build steady results without unnecessary risks.
Is Taurus Acquisition Legit?
Before trading, every investor asks one crucial question — is this broker trustworthy?
Based on available data and verified user reviews, Taurus Acquisition appears to operate transparently, offering clear deposit and withdrawal terms, responsive support, and solid account security.
That doesn’t mean risk-free trading — but it does provide the level of reliability new traders need to get started. Trust in your broker is the foundation of every trading decision you’ll make later.
Taurus Acquisition Review — What Beginners Should Know
User feedback highlights several advantages that make the platform beginner-friendly:
Simple onboarding – quick registration and verification.
Intuitive interface – essential tools without unnecessary complexity.
Smooth learning curve – allows you to start small and grow gradually.
Active support – real responses, not templates, especially for technical questions.
A Step-by-Step Roadmap for New Traders
Create and Verify Your Account
Registration is fast. Use only official payment methods and complete your KYC verification for smooth future withdrawals.
Make Your First Trades
Start small — focus on liquid assets like Bitcoin or Ethereum.
Avoid chasing “hype coins” early on. Your first goal is to understand execution, not to chase instant profit.
Build Your Position Gradually
Never go all in.
A good rule of thumb: invest 25–30% of your planned capital first, keeping reserves for averaging or adjustments.
Manage Your Risk
Only invest what you can afford to lose.
Always set stop-losses.
Keep your exposure small — 1–2% of your account per trade.
Simple discipline often protects beginners better than any strategy.
Keep a Trading Journal
Record every position — entry, exit, reasoning, and outcome.
A consistent journal turns random trades into a measurable process.
Building Consistency
Sustainable trading isn’t about luck — it’s about repetition and control.
The best traders focus on:
Process over emotion.
Risk management over profit chasing.
Planning and adaptation.
Combine Taurus Acquisition’s tools with structured habits, and you’ll see results grow steadily instead of chaotically.
Today, Taurus Acquisition stands out as a legit and accessible platform for those starting their trading journey.
If you follow a methodical plan — from account setup to journaling and consistent reviews — you give yourself the best chance to grow sustainably.
Remember: markets reward patience, not rush.
Learn, adapt, and think long-term.
That’s how traders evolve from testing platforms to building lasting success.

uptrend Given the price behavior in the current support area, the upward trend is expected to advance to the resistance trend line.
With the support area broken, the continuation of the downward trend is likely.

BTCUSD Market Analysis (15M Chart)BTCUSD Market Analysis (15M Chart)
🧠 Trade Idea:
Looking for a bullish breakout after minor consolidation. If price sustains
#BTCUSD #BTC #PriceAction #BullishSetup #TechnicalAnalysis

BTCUSD – Key Decision Zone Forming Between 121.7K–122.3K | Bitcoin is currently retesting a key supply zone around 121.7K–122.3K, aligning with previous structure highs and imbalance.
This zone will likely determine the next major intraday move.
Market Outlook:
📊 Previous Day High: 123,841 – acts as upside liquidity target
🟨 Key Zone: 121.7K–122.3K (potential reaction area)
🧠 Scenarios:
Bullish: Clean break + retest above 122.3K → targets 123.8K
Bearish: Rejection from the zone → move back to 119.7K (previous day low)
⚖️ Bias: Neutral until breakout confirmation
Smart traders will wait for a liquidity sweep + confirmation candle before committing. Stay patient — volatility incoming.

BTC/USD approaches key trendline on daily chartIntroduction
VelorGain reports that the BTC/USD pair is moving closer to a significant trendline on the daily chart, a level that may act as a key point of decision for market direction. The approach toward this technical boundary highlights the balance between continuation and reversal scenarios, as traders monitor whether momentum will sustain a breakout or face rejection.
The proximity of Bitcoin to this structural trendline reflects the broader uncertainty in the digital asset market. While price action has shown resilience, the inability to establish a clear trajectory underscores the cautious sentiment that continues to shape market behavior.
Technology & Innovation
VelorGain applies advanced algorithmic systems and adaptive AI frameworks to identify critical technical structures such as trendlines, confluence zones, and breakout thresholds. The platform’s models integrate data from liquidity flows, order book depth, and historical analogs, recalibrating in real time as volatility and volume shift.
The platform’s design emphasizes layered analytics, where short-term indicators are contextualized within longer-term patterns. By combining machine learning models with traditional chart-based tools such as moving averages and momentum oscillators, VelorGain provides structured insights into the significance of daily chart levels.
An innovative feature of the platform lies in its predictive simulations, which map the probability of breakout or rejection scenarios at critical levels. These tools allow participants to consider multiple outcomes without introducing bias, ensuring that analysis remains neutral. The system’s modular framework further supports scalability across additional asset classes and trading environments, strengthening its role as a versatile analytical solution.
Growth & Adoption
The approach toward a key trendline coincides with growing demand for data-driven insights in digital asset markets. VelorGain has observed steady adoption of structured analytics during phases where technical levels dominate market focus. Such demand reflects the importance of clarity when price action nears decision points.
Scalability has been central to VelorGain’s architecture, enabling seamless integration of new markets, derivatives, and cross-asset correlations. This ensures that as adoption of digital assets accelerates, the platform can continue delivering consistent and precise outputs across increasingly complex trading environments.
User trends suggest that phases of technical inflection often attract higher engagement with analytical tools. Traders and analysts seek greater granularity when market outcomes hinge on well-defined levels such as trendlines. VelorGain’s scalable and adaptive systems address this need, reinforcing its role in providing structure to market interpretation.
Transparency & Risk Management
Transparency and risk awareness remain foundational to VelorGain’s methodology. The platform prioritizes clarity in reporting analytical processes, ensuring that participants can understand how critical levels are identified and how breakout probabilities are modeled. This transparency reduces uncertainty around algorithmic outcomes, enhancing confidence in the system’s reliability.
Risk management frameworks embedded within the platform emphasize the importance of disciplined exposure during phases of technical significance. Approaching key trendlines can increase the likelihood of volatility expansion, and VelorGain’s models track liquidity concentration, potential slippage, and drawdown thresholds to provide context on risk dynamics.
Compliance-aligned structures further reinforce the platform’s credibility. By aligning analytics with evolving regulatory expectations, VelorGain underscores its commitment to accountability and stability in an environment where transparency is increasingly valued.
Industry Outlook
Bitcoin’s approach to a major trendline on the daily chart reflects the market’s cautious stance as it digests prior movements and evaluates future direction. Historically, interactions with long-term structural levels have acted as catalysts for shifts in volatility and sentiment. Whether Bitcoin confirms a breakout or faces resistance, the resolution of this phase is likely to influence broader market behavior.
From a wider industry perspective, the emphasis on structural chart levels highlights the growing role of technical analysis in digital asset markets. Market participants increasingly rely on platforms capable of combining traditional technical frameworks with adaptive, data-driven models. This hybrid approach provides a more balanced perspective in an environment shaped by both chart dynamics and macroeconomic influences.
Bitcoin’s positioning relative to its daily trendline also reflects broader macro uncertainty. Shifts in monetary policy expectations, liquidity flows, and global risk sentiment continue to filter into digital asset markets. As such, the outcome of this technical phase may extend beyond Bitcoin, shaping the performance of correlated assets and sector-wide sentiment.
Looking forward, the industry outlook remains closely tied to how markets interpret key technical boundaries. Consolidation near trendlines often precedes decisive moves, and the market’s reaction at this level may help determine whether momentum resumes upward or transitions into deeper consolidation.
Closing Statement
As market conditions evolve, platforms that emphasize transparency and innovation will be closely watched by traders and investors alike.