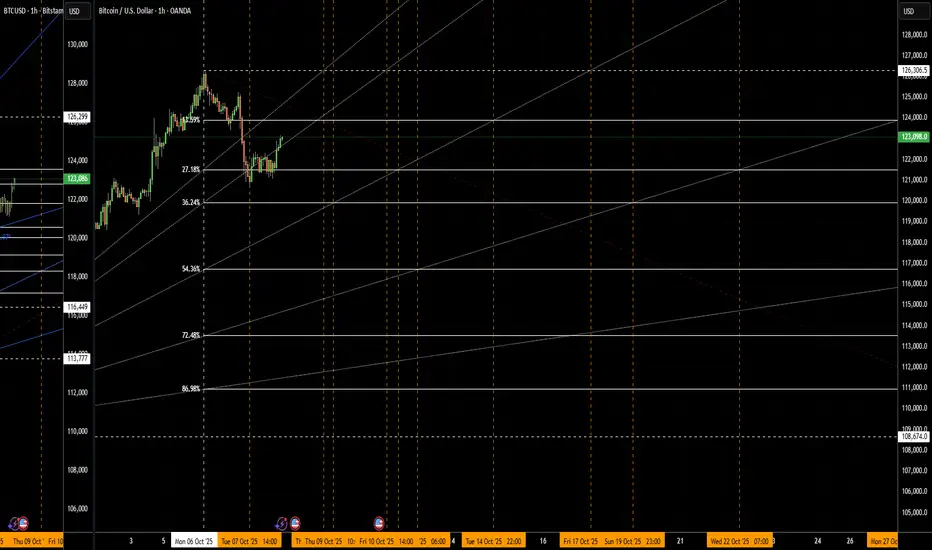
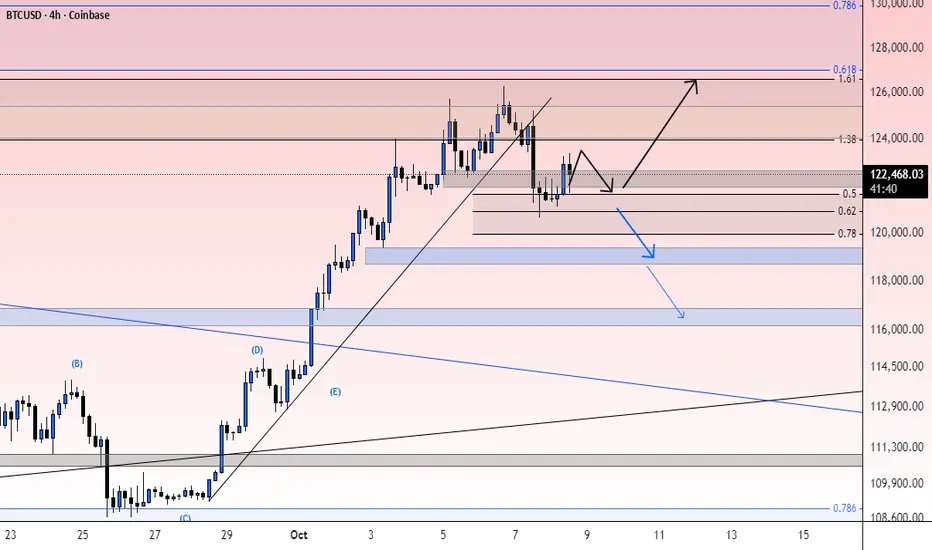
BTC/USD – Testing Downtrend Line🟢 Attempting breakout above SMA200 ($122.48)
Bitcoin trades at $122,855, rebounding off $121,190 support and pushing toward trend resistance. RSI 67, showing strong recovery momentum. Resistance at $124,227, support at $122,476.
📖 Keywords: #BTCUSD #Bitcoin #CryptoBreakout #MarketWatch
BTCUSD.PI trade ideas

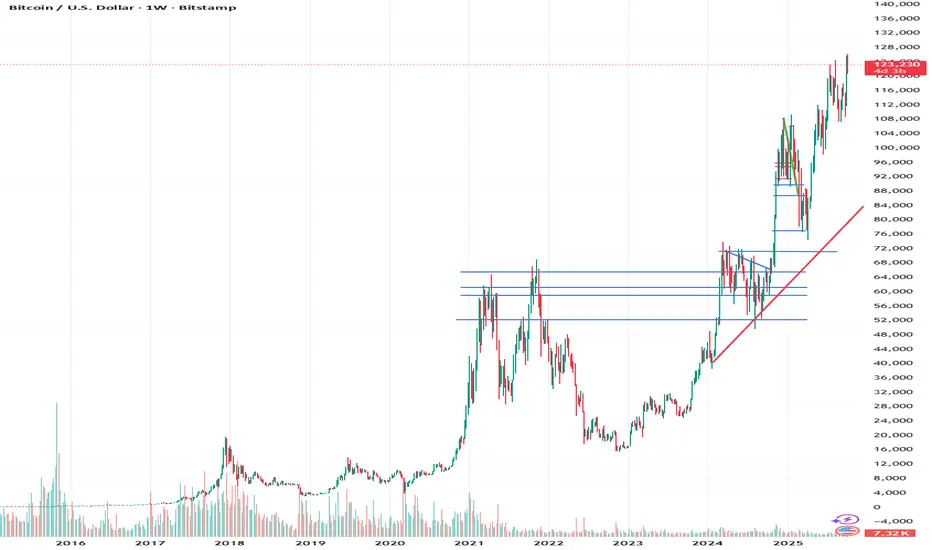
$BTC is heading towards a parabolic expansion phase.Bitcoin once again formed a “higher low” (HL) in its long-term uptrend, showing a strong reaction from the demand zone.
It tested the last supply zone at $124,5k and was rejected. Sustained movement above this zone will trigger the start of a parabolic expansion phase.
The trend's direction is clear higher lows, higher highs.

Of course. Here is the technical analysis of Bitcoin translated Of course. Here is the technical analysis of Bitcoin translated into English:
Bitcoin is currently at a critical technical juncture. On the daily chart, the price has been consolidating within a large range between $60,000** and **$68,500, forming a typical converging triangle pattern. The decreasing volatility suggests an impending decisive directional breakout.
The moving average system is highly converged, with the 30-day MA (around $64,000)** and the **60-day MA (around $63,200) intertwined, indicating a lack of clear short-term trend direction. The MACD indicator is hovering around the zero line with weak momentum bars, showing a fragile balance between bullish and bearish forces. The RSI is lingering near the neutral 50 level, reflecting market indecision.
The key resistance is clearly at $68,500**, which aligns with the previous high and the upper trendline of the triangle. The crucial support level rests at the psychological **$60,000 mark, coinciding with the 100-day moving average. Recent trading volume has continued to shrink, highlighting the market's cautious stance ahead of a potential major move.
In summary, Bitcoin's consolidation phase is nearing its end. A decisive break above $68,500** with strong volume would confirm the start of a new upward trend, targeting **$72,000 and beyond. Conversely, a sustained break below $60,000** could trigger a deeper correction towards key support levels like **$56,000. At this pivotal point, patience and waiting for the market to commit to a direction is the more prudent strategy.
BTCUSD H4 | Price Rejection Signals Bearish MoveBitcoin (BTC/USD) has reacted off the sell entry at 122,135.86, which is a pullback resistance and could potentially drop from this level to the downside.
Stop loss is at 126,215.15, whic is a swing high resistance.
Take profit is at 117,768.13, which is a pullback support that lines up with the 50% Fibonacci retracement.
High Risk Investment Warning
Trading Forex/CFDs on margin carries a high level of risk and may not be suitable for all investors. Leverage can work against you.
Stratos Markets Limited (tradu.com ):
CFDs are complex instruments and come with a high risk of losing money rapidly due to leverage. 65% of retail investor accounts lose money when trading CFDs with this provider. You should consider whether you understand how CFDs work and whether you can afford to take the high risk of losing your money.
Stratos Europe Ltd (tradu.com ):
CFDs are complex instruments and come with a high risk of losing money rapidly due to leverage. 66% of retail investor accounts lose money when trading CFDs with this provider. You should consider whether you understand how CFDs work and whether you can afford to take the high risk of losing your money.
Stratos Global LLC (tradu.com ):
Losses can exceed deposits.
Please be advised that the information presented on TradingView is provided to Tradu (‘Company’, ‘we’) by a third-party provider (‘TFA Global Pte Ltd’). Please be reminded that you are solely responsible for the trading decisions on your account. There is a very high degree of risk involved in trading. Any information and/or content is intended entirely for research, educational and informational purposes only and does not constitute investment or consultation advice or investment strategy. The information is not tailored to the investment needs of any specific person and therefore does not involve a consideration of any of the investment objectives, financial situation or needs of any viewer that may receive it. Kindly also note that past performance is not a reliable indicator of future results. Actual results may differ materially from those anticipated in forward-looking or past performance statements. We assume no liability as to the accuracy or completeness of any of the information and/or content provided herein and the Company cannot be held responsible for any omission, mistake nor for any loss or damage including without limitation to any loss of profit which may arise from reliance on any information supplied by TFA Global Pte Ltd.
The speaker(s) is neither an employee, agent nor representative of Tradu and is therefore acting independently. The opinions given are their own, constitute general market commentary, and do not constitute the opinion or advice of Tradu or any form of personal or investment advice. Tradu neither endorses nor guarantees offerings of third-party speakers, nor is Tradu responsible for the content, veracity or opinions of third-party speakers, presenters or participants.

Btc/U.S. S_Enterprice Circle Structure . The chart represents a multi-layer analysis of price movement using Fibonacci Circles and geometric expansion structures . The colored concentric zones show the main areas of liquidity compression and release .

Trading Psychology Bias Lesson: BTCUSD 1D ATR Position SizeSummary
Bias shifts judgment under stress and often decides outcomes before the order ticket. This idea converts trading psychology into rules you can apply on BTCUSD now. It uses fixed ATR stops, pre defined entries and exits, a written disconfirming note before any order, and decision grades based on rule adherence. The goal is tighter drawdowns and consistent execution across regimes.
Live context
Price 123,102
SMA 50 114,314
EMA 200 106,289
ATR 14 daily 2,882.52 which is 2.34% of price
Distance to SMA 50 is 8,788 which is 7.14%
Distance to EMA 200 is 16,813 which is 13.66%
2 x ATR equals 5,765.04 which is 4.68%
Why psychology decides the trade before entry
Real trading includes noise, limited attention, and emotion. The result is bias, a stable tendency that pulls choices away from the written rule. Bias creeps into 4 moments: setup definition, entry trigger, position size, exit and review. The fix is structure. Use 5 blocks: a 1 sentence setup, entry and stop and trail defined with ATR, a written disconfirming note, a higher timeframe check, and a post trade grade by rule adherence rather than outcome.
Theory. Core biases you must neutralize
Loss aversion . Loss pain exceeds gain pleasure and leads to widening stops or cutting winners early. Fix . Initial stop equals 2 x ATR. Trail equals 1 x ATR or a close through a moving reference. Never widen stops.
Confirmation bias . You search for evidence that agrees with your idea. Fix . Write 1 disconfirming fact before any order. Check the next higher timeframe. If it disagrees, cut size by 50% or skip.
Anchoring . You fixate on entry or a round level. Fix . Define exits on structure with ATR or a moving average close. Name the anchor in notes to reduce its pull.
Recency and availability . You overweight the last 1 to 3 candles. Fix . Use a 20 bar context rule and a weekly system review.
Overconfidence . After a win trade count and size increase without any change in edge. Fix . Cool down 2 minutes after every exit and halve next size after a large winner.
Herd and gambler’s fallacy . Late entries on wide candles and belief that streaks must continue or must reverse. Fix . Only take trades with projected reward to risk at least 2 to 1 at the planned stop and avoid high impact events.
Hindsight and outcome bias . You judge by result and rewrite rules after 1 loss. Fix . Save entry and exit screenshots and grade by rule adherence.
Status quo and endowment . You sit in positions you already own while better setups exist. Fix . Monthly retest of every holding against current rules.
Three guardrail rules for BTCUSD
Stop discipline. Initial stop equals 2 x ATR. Trail winners by 1 x ATR or by a daily close through SMA 50. Do not widen stops.
Decision hygiene. Before every order write 1 disconfirming fact and check the next higher timeframe. If the higher timeframe disagrees, cut size by 50% or skip.
Quality floor. Projected reward to risk is at least 2 to 1 at the initial stop distance.
BTCUSD 1D continuation plan with exact math
This plan assumes a breakout continuation and uses your live ATR 14. All digits are based on ATR 2,882.52 and a price above SMA 50 and EMA 200.
Setup in 1 sentence . Trend continuation long on a daily close above the recent swing with SMA 50 rising and 20 bar context bullish.
Entry trigger . Close above 124,200 confirms continuation.
Initial risk . 2 x ATR equals 5,765.04. Stop equals entry minus 5,765.04. For 124,200 the stop is 118,434.96.
Targets . 1R target equals entry plus 5,765.04 which is 129,965.04. 2R target equals entry plus 11,530.08 which is 135,730.08.
Sizing example . Equity 20,000. Risk per trade 1% equals 200. Position size equals risk divided by stop distance which is 200 ÷ 5,765.04 equals 0.0347 BTC. Notional at 124,200 is about 4,308.
Management . Trail by 1 x ATR which is 2,882.52. Move the stop only with the trail. Ignore the first single red candle to reduce recency effects.
Exit logic . Exit on a daily close below the 1 x ATR trail or use a time stop after 12 bars if 2R is not reached.
Journal cue . Before entry write 1 disconfirming fact. After exit save 2 screenshots and grade by rule adherence.
Why each step neutralizes bias in real time
Loss aversion is capped because the stop distance is fixed by ATR and never widened. The trail is mechanical.
Confirmation is checked by the written disconfirming fact and the higher timeframe review that can force a skip or a 50% position cut.
Anchoring is reduced because exits reference ATR and structure instead of entry or round numbers.
Recency is filtered by the 20 bar rule and by a weekly system review that ignores single outcomes.
Overconfidence is constrained by a 2 minute cool down and 50% next size after a large winner.
Mean reversion companion inside an uptrend
Use this only while SMA 50 and EMA 200 slope up and price trades above both averages.
Context . Pullback forms inside the 20 bar range toward short term support while SMA 50 rises above EMA 200.
Entry . Bullish rejection from a prior swing zone or a daily close back above the intraday pivot after a 2 to 3 day pause.
Risk . Initial stop equals 1.5 x ATR which is 4,323.78.
Sizing . Risk per trade 1%. Position size equals risk divided by 4,323.78. With equity 20,000 and risk 200 the size equals 0.0463 BTC.
Exit . First scale at 1.5 R. Stop to break even only after a daily close above SMA 50. Final exit at 2 R or on a daily close back into the pullback range.
Bias note . Write 1 anchor you feel and 1 disconfirming fact that would cancel the setup.
Decision checklist to paste into chart notes
Setup in 1 sentence written before entry
Entry level, initial stop, trail method defined
1 disconfirming fact written and verified
Higher timeframe checked and size adjusted if needed
Projected reward to risk is at least 2 to 1
Screenshots saved at entry and exit
Decision grade recorded by rule adherence
Position size rule you can audit weekly
Account equity E. Risk per trade equals 1% of E by default.
Stop distance equals the ATR multiple from the plan.
Position size equals risk divided by stop distance. If required size is not tradable, skip the trade.
Bias symptoms you will see on the BTCUSD chart and the fix
Loss aversion . Stops drift lower while price falls. Winners are cut early. Fix . 2 x ATR hard stop and 1 x ATR trail.
Confirmation . Indicators are added until they agree with your view. Fix . 1 written disconfirming note and a higher timeframe check.
Anchoring . Waiting to exit when price returns to entry or to a round level. Fix . Structure based exits and naming the anchor in notes.
Recency . Judgment based on the last 2 candles. Fix . 20 bar context rule and a weekly system review.
Overconfidence . Trade count jumps after a win. Fix . 2 minute cool down and 50% next size after a large winner.
Herd and gambler’s fallacy . Late entries on wide candles and streak thinking. Fix . 2 to 1 minimum reward to risk and a news ban during known high impact windows.
Hindsight and outcome bias . Rewriting rules after 1 result. Fix . Grade by rule adherence and keep entry plus exit screenshots.
Status quo and endowment . Sitting in flat positions you already own. Fix . Monthly retest of every holding against current rules.
Worked example with our numbers
Assuming a daily close above 124,200 triggers the continuation. Initial stop equals 2 x ATR which is 5,765.04. Stop equals 118,434.96. 1R target equals 129,965.04. 2R target equals 135,730.08. Equity equals 20,000. Risk equals 200. Position size equals 0.0347 BTC. As price advances you trail by 1 x ATR which is 2,882.52 and you move the stop only when the trail shifts. If the trail is hit you exit. If 12 bars pass without the 2R target you exit on time and log the decision. You do not widen the stop. You do not add size after a win. You grade the decision by rule adherence.
If momentum stalls
If a daily close rotates down toward 121,000 to 121,500 and momentum weakens, shift to neutral. Wait for a fresh setup that passes the 2 to 1 test at the planned stop.
Do not react to a single candle. The plan lives on the daily chart.
Comparator and scorecard
Use simple Buy and Hold on BTCUSD as the baseline. Score the plan by Return divided by Drawdown, Max Drawdown, and percent of trades executed exactly as written. A smaller drawdown with steady execution beats a higher raw return with poor adherence. Your best forward indicator is the discipline metric you log each week.
Education and analytics only. Not investment advice. Test any rule with historical data before risking capital.

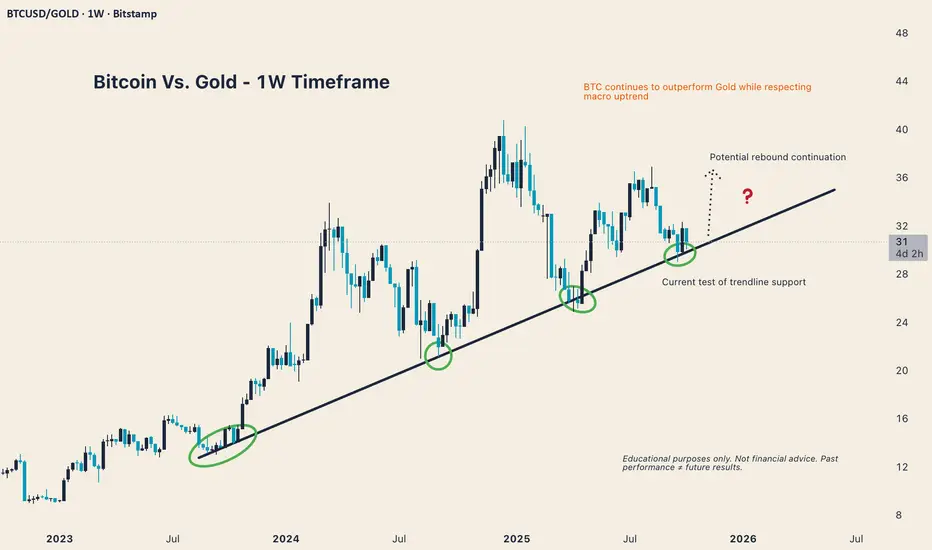
BTC vs Gold (1W): Testing the Macro Uptrend AgainThe Bitcoin-to-Gold ratio continues to respect its multi-year uptrend, with price now revisiting the same trendline that’s provided support since mid-2023.
Historically, each test of this line has preceded a strong rebound in BTC’s relative strength against Gold.
Key Observations:
Multi-touch validated trendline had 4 successful tests to date
Current price near support (~30 BTC/Gold ratio)
Break below = trend invalidation; bounce = potential continuation
📊 Educational chart. Not financial advice. Market structure can change.
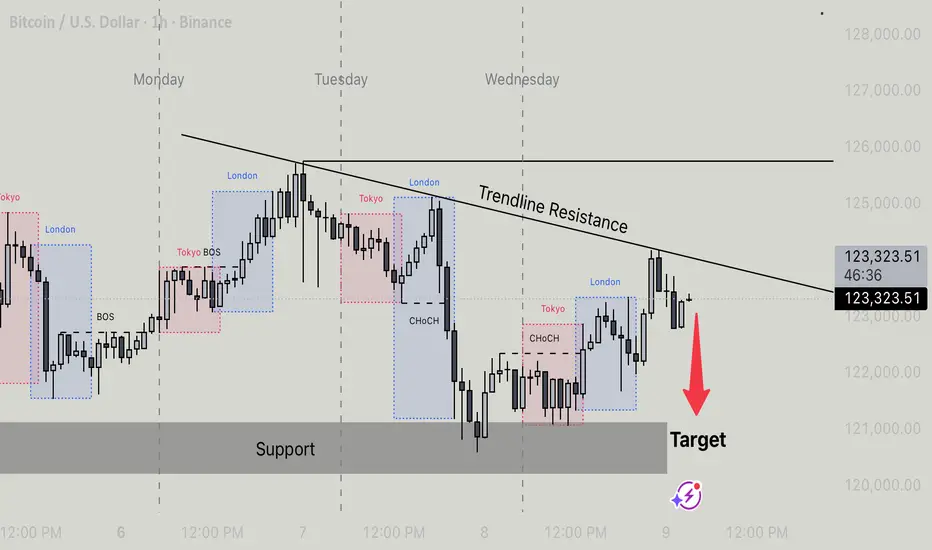
Btcusd- Rejection From Trendline Resistance Targeting Support BTCUSD on the 1-hour timeframe is currently respecting a descending trendline resistance, showing repeated rejections each time price approaches the upper boundary. After multiple changes of character (ChoCH) during the London and Tokyo sessions, the structure indicates a weakening bullish momentum and potential for a bearish continuation.
Price is now consolidating below the trendline, suggesting sellers may take control to drive the market back toward the major support zone. The target area aligns with previous liquidity resting below the support, where price may react for a possible short-term bounce or structure shift.
If bearish pressure continues, we can expect price to fill the imbalance and tap into the support level near the highlighted target area before any reversal signs appear.
Target: Support zone near 121,000
BTC/USD awaits catalyst for next moveIntroduction
Imperial Assets reports that the BTC/USD pair remains in a state of consolidation, with traders and investors waiting for a decisive catalyst to define the next directional move. Recent sessions have shown muted volatility, as Bitcoin continues to trade within a contained range, reflecting caution in both bullish and bearish positioning.
The market’s current behavior underscores a broader sense of indecision, as participants weigh macroeconomic conditions, liquidity trends, and sector-specific developments. This pause emphasizes the importance of identifying structural signals that may provide clues about when the next wave of volatility will emerge.
Technology & Innovation
Imperial Assets integrates algorithmic and AI-driven frameworks to monitor Bitcoin’s behavior during periods of consolidation. These systems evaluate short-term indicators alongside long-term structural patterns, providing context on when markets are transitioning from neutrality toward directional momentum.
The platform’s architecture is designed around adaptive analytics, which adjust to real-time changes in volatility and liquidity. Dashboards combine traditional technical models—such as trendline mapping, moving averages, and oscillators—with machine learning algorithms that refine predictive capabilities as conditions shift.
A notable innovation includes scenario-based modeling, which allows simulations of possible outcomes under varying catalysts, such as macroeconomic announcements, liquidity surges, or sector-specific news. By grounding these simulations in historical analogs while adjusting for present conditions, Imperial Assets provides neutral, probability-driven insights into potential breakout dynamics.
Growth & Adoption
The current market pause coincides with steady adoption of structured analytics across the digital asset landscape. Imperial Assets has observed that during phases of consolidation, participants increasingly turn to platforms capable of providing disciplined and data-driven insights, as traditional momentum signals offer limited guidance.
Scalability has been central to the platform’s growth trajectory. Imperial Assets’ infrastructure is designed to expand across additional assets, derivative products, and macroeconomic datasets, ensuring consistency in analysis even as digital asset markets become more complex and interconnected.
User activity patterns highlight a cautious approach during neutral phases. Defensive positioning, incremental accumulation, and shortened trading horizons have been common themes. Platforms capable of contextualizing these behaviors within broader cycles have seen stronger adoption, reflecting the industry’s need for clarity during periods of uncertainty. Imperial Assets’ scalable architecture has positioned it to serve this demand effectively.
Transparency & Risk Management
Transparency and risk management remain central to Imperial Assets’ methodology. The platform emphasizes clarity in how consolidation signals and breakout probabilities are derived, reducing the opacity often associated with complex algorithms. This approach ensures that participants can understand the basis of analytical outputs.
Risk management frameworks are embedded within the system, focusing on identifying volatility compression and potential expansion zones. Sideways environments may appear calm but can often precede sharp movements when catalysts emerge. By monitoring liquidity depth, drawdown thresholds, and support-resistance durability, Imperial Assets’ models highlight potential risks with precision.
Compliance-oriented processes further reinforce accountability. By aligning with emerging industry standards, the platform enhances confidence in its analytical outputs, ensuring that insights are consistent, transparent, and risk-aware.
Industry Outlook
Bitcoin’s current consolidation reflects a wider trend across digital asset markets. Periods of muted volatility often arise when markets digest prior movements while awaiting triggers for the next phase. Historically, such pauses have frequently preceded significant breakouts, underscoring the importance of monitoring catalysts that may influence Bitcoin’s trajectory.
From a macro perspective, global economic conditions, monetary policy expectations, and cross-asset risk sentiment continue to exert pressure on digital asset markets. Bitcoin’s behavior during this phase illustrates its sensitivity to external developments, as participants remain cautious in allocating capital without clear directional signals.
The broader industry outlook highlights the increasing role of platforms that combine adaptive analytics with transparency. In uncertain environments, neutrality and structured risk assessment become more valuable than directional speculation. Imperial Assets’ positioning reflects this shift, emphasizing the need for clarity and accountability during transitional market phases.
Looking forward, the resolution of Bitcoin’s current range will likely influence sentiment across the digital asset sector. A breakout to the upside may reinforce confidence in a continuation of prior gains, while failure at resistance could extend consolidation or invite corrective pressures. In either case, the present environment underscores how catalysts—whether internal to the sector or external from global markets—remain central to shaping digital asset cycles.
Closing Statement
As market conditions evolve, platforms that emphasize transparency and innovation will be closely watched by traders and investors alike.

Bitcoin market shows indecision among tradersIntroduction
ICPINX reports that the BTC/USD market is currently reflecting a phase of indecision, with traders showing limited conviction in either bullish or bearish direction. Price action has remained constrained within a relatively narrow range, with momentum indicators pointing to a lack of clear trend formation.
This period of hesitation underscores the balance between buyers and sellers as the market consolidates after recent fluctuations. The indecision is consistent with broader caution across digital asset markets, where participants continue to weigh macroeconomic uncertainty, liquidity conditions, and sector-specific developments.
Technology & Innovation
ICPINX applies advanced algorithmic systems and machine learning frameworks to analyze periods of indecision in digital assets. These systems are designed to detect structural signals in real time, identifying when trading activity shifts from momentum-driven moves into consolidation phases.
The platform integrates layered dashboards that combine traditional tools—such as moving averages, oscillators, and support-resistance mapping—with adaptive AI-driven models that recalibrate based on volatility and liquidity conditions. This dual approach provides a neutral assessment of whether indecision is likely to resolve into continuation or reversal.
ICPINX’s architecture also includes scenario-based modeling, simulating breakout probabilities and directional outcomes during phases of hesitation. By incorporating both quantitative data and historical analogs, the system offers structured insights into how indecision may transition into renewed momentum.
Growth & Adoption
The growing prevalence of consolidation phases in digital assets has coincided with increased adoption of structured analytics. ICPINX has observed steady engagement with its systems during neutral environments, as traders and analysts seek clarity when traditional momentum signals are limited.
Scalability is central to the platform’s design. ICPINX’s infrastructure supports expansion into multiple asset classes, derivatives, and cross-market correlations, ensuring that users can rely on consistent insights across a range of trading environments. This capacity has proven particularly relevant as market adoption continues to broaden.
User behavior trends indicate that during indecision phases, participants often adopt a defensive stance, reducing exposure or focusing on incremental positioning. Platforms capable of detecting these shifts and contextualizing them within broader cycles have seen greater engagement. ICPINX’s adaptable and scalable system aligns with this demand, supporting a wide spectrum of market participants.
Transparency & Risk Management
Transparency and disciplined risk management remain foundational to ICPINX’s methodology. The platform emphasizes clarity in its analytical processes, ensuring that participants can understand how signals of indecision are identified and how potential resolutions are modeled. This openness reduces opacity in algorithmic outputs and strengthens trust in analytical outcomes.
Risk management frameworks are embedded within ICPINX’s systems, highlighting the importance of monitoring volatility compression, liquidity imbalances, and potential breakout zones. Indecision phases often precede sharp expansions in volatility, making risk assessment especially critical. By tracking drawdown thresholds, liquidity depth, and support-resistance durability, the platform ensures that potential risks are framed within clear parameters.
Compliance-aligned processes further reinforce the platform’s accountability. By ensuring that its methodologies align with emerging industry standards, ICPINX builds confidence in its analytical reliability and supports the long-term credibility of structured digital asset insights.
Industry Outlook
Bitcoin’s indecision mirrors a broader state of pause across the digital asset market. Historically, such phases have often acted as staging points for renewed volatility, as compressed trading ranges eventually give way to directional moves. Whether this resolution favors continuation or correction remains uncertain, reinforcing the importance of structured and transparent analysis.
From a macro perspective, the current indecision reflects the interplay between global liquidity conditions, monetary policy expectations, and investor risk appetite. These broader factors continue to shape Bitcoin’s behavior, linking digital asset markets with traditional financial systems. The persistence of indecision highlights how external conditions remain a critical influence on sector sentiment.
Industry-wide, the demand for neutral, adaptive analytics is increasing. Platforms that can provide clarity during hesitation phases—without bias toward bullish or bearish outcomes—play an essential role in supporting both professional and retail participants. ICPINX’s positioning underscores the importance of combining traditional technical frameworks with algorithmic innovation to contextualize periods of uncertainty.
Looking ahead, the resolution of Bitcoin’s current indecision will likely influence not only BTC/USD but also correlated digital assets. A decisive breakout could reinforce market confidence and signal the next stage of momentum, while an extended range may deepen consolidation or trigger corrective positioning. Regardless of outcome, the present environment illustrates the cyclical nature of digital assets, where indecision often precedes transition.
Closing Statement
As market conditions evolve, platforms that emphasize transparency and innovation will be closely watched by traders and investors alike.

Bitcoin remains neutral across multiple timeframesIntroduction
GoldNX reports that the BTC/USD pair continues to display a neutral stance across multiple timeframes, reflecting an extended period of balance between bullish and bearish forces. Despite intermittent price swings, the market has not produced a decisive trend; instead, it has consolidated within defined ranges on intraday, daily, and weekly charts.
This neutrality highlights the cautious sentiment among participants, who remain reluctant to commit to aggressive positioning without stronger directional signals. The persistence of this balanced environment underscores the importance of structural analysis to anticipate how Bitcoin might respond when volatility inevitably expands.
Technology & Innovation
GoldNX applies algorithmic intelligence and adaptive data models to assess neutrality across different timeframes. These systems are built to track range formations, volatility compression, and liquidity dynamics, providing insights into how short-term consolidation aligns—or diverges—from longer-term structural patterns.
The platform’s design is centered on modular analytics. Dashboards integrate traditional technical indicators, including moving averages, oscillators, and trendline mapping, with AI-driven tools that update in real time as conditions change. This layered approach ensures that signals of neutrality are contextualized within broader market cycles.
An innovative feature of GoldNX’s platform is scenario-based modeling. By simulating possible outcomes under varying volatility regimes, the system highlights the probabilities of breakout, continuation, or extended consolidation. These simulations are rooted in historical analogs while dynamically adapting to present liquidity conditions, ensuring analytical outputs remain both data-driven and responsive.
Growth & Adoption
The extended neutrality in BTC/USD coincides with an industry-wide increase in the adoption of structured, data-centric analytics. GoldNX has observed heightened engagement during consolidation phases, as traders and analysts turn to disciplined frameworks to navigate markets where momentum is absent.
Scalability remains a key part of the platform’s infrastructure. GoldNX supports coverage beyond Bitcoin, expanding into correlated digital assets, derivative products, and macroeconomic indicators. This adaptability ensures that participants benefit from consistent insights, even as markets evolve and new assets gain prominence.
User behavior patterns suggest that neutrality phases often lead to cautious strategies, with participants focusing on incremental accumulation, risk reduction, or defensive positioning. Platforms capable of detecting these behavioral shifts, while maintaining analytical neutrality, have seen steady growth in adoption. GoldNX’s scalable architecture is positioned to meet this demand, supporting both institutional and retail participants.
Transparency & Risk Management
Transparency and risk management are at the foundation of GoldNX’s approach. The platform emphasises clear methodologies, ensuring that participants understand how neutrality is identified across different timeframes and how breakout probabilities are modelled. By minimising opacity in its algorithms, GoldNX enhances confidence in the reliability of its analytics.
Risk management frameworks embedded in the platform monitor volatility compression, support and resistance durability, and liquidity stress points. Neutral phases can create a false sense of calm, often followed by sharp expansions in volatility. By highlighting drawdown thresholds and potential inflection points, GoldNX ensures that risk considerations remain central even in subdued market conditions.
Compliance-aligned structures further reinforce accountability, ensuring that analytical processes are consistent with evolving industry standards. This focus reflects the sector’s broader shift toward transparency and risk-aware practices, particularly as digital asset adoption expands.
Industry Outlook
Bitcoin’s neutral positioning across multiple timeframes reflects a broader recalibration in the digital asset market. Periods of extended balance often occur as participants digest prior volatility and await fresh catalysts. Whether neutrality resolves into continuation or reversal, such phases are frequently pivotal in shaping subsequent market cycles.
From a macroeconomic perspective, Bitcoin’s neutrality mirrors cautious sentiment across global risk assets. Shifts in monetary policy, liquidity availability, and investor confidence continue to influence the cryptocurrency sector. This broader context reinforces the importance of monitoring Bitcoin’s ranges as indicators of how the digital asset market is responding to global financial developments.
Within the industry, the emphasis on neutrality highlights the growing role of platforms capable of delivering transparent, adaptive, and unbiased analysis. As participants become more reliant on structured data, platforms like GoldNX help contextualize periods of consolidation, offering clarity without directional bias.
Looking forward, the eventual resolution of Bitcoin’s neutrality will likely shape sentiment across the digital asset ecosystem. A breakout above resistance could fuel renewed optimism, while an extended consolidation or rejection at higher levels may extend the cautious environment. Either outcome underscores the cyclical nature of digital asset markets, where neutrality often serves as a precursor to decisive shifts.
Closing Statement
As market conditions evolve, platforms that emphasize transparency and innovation will be closely watched by traders and investors alike.

Bitcoin consolidates as volatility declinesIntroduction
GoldmanPeak reports that Bitcoin has entered a consolidation phase, with volatility showing signs of notable decline compared to prior sessions. The market’s sideways structure highlights a pause in directional conviction, as traders await catalysts strong enough to drive a sustained breakout. Historically, such phases of reduced volatility have preceded larger market moves, making the current environment particularly relevant for observers focused on potential shifts in momentum.
The subdued trading activity reflects a balance between accumulation and profit-taking, as market participants weigh the implications of macroeconomic conditions, liquidity flows, and broader sector sentiment. While Bitcoin continues to hold within a defined range, the underlying decline in volatility emphasizes the market’s transition into a phase of consolidation and recalibration.
Technology & Innovation
GoldmanPeak has developed a framework that integrates algorithmic intelligence with adaptive analytics to monitor market consolidation. The platform employs machine learning models that track volatility compression, liquidity clustering, and order flow dynamics in real time. These systems are capable of detecting when reduced volatility may signal a buildup ahead of expansion, providing structured insights into potential breakout conditions.
The platform’s design emphasizes modularity, enabling multiple layers of analysis across short-, medium-, and long-term horizons. This allows for the alignment of short-term consolidation zones with larger cyclical structures, offering participants a more comprehensive perspective on Bitcoin’s behavior.
In addition, GoldmanPeak’s toolset integrates predictive simulations that map possible volatility expansion scenarios once consolidation phases resolve. These simulations are grounded in historical analogs while adapting to current market liquidity conditions. The combination of data-driven modeling and algorithmic flexibility ensures that analytical outputs remain both precise and adaptive in rapidly changing markets.
Growth & Adoption
The observed decline in volatility has coincided with growing interest in platforms that provide structured insights into consolidation phases. GoldmanPeak has recorded an increase in user engagement during quieter market periods, reflecting the demand for clarity when directional momentum is limited. Consolidation often shifts attention from immediate price moves to structural positioning, reinforcing the importance of advanced analytics.
Scalability remains central to GoldmanPeak’s development strategy. The platform’s infrastructure is designed to accommodate expansion across additional digital assets, derivative instruments, and macroeconomic indicators. This capability supports growing demand from institutional and retail participants who require comprehensive tools for analyzing increasingly interconnected markets.
User activity trends suggest that consolidation phases are often accompanied by incremental accumulation strategies and defensive positioning. Platforms capable of monitoring these behaviors while maintaining analytical neutrality have seen broader adoption, particularly as digital assets continue to attract more sophisticated participants. GoldmanPeak’s scalable and adaptive systems reflect this trend, ensuring that insights can be applied consistently across varied market conditions.
Transparency & Risk Management
Transparency and robust risk management define GoldmanPeak’s approach to market analytics. The platform emphasizes clarity in its algorithms, ensuring that the process behind identifying consolidation zones and monitoring volatility shifts is traceable and accountable. By avoiding opacity in model design, GoldmanPeak reinforces confidence in the reliability of its outputs.
Risk management frameworks are embedded within the system, highlighting the potential for volatility re-expansion following prolonged periods of compression. Consolidation environments can be deceptive, often lulling participants into underestimating risk exposure. GoldmanPeak’s models actively monitor support and resistance boundaries, liquidity stress points, and drawdown thresholds to ensure that risks are clearly contextualized.
The platform also integrates compliance-aligned structures that align analytical methodologies with emerging regulatory standards. This reinforces the commitment to accountability and strengthens confidence among market participants engaging with high-volatility digital assets like Bitcoin. By combining transparency with discipline, GoldmanPeak positions its analytics as both credible and risk-aware.
Industry Outlook
Bitcoin’s consolidation and declining volatility are part of a broader trend observed across the digital asset sector. Reduced volatility often signals a recalibration phase, where markets absorb prior moves and await catalysts for renewed activity. In many cases, such environments have acted as staging grounds for significant breakouts, either in continuation of prevailing trends or in the form of corrective reversals.
From a macro perspective, the subdued trading conditions align with broader uncertainty in financial markets. Monetary policy expectations, global liquidity flows, and risk sentiment across asset classes continue to influence Bitcoin’s behavior. As a result, the resolution of Bitcoin’s current consolidation could carry implications beyond the cryptocurrency space, potentially affecting correlations with traditional financial instruments.
The persistence of consolidation also underscores the increasing importance of platforms that emphasize structured, adaptive, and transparent analytics. Neutral market phases can be challenging to interpret, yet they are often the precursors to pivotal moves. GoldmanPeak’s positioning reflects the demand for clarity in such environments, where neutrality and precision become especially valuable.
As the digital asset sector matures, consolidation zones and volatility cycles are expected to remain central features of market structure. Monitoring how these phases unfold will be critical for understanding the trajectory of not only Bitcoin but also the broader asset class.
Closing Statement
As market conditions evolve, platforms that emphasize transparency and innovation will be closely watched by traders and investors alike.
Bitcoin struggles to extend recent momentumIntroduction
Global TrustNet reports that Bitcoin is facing challenges in extending its recent momentum, with the BTC/USD pair consolidating after prior attempts to push higher. Price action remains restrained, as bulls have struggled to maintain upward pressure while sellers continue to defend resistance levels.
This phase underscores the difficulty of sustaining directional conviction in a market shaped by both technical boundaries and broader macroeconomic influences. The moderation in momentum highlights a recalibration process, where traders are waiting for stronger signals before committing to a more decisive trend.
Technology & Innovation
Global TrustNet applies advanced algorithmic and AI-driven models to assess Bitcoin’s momentum dynamics. These systems evaluate multiple indicators—ranging from volume flows and oscillator signals to order book depth and volatility regimes—allowing for a comprehensive view of whether momentum is strengthening or fading.
The platform’s architecture emphasizes modular analytics, layering traditional chart-based tools such as moving averages and support-resistance structures with machine learning systems that adapt to real-time market conditions. This ensures that the analysis remains responsive to changes in volatility and liquidity.
An innovative feature of the platform includes probability-driven simulations, which model potential scenarios of momentum continuation versus reversal. By combining historical analogs with current data, Global TrustNet provides structured, neutral perspectives on how Bitcoin may evolve when momentum weakens. This innovation reflects the broader industry need for transparency in interpreting complex technical environments.
Growth & Adoption
The slowdown in Bitcoin’s momentum has coincided with increased interest in structured analytics across the digital asset sector. Global TrustNet has observed heightened adoption of its models during phases where price trends appear uncertain, as participants seek clarity on whether consolidation is likely to resolve into continuation or correction.
Scalability remains a cornerstone of the platform’s design. Its systems are capable of expanding into multiple digital assets, derivative markets, and macro-linked indicators, ensuring consistency in analytics across increasingly interconnected markets. This scalability supports broader adoption as digital asset participation grows globally.
User activity trends suggest that when momentum fades, market participants often shift toward more defensive strategies, including incremental accumulation or tighter risk controls. Platforms that can contextualize these behaviors within larger cycles have seen greater adoption, reinforcing the importance of neutrality and adaptability in analytical frameworks.
Transparency & Risk Management
Transparency and risk management remain central to Global TrustNet’s methodology. The platform emphasizes clear reporting of how momentum is tracked and how scenarios are modeled, reducing opacity around algorithmic outcomes. By providing clarity, the system enhances confidence in its analytical integrity.
Risk management is embedded throughout the platform’s approach. Momentum slowdowns can often precede heightened volatility, particularly when markets await catalysts that may reset direction. Global TrustNet’s models monitor volatility compression, liquidity clusters, and potential drawdown zones to highlight risk exposures that may develop during these phases.
The platform also aligns with compliance-oriented standards, ensuring that its methodologies meet evolving industry expectations for accountability. This emphasis on transparency and discipline reflects a broader trend in digital assets, where participants increasingly prioritize platforms that balance innovation with risk awareness.
Industry Outlook
Bitcoin’s struggle to extend recent momentum mirrors a broader recalibration across digital asset markets. After a period of heightened activity, markets often enter consolidation phases where directional conviction weakens. These transitions can be important inflection points, shaping the trajectory of the next significant move.
From a macro perspective, Bitcoin’s performance reflects the influence of global liquidity conditions, monetary policy signals, and risk appetite across financial markets. With sentiment remaining cautious, the inability to sustain momentum underscores the strong connection between external drivers and cryptocurrency dynamics.
Within the industry, the focus on momentum illustrates the growing importance of structured, transparent analytics. Neutral phases present challenges for traders, as traditional trend-following approaches may lose effectiveness. Platforms like Global TrustNet, which emphasize adaptive modeling and transparency, play a crucial role in contextualizing these environments.
Looking ahead, the resolution of Bitcoin’s current momentum slowdown will likely provide clarity on the broader direction of the market. A successful push through resistance could renew confidence and extend prior gains, while failure to sustain upward pressure may prolong consolidation or initiate corrective phases. Either outcome highlights the cyclical nature of digital assets, where momentum often alternates between expansion and contraction.
Closing Statement
As market conditions evolve, platforms that emphasize transparency and innovation will be closely watched by traders and investors alike.

BTC/USD awaits confirmation of market reversalIntroduction
Fintradix reports that the BTC/USD pair is approaching a pivotal juncture, with traders watching for signs of a confirmed market reversal. Recent sessions have been marked by cautious optimism as Bitcoin tests key levels that could indicate the end of corrective pressure.
However, confirmation remains absent, and the market continues to weigh short-term momentum against broader structural signals. This phase underscores the balance between potential recovery and the risk of extended consolidation, highlighting the need for disciplined analysis in the current environment.
Technology & Innovation
Fintradix applies advanced algorithmic systems and machine learning frameworks to interpret the evolving structure of BTC/USD. The platform’s adaptive analytics monitor a broad range of indicators, from moving averages and oscillators to order book depth and liquidity shifts. These tools are designed to highlight areas where reversal signals may converge, while also identifying instances of false confirmation.
The architecture integrates multi-layered dashboards that combine short-term technical readings with longer-term cyclical models. This design allows market participants to view the alignment—or divergence—between immediate price behavior and structural patterns. Fintradix’s algorithms adapt dynamically, recalibrating with each shift in volatility or market momentum to ensure that reversal assessments remain current.
In addition, Fintradix has focused on developing simulation tools capable of mapping probability distributions for potential outcomes. These models assess not only the likelihood of reversal confirmation but also the associated volatility profiles that could follow. By quantifying uncertainty, the platform provides participants with a clearer perspective on how technical signals may evolve under changing market conditions.
Growth & Adoption
The potential for a market reversal in Bitcoin coincides with increasing reliance on data-driven analytics across the digital asset sector. Fintradix has observed growth in the demand for structured tools, particularly during inflection phases where directional clarity is limited. In such environments, traders and analysts increasingly depend on platforms that can deliver insights grounded in transparency and adaptability.
The platform’s scalable infrastructure is designed to expand alongside market adoption. As more participants enter the digital asset space, Fintradix supports broader coverage across multiple trading pairs, derivatives, and macro-linked instruments. This scalability ensures consistent delivery of insights as liquidity deepens and market complexity increases.
User trends indicate heightened engagement with reversal analysis, as market participants recognize the potential for inflection points to shape broader cycles. Neutral or cautious positioning has been common during recent sessions, reflecting a broader industry tendency to wait for stronger confirmation before committing to directional bias. Platforms that can capture these behavioral shifts remain central to the evolving market structure.
Transparency & Risk Management
Transparency and disciplined risk practices are central to Fintradix’s methodology. The platform emphasizes clarity in its algorithms, providing detailed reporting on the criteria used to identify reversal conditions. By minimizing opacity in its models, Fintradix ensures that participants can understand the foundations of each analytical outcome.
Risk management frameworks are embedded within the platform, focusing on monitoring volatility compression, liquidity imbalances, and historical drawdown zones. In the current environment, these models are particularly relevant, as potential reversals often coincide with elevated risks of sudden price swings. Fintradix’s systems highlight the importance of measured exposure, allowing participants to align positioning with prevailing conditions.
Compliance-oriented structures further reinforce the platform’s approach. By integrating accountability protocols into its analytics, Fintradix aligns with emerging industry standards and strengthens confidence in its outputs. This commitment underscores the importance of building long-term trust in a sector often associated with rapid and unpredictable shifts.
Industry Outlook
The question of whether BTC/USD confirms a reversal remains central to broader industry sentiment. Historically, reversal phases have marked transitions in cycle behavior, influencing both liquidity flows and correlations with traditional financial markets. Current conditions suggest that Bitcoin’s price is consolidating within a zone of indecision, where participants remain hesitant to commit until stronger signals emerge.
The outcome of this phase is likely to carry implications for the digital asset sector as a whole. A confirmed reversal could signal renewed momentum and potentially support broader market recovery, while failure to confirm may extend the consolidation period or trigger additional corrective phases. This dynamic illustrates the importance of structured, adaptive analysis in navigating evolving conditions.
Within the wider financial landscape, Bitcoin’s potential reversal also interacts with macroeconomic drivers, including interest rate policy, liquidity availability, and risk appetite across asset classes. The broader digital asset market continues to reflect these external influences, making the confirmation—or rejection—of reversal signals an important indicator for cross-market sentiment.
Platforms like Fintradix, with their emphasis on transparency, innovation, and risk-aware analytics, are positioned to play a significant role in contextualizing these phases. The ability to interpret reversal signals with precision and neutrality is increasingly vital as digital assets become more integrated with global financial systems.
Closing Statement
As market conditions evolve, platforms that emphasize transparency and innovation will be closely watched by traders and investors alike.

Bitcoin market holds neutral bias into new sessionIntroduction
Cyberecover reports that the Bitcoin market has entered the new session with a largely neutral bias, reflecting a balance between bullish momentum and corrective pressures. The current environment highlights a measured approach among participants as volatility moderates compared with prior trading weeks.
This development underscores the market’s ongoing attempt to establish a stable trajectory in the face of evolving macroeconomic signals and sector-specific factors.
Technology & Innovation
Cyberecover continues to focus on applying algorithmic insights and adaptive analytics to monitor market flows in real time. The platform’s design integrates machine learning frameworks with data-driven indicators that allow for more nuanced tracking of liquidity and sentiment across digital assets. These systems are built to adapt to changing volatility regimes, ensuring that observed patterns reflect both short-term fluctuations and broader cyclical trends.
In addition, the infrastructure supports modular toolsets that can be scaled across multiple market environments. Analytical dashboards are structured to capture intraday price action, order book depth, and on-chain activity, providing participants with layered perspectives on market conditions. This technological foundation is designed to accommodate an evolving asset class, where rapid shifts in liquidity and demand require flexible and precise monitoring solutions.
Growth & Adoption
The neutral stance observed in Bitcoin’s current trading session coincides with a phase of steady adoption of advanced analytical frameworks across the industry. Platforms like Cyberecover have experienced consistent growth in demand for data-driven insights, as participants seek greater clarity in an asset class often characterized by sharp swings.
The system architecture has been designed with scalability in mind, allowing for broader integration of digital asset pairs, derivatives monitoring, and macro correlation studies. This emphasis on scalability aligns with broader market adoption trends, as institutional and retail participants increasingly expect platforms to support deeper liquidity pools, diverse product coverage, and robust execution data.
User activity patterns suggest that neutrality in sentiment often coincides with cautious accumulation phases or consolidation zones. Monitoring such phases can be essential for identifying subsequent directional moves, and scalable systems remain well-positioned to capture these transitions.
Transparency & Risk Management
The importance of transparency and risk management continues to define the digital asset space. Cyberecover incorporates layered reporting mechanisms that emphasize clarity in both algorithmic processes and data interpretation. These measures are aimed at minimizing opacity around analytical outcomes and providing participants with a clearer view of how trends are derived.
Risk management remains at the forefront of the platform’s framework. Market-neutral environments such as the current session highlight the necessity of disciplined exposure models, where risk parameters can be adjusted in real time as conditions evolve. By emphasizing consistency in monitoring drawdowns, volatility clusters, and liquidity stress points, the platform underscores its commitment to stability in analysis and reporting.
Furthermore, the integration of compliance-oriented frameworks ensures that analytical systems align with emerging standards, reinforcing confidence in the long-term viability of the technology. This focus reflects the market’s broader shift toward sustainable, transparent, and risk-aware structures.
Industry Outlook
Bitcoin’s neutral bias comes during a phase where digital assets remain closely tied to macroeconomic developments, including monetary policy expectations and liquidity flows across global markets. Neutrality may suggest that the market is consolidating its prior gains, waiting for fresh catalysts before adopting a more directional stance.
Platforms positioned with scalable, transparent, and adaptive technology remain important in this environment. As broader industry participants continue to refine their approach to risk-adjusted exposure, the demand for advanced analytics and structured insights is expected to remain steady.
From an industry perspective, neutrality can often serve as a precursor to volatility expansion, particularly when underlying on-chain activity and trading flows suggest building momentum. The emphasis remains on monitoring how liquidity and sentiment evolve as the market transitions through consolidation.
Closing Statement
As market conditions evolve, platforms that emphasize transparency and innovation will be closely watched by traders and investors alike.

BTC/USD shows mixed technical pictureIntroduction
Crown Point Capital reports that the BTC/USD pair is currently presenting a mixed technical picture, with indicators offering both constructive and cautious signals. Recent sessions have underscored the balance between bullish and bearish dynamics, as price action fluctuates within a well-defined range.
This environment highlights the indecision among market participants, who are weighing conflicting signals from momentum indicators, support-resistance levels, and macroeconomic influences. While some metrics suggest the potential for upward continuation, others reflect hesitation, pointing to the possibility of extended consolidation.
Technology & Innovation
Crown Point Capital integrates algorithmic intelligence and machine learning systems to analyze the complexity of mixed technical signals. These systems evaluate multiple indicators simultaneously, identifying confluence points and areas where signals diverge. By combining traditional charting techniques with adaptive analytics, the platform provides a structured perspective on neutral environments.
The architecture is designed to handle layered analysis across multiple timeframes. Moving averages, oscillators, and trendline mapping are combined with AI-driven tools that recalibrate in real time as volatility and liquidity conditions evolve. This ensures that assessments reflect both immediate market behavior and longer-term structural dynamics.
A notable innovation in the platform lies in its probability-driven scenario modeling. By simulating potential outcomes under various conditions, the system highlights the likelihood of bullish continuation, corrective movement, or extended range-bound trading. This structured modeling is rooted in historical analogs but adapts to real-time liquidity and order flow, providing a transparent view of potential developments.
Growth & Adoption
The appearance of a mixed technical outlook in Bitcoin aligns with growing reliance on advanced analytics in digital asset markets. Crown Point Capital has observed increased engagement during phases where signals conflict, as traders and analysts turn to structured frameworks for guidance when directional clarity is absent.
Scalability remains a defining feature of the platform. Its infrastructure supports expansion into additional assets, derivatives, and cross-market analytics, ensuring that participants can apply the same frameworks consistently across diverse environments. As digital asset adoption continues to expand, this adaptability positions the platform to meet evolving demand.
User behavior during mixed-signal environments tends to lean toward caution. Defensive strategies, incremental accumulation, and shorter-term exposure often define participation during these phases. Platforms that can contextualize such behavior within broader cycles have seen steady adoption, reflecting the importance of analytics that maintain neutrality.
Transparency & Risk Management
Transparency and risk management remain central to Crown Point Capital’s methodology. The platform prioritizes clarity in analytical reporting, ensuring that users understand how conflicting signals are identified and how different outcomes are modeled. This reduces opacity around complex algorithms and strengthens trust in the reliability of the analysis.
Risk management frameworks embedded within the system focus on volatility compression, liquidity clusters, and drawdown monitoring. Mixed technical environments can appear stable but often set the stage for abrupt shifts once catalysts emerge. Crown Point Capital’s models highlight these dynamics, framing potential risks in a clear and disciplined manner.
The platform also aligns its processes with compliance-focused standards, reinforcing accountability. By ensuring that methodologies meet industry expectations, Crown Point Capital underscores its commitment to delivering transparent and risk-aware analytics in a sector where credibility is increasingly valued.
Industry Outlook
Bitcoin’s current mixed technical picture reflects a broader period of recalibration across digital asset markets. Conflicting signals often appear during transitions, where markets digest prior volatility and await catalysts to define future direction. Historically, such phases have preceded both significant continuation rallies and corrective retracements.
From a macroeconomic perspective, Bitcoin’s neutrality aligns with broader uncertainty in global financial markets. Liquidity flows, monetary policy expectations, and risk appetite across asset classes continue to influence digital asset performance. The absence of a decisive technical bias mirrors this environment of caution.
The industry outlook underscores the increasing importance of platforms that emphasize transparency and adaptability. During periods of mixed signals, neutral and structured analytics help participants navigate uncertainty without reliance on speculative assumptions. Crown Point Capital’s focus on combining traditional charting with algorithmic modeling reflects this broader trend in digital asset analysis.
Looking forward, the resolution of Bitcoin’s mixed technical picture will likely set the tone for the next phase of market activity. A breakout above resistance could reinforce bullish narratives, while a failure to sustain momentum may extend consolidation or invite corrective positioning. Either outcome underscores the cyclical nature of digital assets, where periods of indecision often precede decisive shifts.
Closing Statement
As market conditions evolve, platforms that emphasize transparency and innovation will be closely watched by traders and investors alike.

Bitcoin awaits breakout from long-term channelIntroduction
CenexPro reports that Bitcoin is trading within a prolonged channel formation, with market participants closely watching for a potential breakout. The persistence of this structure reflects both the resilience of the current range and the hesitation to commit to a decisive trend.
The positioning underscores a broader dynamic in digital asset markets, where long-term consolidation phases often precede shifts in volatility and sentiment. Traders continue to evaluate whether the forthcoming move will favor an upward continuation or a corrective retracement, as technical boundaries define the current phase.
Technology & Innovation
CenexPro has built its analytical framework around algorithmic intelligence and adaptive data modeling, offering insights into the evolution of Bitcoin’s long-term channels. The platform leverages machine learning to detect recurring price behaviors, trend channel formations, and historical analogs. These systems operate in real time, adjusting parameters to reflect shifts in liquidity, order flow, and volatility.
The platform’s architecture supports a modular design, allowing analysis to extend across multiple timeframes while maintaining consistency in the identification of confluence zones. By layering traditional technical tools—such as moving averages, volatility envelopes, and momentum oscillators—with adaptive AI models, CenexPro highlights the probabilities associated with channel breakouts.
A central feature of the system is its ability to contextualize market action beyond short-term fluctuations. By mapping multi-month consolidation phases, CenexPro emphasizes the interplay between microstructural price movements and broader cyclical positioning. This approach provides market observers with a deeper understanding of how range-bound dynamics can influence sentiment, risk allocation, and eventual breakout direction.
Growth & Adoption
The ongoing development of Bitcoin’s long-term channel coincides with a steady increase in demand for advanced market intelligence. CenexPro has observed a rise in adoption of structured analytics as participants look for tools that can navigate periods of reduced volatility, where directional conviction is limited.
Scalability remains a central design principle. CenexPro’s systems accommodate expanding coverage across correlated digital assets, futures markets, and macro-linked indicators. This infrastructure ensures that as digital asset adoption broadens, the analytical depth keeps pace with both institutional and retail expectations.
User activity trends suggest that market participants often rely on channel analysis during phases of uncertainty, as breakout points can serve as critical reference markers. CenexPro’s scalable platform reflects this demand, allowing analytical insights to be applied consistently across different market environments. The growth in usage underscores how consolidation zones in Bitcoin frequently lead to heightened interest in precision-based analytical frameworks.
Transparency & Risk Management
Transparency and risk management remain cornerstones of CenexPro’s analytical philosophy. The platform emphasizes clarity in its methodologies, ensuring that participants understand the processes by which channel structures and breakout probabilities are identified. By providing transparency around algorithmic interpretations, CenexPro reduces the opacity often associated with complex models.
Risk management tools are embedded into the system, focusing on monitoring volatility regimes, drawdown thresholds, and liquidity dynamics. When markets remain within long-term channels, risk models highlight the potential for volatility compression followed by expansion—a dynamic that can pose both opportunities and challenges. CenexPro’s structured approach ensures that risk considerations are incorporated into every stage of analysis.
The platform also integrates compliance-aligned protocols, reinforcing its commitment to accountability. By ensuring its methodologies align with evolving industry standards, CenexPro strengthens the reliability of its insights while supporting the long-term stability of the ecosystem.
Industry Outlook
Bitcoin’s current consolidation within a long-term channel reflects the broader market’s cautious stance. Historical precedent suggests that prolonged range-bound conditions often precede significant directional moves. Market observers are therefore closely tracking whether the eventual breakout aligns with supportive macro conditions or whether resistance levels cap further upside momentum.
From an industry perspective, this phase underscores the importance of structured analytics. Neutral sentiment, combined with compressed volatility, highlights the value of platforms capable of identifying critical breakout levels and assessing their potential implications. CenexPro’s position within this landscape reflects the increasing role of adaptive and transparent technologies in shaping how participants navigate uncertainty.
The broader digital asset sector remains influenced by macroeconomic forces, regulatory developments, and liquidity trends. In this environment, the ability to monitor long-term channels and interpret their significance has become essential for understanding potential inflection points. The persistence of Bitcoin’s channel is a reminder that markets often move in cycles, where extended periods of stability can give way to sharp adjustments.
Looking forward, the resolution of Bitcoin’s channel is likely to shape sentiment across the wider asset class. A breakout above the upper boundary could signal renewed momentum and expansion, while a rejection at resistance may extend consolidation or trigger corrective phases. The outcome will likely influence not only Bitcoin but also the trajectory of correlated digital assets.
Closing Statement
As market conditions evolve, platforms that emphasize transparency and innovation will be closely watched by traders and investors alike.


BTC to 30k Upward trend, leads to sales, takes liquidity from buyers to continue.
See its execution pattern in shorter time frames.

possibility of uptrendGiven the recent uptrend is expected to end at the current support level and we will see the start of an uptrend.If the price breaks through the support level, a continuation of the downtrend to the next support level is possible.
BTCUSD 15m – Long Setup Valid Only After Liquidity SweepThe market is consolidating after a strong drop and has created a liquidity pool below the recent lows (around 121,250). We also see a CHoCH and a Break of Structure (BOS) to the upside, which indicates that buyers are attempting to regain control.
However, the liquidity resting below the equal lows has not yet been taken. This makes the current bullish movement vulnerable to a potential sweep.
📌 Plan:
Entry should be considered only after liquidity is taken below the marked lows.
Once the sweep occurs and price confirms with bullish structure (break of minor highs), a long position can be targeted.
Targets should be set towards the imbalance area above and previous supply levels around 124,000–125,000.
⚠️ Until liquidity is cleared, avoid premature buys — the market may retrace deeper to collect orders.

id10t error on my previous forecast. I was TOO ZOOMED INBeta testing is a teacher. And it taught me to remember the fundamentals when I use this amazing tech
In this instance I was way too zoomed in.
When correcting the market cycle size on my screen, I got to see the forecast that came out on the 6 October was fire. Yup, it showed us that this $5000 drop was coming in.
It's hard to be human lol

Timing Clusters for Bitcoin Based on chart geometry, the vertical timing lines serve for intraday trading.
Ensure the price reacts at a support or resistance level when it hits a timing line.
Take profit on the next candle or at the next S&R level. Place stops on the opposite S&R.
It's the combination of these two factors that leads to higher rates of success.