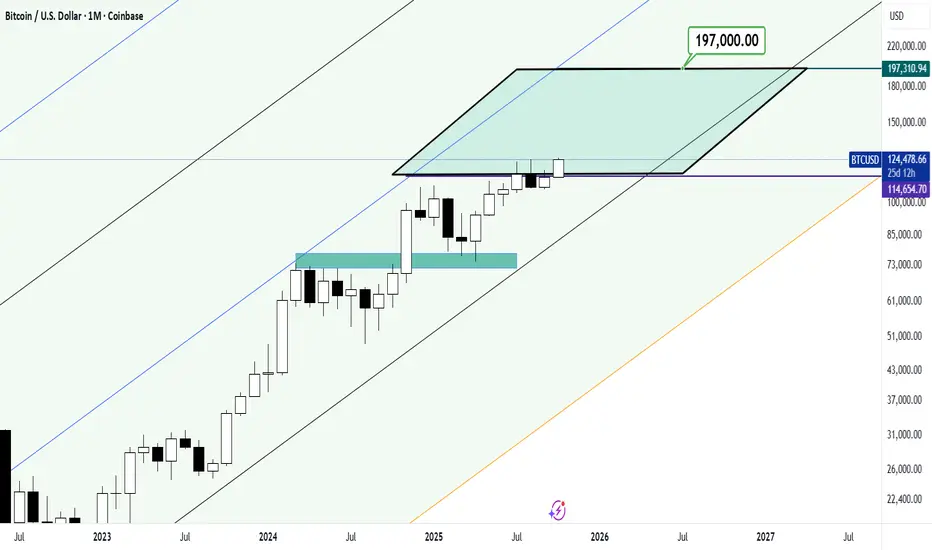
How long will the price stroking continue on the Bitcoin chart?A long-term analysis of Bitcoin’s trend suggests that we should expect a continued bullish trend in the coming months!
A price range of $197,000 per Bitcoin may seem far-fetched, but it would be very desirable and appealing to holders of this asset!!
Good luck!
BTCUSD.PI trade ideas
BITCOIN - ONLY JOURNALING - LONGThose are trades I observed but didn’t execute. I’m sharing them just to journal my ideas and improve my system.
The structure was respected twice since I started monitoring Bitcoin over the past few days.

Taurus Acquisition Review: Bitcoin Retreats After New RecordBitcoin Retreats After New Record: ETF Inflows Remain the Key Driver
Bitcoin pulled back slightly on Monday after setting a new all-time high over the weekend. Following a breakout above $125,000, the cryptocurrency is trading with a modest decline amid continued inflows into U.S. spot Bitcoin ETFs and growing concerns over the ongoing U.S. government shutdown.
As of 06:50 Moscow time, Bitcoin was down 1.6%, trading at $123,716.7 after hitting a record high of $125,617.4 on Sunday.
Over the past week, the leading cryptocurrency gained more than 11%, and since the start of 2025, it has risen about 30%, reflecting steady institutional interest in digital assets.
ETF Inflows and the “Debasement Trade”
According to data from SoSoValue, net inflows into U.S. spot Bitcoin ETFs totaled $3.24 billion over the past week — the largest weekly increase in 2025 so far.
The surge highlights renewed institutional participation, with investors opting for regulated financial instruments instead of direct crypto purchases.
This activity also coincides with mounting anxiety over the ongoing U.S. government shutdown, now entering its second week.
The political standoff in Washington has delayed the release of several key economic indicators and heightened uncertainty around fiscal policy. This has led traders to expect the Federal Reserve to adopt a more cautious stance on interest rates once government operations resume.
Analysts describe this trend as a “debasement trade” — when investors rotate into perceived safe-haven assets like Bitcoin and gold amid eroding confidence in fiat currencies and rising debt burdens.
OnePay Expands Into Crypto Trading
According to CNBC, fintech company OnePay, partially owned by Walmart (NYSE:WMT), plans to roll out cryptocurrency trading and custody features in its banking app by the end of the year.
Sources indicate that users will be able to access Bitcoin and Ether through a partnership with crypto infrastructure provider Zerohash.
The company — majority-owned by Walmart and venture capital firm Ribbit Capital — is evolving into a comprehensive digital financial ecosystem. The new crypto service will complement its existing suite of accounts, cards, and “buy now, pay later” options, making OnePay a one-stop platform for digital finance.
Altcoins Consolidate After Gains
Following a sharp rally last week, most altcoins traded in narrow ranges on Monday.
Ethereum (ETH) slipped 1% to $4,528.65 after gaining more than 10% the previous week.
XRP dropped 2% to $2.97, retracing part of its 5% weekly rise.
Solana (SOL) declined 1%, Cardano (ADA) fell 3.5%, and Polygon (MATIC) eased 1.3%.
Among meme tokens, the correction continued as Dogecoin (DOGE) fell 2.5%, and $TRUMP slipped 1.2%.
After setting a new record high, Bitcoin is undergoing a natural correction, but investor interest in ETFs remains the main driver supporting the market. Amid geopolitical uncertainty and expectations of a more dovish Federal Reserve, cryptocurrencies continue to serve as a hedge against fiat currency risks.

BITCOIN IS IN A TRIANGLE UNTIL THE END OF 2025: EVERYTHING WILL 📣 Hello everyone!
I bring to your attention my medium-term view until the end of 2025 within the framework of this Bitcoin trading idea solely from the point of view of TA and my understanding of the chart.
🔹 Briefly and to the point:
1️⃣ I believe that Bitcoin's growth in October will be limited and right now the price is already close to local highs.
2️⃣ I expect an unexpected, disappointing drop in the BTC price after the recent ATN upgrade to $125,000 at the beginning of the month.
3. Anyone who flew into a long breakout will be thrown out of the market, many will believe in the beginning of a bear market and prematurely open short positions.
4️⃣ In November-December, I expect another small wave of growth, which will push the price of BTC a little over $130,000
5️⃣ I expect big events for Bitcoin in Q1 2026, but more on that later.
That's all for today, I wish you good luck in making independent trading decisions and making a profit. Please analyze the information you receive from me, always think only with your head!
Goodbye! ✊

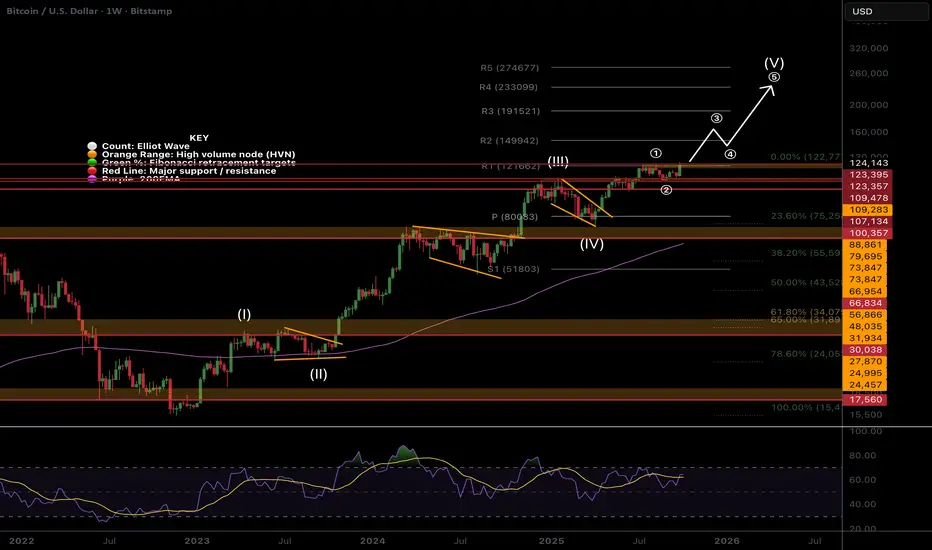
BTC Continues its shallow pullbacks to all time high pattern!This weeks candle bullishly engulfed the entire range showing supply is exhausted and price is ready for the next leg up in Elliot wave wave (3), the powerful wave, especially with a shallow wave (2)!
A word of caution, currently there is a 3 waves up into all time high that resembles a running flat correction which penetrates all time high before retuning the lower range boundaries, 1$08k in this case to complete the correction.
The R2 weekly pivot is the first target at $150k. Weekly RSI continues to print bearish divergence but has come out of overbought and tested the EQ. It is now crossing bullishly. A push into overbought will negate the bearish divergence.
Bitcoin - Bitcoin Breaking Previous Highs!Bitcoin is above EMA50 and EMA200 on the four-hour timeframe and is in its medium-term ascending channel. In case of a downward correction towards the specified demand zones, it is possible to buy Bitcoin with a better risk-reward ratio.
It should be noted that there is a possibility of heavy fluctuations and shadows due to the movement of whales in the market and capital management in the cryptocurrency market will be more important. If the downward trend continues, we can buy within the demand range.
Bitcoin has surged to $125,000, marking the first time in history its market capitalization has exceeded $2.5 trillion.This new record reflects growing investor confidence and renewed capital inflows into the crypto sector—further solidifying Bitcoin’s dominance as the world’s leading digital asset.
Following the IRS’s clarification of the Corporate Alternative Minimum Tax (CAMT) rules, U.S. companies can now benefit from significant tax advantages, potentially saving billions of dollars in unrealized crypto gains.
The U.S. Treasury Department and the IRS issued temporary guidance on September 30 that substantially reduces the tax burden for corporations holding Bitcoin and other digital assets. The new rules explain how the CAMT applies to unrealized gains, a topic that had long concerned corporate treasurers.
The primary goal of these changes is to lower compliance costs and clarify how Adjusted Financial Statement Income (AFSI) should be calculated as the base for CAMT. Companies can immediately apply these temporary exemptions, and similar provisions are expected to appear in future permanent regulations.
The CAMT—introduced under the Inflation Reduction Act of 2022—imposes a minimum 15% tax rate on corporations reporting at least $1 billion in average annual AFSI. Without the new clarification, unrealized crypto gains could have been directly included in AFSI calculations, resulting in substantial paper tax liabilities for large firms.
The change has already affected Strategy Inc. (formerly MicroStrategy), a company that holds over 640,000 Bitcoin. Under the new accounting standards effective January 2025, Strategy will report its Bitcoin holdings at fair market value, with unrealized gains and losses recognized quarterly in its financial statements.
Previously, analysts expected Strategy to become subject to the CAMT in 2026, potentially facing billions in taxes on unrealized Bitcoin profits. However, the new guidelines allow the company to exclude those unrealized gains from AFSI calculations. As a result, Strategy no longer anticipates paying CAMT on its $16 billion Bitcoin reserve, easing the financial pressure on its long-term Bitcoin accumulation strategy.
Given that over 100 publicly traded companies collectively hold more than 1 million Bitcoin, this regulatory shift could further strengthen Bitcoin’s role as a corporate store of value.
Meanwhile, Morgan Stanley, the U.S. investment banking giant, announced that it will support its 16,000 financial advisors—who collectively manage over $2 trillion in assets—in offering clients access to Bitcoin and other cryptocurrencies if they choose to invest.
In a separate development, Andrew Bailey, the Governor of the Bank of England, emphasized that blanket opposition to stablecoins—without considering their real-world use cases or technical frameworks—is misguided.
Elsewhere, the crypto subsidiary of Japan’s SBI Group suffered a cyberattack last week, resulting in the theft of approximately $21 million in digital assets. According to blockchain researchers, including ZachXBT, suspicious withdrawals were detected across several assets such as Bitcoin, Ethereum, Litecoin, Dogecoin, and Bitcoin Cash.
Experts report that the stolen funds were laundered through several crypto exchanges and then funneled into Tornado Cash, a well-known mixing service designed to obscure transaction origins. The pattern of this attack closely resembles operations attributed to the Lazarus Group, a hacking organization believed to be backed by the North Korean government.
Analysts warn that continued use of tools like crypto mixers not only heightens direct market risks but is also likely to trigger tighter regulatory scrutiny worldwide, potentially restricting the free flow of digital assets across borders.

134 k by nov ?This channel is not providing individualized trading or investment advice, nor is it a banking service, brokerage service, trading service, investment service or money management service

Bitcoin Hits $124K—Volume Lags BehindFenzoFx—Bitcoin reached a new all-time high at $124,533.0. While price broke higher, volume lags behind on the cumulative profile. The trend remains bullish, but a pullback is likely.
Retail traders should wait for BTC to dip into the liquidity void (fair value gap) around $116,000.0, offering a discounted entry into the bull market. If BTC/USD closes and stabilizes below this gap, deeper consolidation may follow toward the next support at $111,582.0.

BTC 4-hour - PumpTober- ATH outlook for OCT 2025 It's Friday. It's been pumping PA. While I was making this chart this morning's PA was moving with very healthy volatility. Bulla's are pushing for the ATH. At the same time, if my 12345 leg is correct.. we are waiting for the finalized #3.
Oddly with the ATH at the #3 level... we have no clue what PA will do around the area.
We could have a normal healthy drop to #4 or a very very shallow drop to #4 .... and then ... not realize PA is already on it's way to #5.
With the weekend almost here, we might see the ATH crushed for a Friday's close, with lots of activity.
I will add that, weekends are usually dead, I don't except anything other than, low volatility with PA looking to correct into the #4 low position.
That's my bias for now... if PA doesn't follow this, then my bias will change.
Lastly with this Chart, I used the GannBox again and have some notable FIB targets for #5 (130K - 165K) and timeline is end of Pumptober into November.
There are two future fib target lines graphs.
One is extreme the other is minimal, and thus there is the posted forecasted regions. Until the 3-4 settles, it's still a guess, might as well take a look.
Good Luck

BTC to the moonit's obvious that we can't break the bullish trend so far , as more institutions are adopting crypto, we might see some new all time high soon for the rest of the year.... my previsions are optimistic towards bitcoin 130 k or 133K by the end of the year .... let's celebrate this profitable year together

BTCUSD – Range Distribution | Sweep Incoming (Hybrid Logic)🧠 Market Overview:
Bitcoin is consolidating between 123.5K–124.5K after a strong expansion to 125.5K.
This phase represents a Distribution Range where liquidity is building up on both sides.
The market is preparing for a Sweep + Reclaim setup that could define the next directional move.
📍 Key Levels:
Resistance: 124,500 → 125,500 (Stop Hunt / Magnet Zone)
Midline: 124,000 (Range EQ / Decision Level)
Support: 123,500 → 122,000 (Liquidity Pool – Buy Zone)
⚙️ Scenarios (Hybrid + Magnet + Sweep/Reclaim):
🔺 Scenario A – Up then Trap:
Sweep above 124.5K, fail to hold → drop back to 123.0–122.0K liquidity zone.
🔻 Scenario B – Bullish Reclaim:
If price accepts & reclaims above 124.5K, expect an impulsive push toward 125.5K magnet.
🧭 Market Maker Phase:
Distribution → Sweep → Reaccumulation
⏱ Session Context:
Pre–New York session – volatility starting to expand.
💬 Analyst Note:
No trade inside the range (123.5K–124.0K).
Wait for confirmed Sweep & Reclaim reaction at the edges before engaging.
Clean, high-probability setups only form once liquidity has been taken.
#BTCUSD #PriceAction #SmartMoney #HybridScalper #Liquidity #Sweep #Reclaim #TechnicalAnalysis #Scalping #MarketStructure

$BTC Bearish Divergence Signals Possible Correction Toward 118KBitcoin on the 4-hour chart is flashing a clear bearish divergence — while price is forming a higher high, RSI is slipping into a lower high. 📉
This setup often hints at an upcoming correction phase. Based on the current market structure, 118K appears to be a strong liquidity gap area where a short-term bounce or lower high could form.
However, if BTC loses its footing below 107K, that’s where the real bearish confirmation kicks in. Until then, the 107K support remains the key battleground for bulls to defend. ⚔️
Volume analysis also supports the correction narrative — buying pressure is fading while selling momentum is picking up. Stay alert for a possible test near 118K before the next major move.
#Bitcoin #BTCAnalysis

BTCUSD – Bulls Strong but Overbought! | 4H AnalysisBitcoin (BTCUSD) has rallied sharply from $110K to $124K, gaining strong bullish momentum. Price is now trading well above the 20/50/100/200 SMAs, confirming the uptrend. However, RSI is entering the overbought zone, suggesting a possible short-term pullback before continuation.
🔹 Technicals
Trend: Strong Bullish (above all major SMAs)
Resistance: $124,500 – $126,000
Support: $122,500 (20 SMA), $120,000, $118,000
RSI: Near 70–75 → Overbought, slight bearish divergence
✅ Bullish Case:
If price sustains above $122,500 and breaks $126,000, we may see an extension toward $128,000 – $130,000.
⚠️ Bearish Case (Pullback):
Failure to break $126,000 could trigger a correction toward $120,000 – $118,000 before another leg higher.
📌 Trading Plan
Long Entry (dip-buy): $122,500 – $120,000
Target: $126,000 → $128,000 → $130,000
Stop Loss: Below $118,000
🔑 Summary
Bitcoin remains in a strong bullish trend, but the market is short-term overheated. Best opportunities are on dips or a confirmed breakout above $126K.

BTC - Highest Weekly CloseBTC just had its highest weekly close ever!
Just wanted to post this chart as BTC just closed the highest weekly candle ever. Also, outlined 5 other key weekly levels that could have a significant impact with price in the future!


Bitcoin — Comprehensive Late-Trend RoadmapBitcoin — comprehensive update: late-trend ladder, potential 4→5, and channel targets
Thesis
BTC is advancing inside a rising Elliott channel from the 2022 low. Late in an impulse, wave-5 often terminates near the channel’s upper line (sometimes with a brief throw-over), while momentum divergences frequently appear as higher highs print with weakening oscillators. That combination frames the next weeks: respect channel boundaries for upside targets and require price confirmation for any reversal.
Structure map (what the channel says)
Channeling guideline: after wave-4 is identified, draw a trendline 2→4 and run a parallel through 3 to project the likely wave-5 termination zone; many 5s end at, or just beyond, this upper boundary.
Throw-over risk: a brief penetration of the upper line by wave-5 can precede a major reversal; treat it as terminal unless acceptance above the channel holds on retest.
Levels (prices on the map)
Upside decision ladder — current impulse extensions
1.618 → $126,738 (typical wave-3 target; first decision/scale zone)
1.786 → $128,767 (often tags in strong legs)
2.000 → $131,398 (common wave-5 equality/overthrow checkpoint)
Acceptance through the full ladder shifts focus to the next confluence. (Use standard Fib extension practice from the last clear base.)
Stretch / confluence above
0.618 higher-degree cluster → ~$139,205 (popular profit-taking/reassessment area in crypto trends).
Dynamic channel guidance
Rising median of the 2022-anchored channel ≈ $150k now; linear projection implies ~$156k–$160k if contacted ~4 weeks later, depending on slope. Median/upper lines often act as magnets/termination rails late in trends.
Momentum/diff checklist (confirmation logic)
Bearish divergence = price higher high with RSI/MACD lower high → a warning of trend fatigue; treat as context and wait for price triggers (e.g., break of the last higher low).
Throwback behavior after upward breakouts is common; a retest that holds often resumes the uptrend. Do not assume failure unless support breaks.
Scenarios & exact triggers (including the “possible 4 → another 5” path)
A) Wave-3 at 1.618, then a real wave-4, then final wave-5 (classic)
Path: Pause/roll at $126,738–$131,398 → corrective wave-4 (shallow to moderate) → renewed push for wave-5 toward $139,205 and potentially the channel upper/median.
Triggers:
Wave-4 confirmation = loss of the last HL on execution TF (1h/4h) without breaking larger uptrend structure.
Wave-5 confirmation = reclaim of broken level + momentum re-acceleration.
B) No meaningful 4 yet → direct press to 2.0 and stretch
Path: Clean acceptance above $131,398 (2.0) with no fresh divergence → $139,205; if momentum persists, risk of throw-over into the channel’s upper line; then monitor throwback retest.
Triggers: Daily/3D closes through $131,398 with strengthening MACD/RSI, then alert at $139,205 for profit-taking and reversal risk management.
C) Divergence rejection at the ladder → truncated/short 5
Path: Price prints marginal HH into $126,738–$131,398 while RSI/MACD make LH → rejection → 5-down on 15m/1h → measured pullback toward 23.6–38.2% of the advance; larger reassessment thereafter.
Triggers: Bearish divergence plus break of the last HL and failure on retest (confirmation over anticipation).
Risk management (mechanical, level-driven)
Into $126,738 / $128,767 / $131,398: scale partials or hedge; if fading, hard stops above the spike-high to avoid terminal 5 squeezes.
On acceptance → $139,205: trail under prior HLs; expect a throwback and treat it as continuation unless structure fails.
On confirmed reversal: first targets = 23.6–38.2% retrace of the leg; deeper moves require fresh evidence.
One-screen summary (for the Idea caption)
Decision ladder: $126,738 → $128,767 → $131,398.
Stretch box: $139,205; beyond that, channel median/upper (~$150k now; $156–160k if tagged weeks later).
Bull path: acceptance above the ladder with rising momentum → box/rail; manage throwback.
Bear path: divergence + HL break at the ladder → 23.6–38.2% reset.
Channeling and throw-over/throwback guidelines support these outcomes
$BTC Monday's fight over the trend is crucial.We remain bullish?CRYPTOCAP:BTC Monday's fight over the trend is crucial. We remain bullish as long as we hold 121k. A close below 121k could lead to 119k, then the 116k region. Bulls have 4 hours to keep this daily candle green.

Bitcoin $BTC at critical decision Bitcoin broke out above all-time highs before promptly retracting the gains. This has the potential to be a failed breakout and turn into a triple top. Bulls want to see bitcoin successfully recapture new highs and put in a higher low.

BITCOIN MONTHLY RSI Trend lineCheck the MONTHLY RSI Trend on Bitcoin, the first level to see is a HIGHER high on the trendline below and once BTC tests the upper trend line, MOST likely a clear sign to exit. There is ample scope on the upside, so keep a close watch.

BTCUSD Daily Double Bottom and Retest PossibilityIn the event that we get confirmations for a bearish correction, I will be looking to go long again when price retests of one of those lows indicated.
However, personally I would not count on any aggressive pullbacks in such a market.
#TheTrendIsAlwaysYourFriend

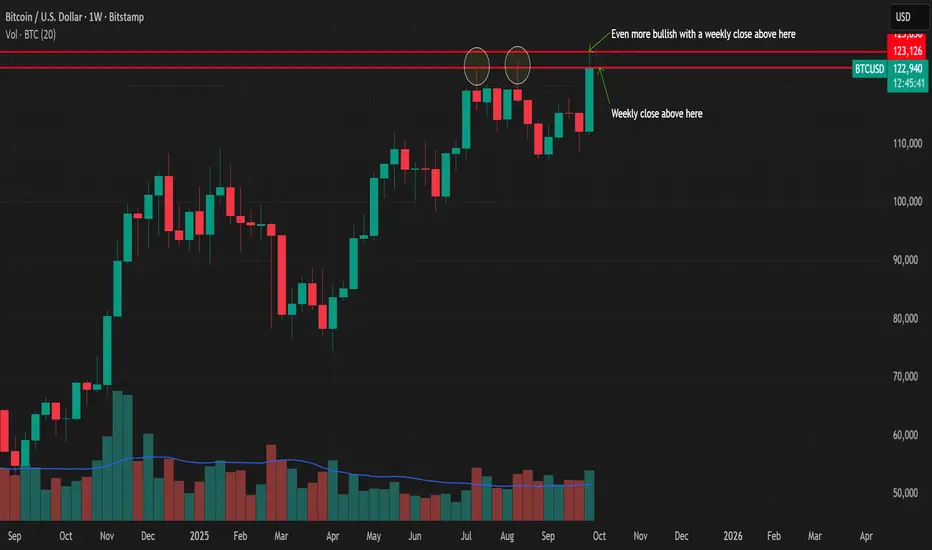
BTC Weekly Breakout AnalysisBitcoin is testing a critical resistance at ~$123K, marked by prior highs on July 14 and Aug 11, 2025.
A weekly close above this level today could ignite a bullish run above 130k, with a potential retest of $123K turning into support—setting up a bright Q4 ahead!
If no close above $123K, we might sideline a bit more, as momentum stalls.
Watch for volume confirmation and RSI >60 to back the breakout. Bear case: rejection drops us to $110K.
(DYOR, no FA)
Bitcoin follow upNow that early bear shorts 50x and up got rekt all the way to $125185 and now that our shorts with 10x got activated the question is what's next?
Well looking at present data and knowing that Daily tf still has TIME left to the upside but getting weak we can say that area between $123125 - $121735 will be strong sup to break once it gets there and most important how it gets there will tell us if $117865 will be the bounce point.

BITCOIN 2025: The Final Reset Has Begun
# 🚀 (A Vision Beyond the Charts)
*By IvanPatrice*
---
Most traders are staring at candles.
Few are watching **the clock.**
We are entering a **temporal zone** — a point in market structure where *time, liquidity, and human psychology* collide.
Every previous BTC supercycle — 2013, 2017, 2021 — aligned with the same **fractal rhythm**:
📈 Expansion → 📉 Purge → 📊 Accumulation → 🚀 Eruption.
Guess where we are now?
Right in the middle of the **silent accumulation vortex** — the moment before everything *detonates upward*.
---
### 🔍 The Data No One’s Looking At:
1️⃣ **MVRV Z-Score** has reset to the zone that preceded 2019’s 300% rally.
2️⃣ **Hashrate growth** is diverging from price — a signal that miner confidence is *outpacing market fear.*
3️⃣ **Dormant wallet activation** is climbing — long-term holders are *waking up early.*
These aren’t random metrics. They’re whispers from deep liquidity — the same whispers that warned of 2017’s eruption months in advance.
---
### ⚡ The Prediction:
BTC isn’t just preparing for another bull run —
It’s preparing for a **monetary rotation event**.
My model projects:
> 📍 **$48,200 – December 2025 (confirmation stage)**
> 📍 **$97,000 – April 2026 (first euphoria peak)**
> 📍 **$186,000 – 2027 cycle top**
Not because of hype, but because global capital is *seeking a firewall against debt decay.*
---
### 🧠 The Vision:
Most traders chase signals.
Real investors chase **energy shifts.**
Bitcoin isn’t competing with fiat anymore — it’s absorbing it. Every dip below $50K is *a historical gift* wrapped in fear and disbelief.
The next generation of traders will look back at this chart and whisper:
> “This was the moment the old system cracked.”
---
💭 What’s your vision?
Do you believe Bitcoin is preparing for its **final monetary breakout**, or are we still too early?
Let’s hear your perspective 👇
— **IvanPatrice**
