Worst bitcoin day🚀 BTC Dip? Nah, That's My VIP Lounge Invite! 🛋️💎
Yo, chart degens! Check this wild ride on BTC/USD – we're surfing the 1D waves like pros, but that "Satoshi wallet fake out" just yeeted us into a cheeky dip at ~108k. 😏 Looks like the market's playing 4D chess: broke resistance like a boss (hello, 114k dreams!), but then BAM – "Massive move incoming?" or is it just teasing us with a "We broke resistance... we light skip this" plot twist?
Trump's China tariffs got the fiat folks sweating bullets, but us HODLers? We're popping popcorn. 😂 That purple "first 20k candle of the season" scream? It's whispering sweet nothings about a rejection at 95% next? Pfft, or maybe it's the setup for a glorious pump to 125k+. We've got EMAs ribboning up like a crypto conga line (Madrid ribbon at 116k, anyone?), and that green support holding like your grandma's grip on her purse.
Why am I loading up on this dip like it's Black Friday at the moon store?
Fakeout FOMO Flip: Satoshi's ghost tried to spook us, but history says these wicks are just foreplay for the real bull hug.
Breakout Baby Steps: We smashed that resistance – now it's dip-buy o'clock before the "blood" turns to champagne rain.
Tariff Turbo: Global drama = BTC safe haven glow-up. While stocks dip, we sip. 🍹
Target: 125k by EOY, stops below 103k for the faint-hearted. Who's joining the dip squad? LFG or GTFO – but seriously, buy the fear, sell the greed... wait, reverse that! 🔥📈
#Bitcoin #BTCDip #BuyTheDip #CryptoChaos #TradingViewIdeas
Trade ideas

Weekly Prep/Plan - BTC - 13.10-19.10Range-bound, or do we keep pushing lower? I think U.S. tariffs on China are just kicking off - could be the spark for another BTC rally.
1) Biggest upcoming expiry (BTC / ETH)
Deribit monthly / quarterly cluster — Fri Oct 17 @ 08:00 UTC / 10:00 Madrid — largest cross‑venue monthly/quarterly expiry window.
Notional sizing: Based on past months, could reach $10–$20B+ across BTC & ETH combined (historical precedents).
CME (Bitcoin futures options) — Fri Oct 17 @ 15:00 UTC / 17:00 Madrid (to align with CME schedule) per their BTC options calendar.
CME Group
+1
2) Other notable expiries
Bybit weekly (Thu) — Thu Oct 16 @ 08:00 UTC / 10:00 Madrid
OKX / Binance weekly — Fri Oct 17 @ 08:00 UTC / 10:00 Madrid
Daily short‑term options (Deribit / OKX / Binance) — Mon → Thu @ 08:00 UTC / 10:00 Madrid (for gamma flows and rollovers)
3) US High‑Importance Macro Events (Madrid times)
Tue, Oct 14 — CPI (Sep) @ 14:30
Wed, Oct 15 — PPI (Sep) @ 14:30
Thu, Oct 16 — Initial Jobless Claims @ 14:30
Fri, Oct 17 — Core PCE / Personal Income & Spending (Sep) @ 14:30
Fri, Oct 17 — University of Michigan Sentiment (Oct prelim) @ 15:00
Fed / Fed speakers: None of high‑importance (Chair) currently confirmed this week (based on calendar visibility)

Twin Tweezers and possible bullish cypher harmonicIt's at the limit I allow for AB retracement but it barely fits.
The 103k D leg lines up with the channels and the MA's and EMA's moving up.
The twin Tweezers on the weekly says we have some more downside.

My take on the current $BTC sideways marketMomentum is weak, buyers are exhausted. Most likely, we’re heading for a drop below $108,000.
While others panic and cut positions, I do the opposite: accumulating cash.
My strategy right now:
1️⃣ Bots active, risks reduced
Trading bots capture small volatility moves, while the main capital sits in stablecoins.
2️⃣ Averaging discipline
I don’t chase the “bottom” on the first dip. I prepare cash to increase my position at the next support level.
3️⃣ Prepared for multiple dips
A weakly reactive market can give 2–3 waves down. I’ve split my capital to be able to scale in twice if the drop continues.
💡 Subscriber tip:
• Add funds to your balance after each dip — long-term profits can grow significantly this way.
• Take profit at the top, when most traders are rushing to buy.
⚠️ Important: forecasts are rarely perfect, so maintaining cash balance is critical.
✅ Key point: don’t try to guess the bottom — buy systematically and aggressively at the best prices. This is how the foundation for 50% annual profit is built.
⚠️ Not financial advice. This is just my trading idea and strategy.

btc/usdwave 3, looks like extension of 5th.. Red lines 1.618 2.618 targets. At least one more leg up before retrace

Bitcoin - should I rush in to buy now ?I expect the price to continue heading south towards the 100k psychological level once more and then we see another flood of people coming in to push the price back up.
Please DYODD

(BTC) bitcoin "biggest losing candle ever"This looks like the biggest losing candle I've ever seen on Bitcoin, and the same goes for Ethereum. Huge single day losses for cryptocurrency. I find a winning a solution and instead the entire market of cryptocurrency loses big time all because they don't want me to be able to win. Decentralizing trades does nothing to protect information when comparing Coinbase to Coinbase wallet defi. The Defi of coinbase wallet is the same as Coinbase where some type of inside log knows data of my trades and I lose when I start putting my money in at the perfect time to win.

Continuously making HH HLBTC Analysis
CMP 112510.14 (12-10-2025 02:58AM PST)
Continuously making HH HL & is Still Bullish in the
longer run.
as shared on 02-06-2025, Cup & Handle Target hit
around 115000 - 120000 & then dropped.
3 Important Support levels are :
S1 around 108000 - 108450
S2 around 95000 - 95200
S3 around 86000 - 86500
S2 seems to be a Stronger Support as this range is
also around Channel Bottom.
Upside Targets seems to be around 132000 - 132300
initially.
BTC seem safe as long as it stays above 74000; if it
breaks this level, we may witness trend reversal.

Bearish Divergence on Bigger tf
CMP 105228.47 (02-06-2025)
Bearish Divergence on Bigger tf (Cautious
approach should be taken).
However, if 109350 is Crossed, we may
witness 115000 & then 120000 - 121000.
and if 112000 is crossed & sustained, be ready
to get New Highs :-)
Lets be more cautious & dig out 3 Important
Support Levels.
S1 around 103000 - 102500
S2 around 97800
S3 around 93400 - 93500.

BTC: Crypto Black Friday! Is it game over?One thing for sure, Uptober has flopped big time! Market recovery is not on the horizon just yet. BTC is more likely to shed some more value in terms of dollars. Major Alts are back above major support, but if those will hold or not, will be found out in the upcoming weeks. The big question is, if the bull market done?
If we go by the 4 year halving cycle, then one could make an argument that the bull market is over for the next 18 months. To be completely honest, all major price targets have been hit for this cycle. Not only for BTC, but also for SPX, NDX, Gold, major Alts, etc. So, what is there to complain about? Well, first of all, this crash is totally manmade (AHEM!!!). And second, Crypto industry was just getting its very first legitimate institutional led headwind and it stalled before it could really take off! Frustrating, for sure; unexpected, not really!
Now, in terms of how bad it can get, we need to look if support levels can hold. I will have a few stop losses to get me out of this mess if things start to fall apart. First is the 108k level. It almost gave in, but holding on. If that fails, then 89k level. It is very important to hold. If we see daily closes or weekly close below it, then 74k pivot will be tested and most likely fail. If that fails then the 70k-65k cluster and if that is not enough then 50K. Below 50k, I don't think any institution will be comfortable to hold on. So, if that fails, it is really game over! No one knows what will really happen. In past cycles, big draw downs have marked a low, but this time it is a bit different. Previous drops like this have been in the bottom of the cycle and this time it's at the top. So, unless BTC can shrug this off and take advantage of the dollar decline and start to head back up, we need to prepare for the bear market.
The bull market is still intact if BTC can bounce off one of the fib levels and start making new highs. If that happens, then we will see the last leg of the extended wave 5 move! We do not want to see price closing below $89k on daily closing basis.

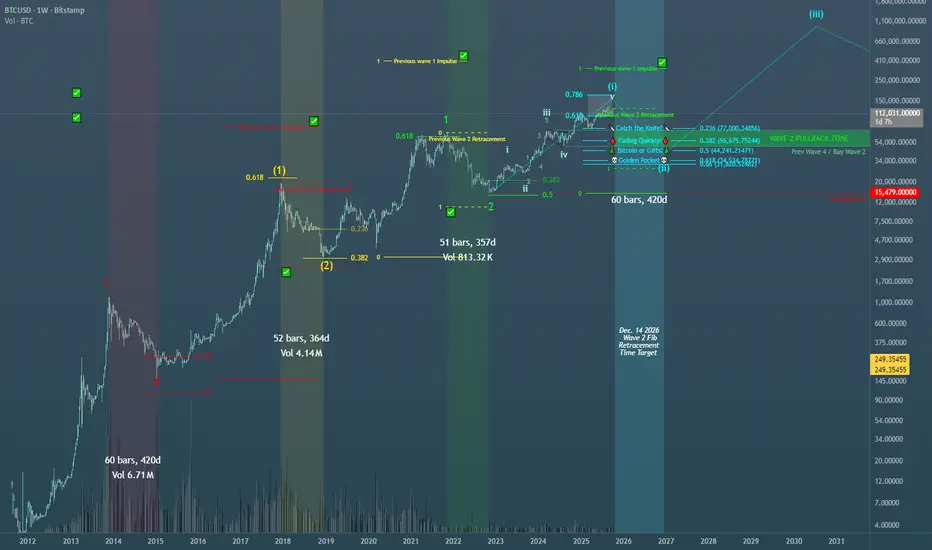
Bitcoin Multi 1,2 Elliott Wave Cycle Analysis: Wave 2 Decryption Shown on the chart is BTCUSD:BITSTAMP on the Weekly Timeframe. This is a breakdown of the Multi 1,2 Elliott Wave Scenario plotted on the chart. This is by far my most bullish scenario for Bitcoin, as we haven't even reached the main wave 3 thrust up, i know its hard to fathom BTC over 1 million dollars, but this is one way to get us beyond that.
Historically the 1,2 pattern has mimicked past 1,2 fractals, usually returning smaller gains and retracements compared to its past 1,2 structure. This is only a guideline for the 1,2 pattern and not a hard rule, although BTC has maintained the right look for this Multi 1,2 Structure throughout its cycle. We are already on the 4th 1,2 pattern continuing the bullish movement to the upside. I have this degree of trend as the final 1,2 before the wave 3 thrust up. Probabilities get lower the more 1,2s we build leading to the 3rd of 3rd of 3rd of 3rd wave thrust, this is already a dream scenario on the Weekly Timeframe, not often do we see these "Rare Unicorn" patterns play out on a HTF, but more often on <15 min TF the rare pokemon are spotted more frequently.
I have highlighted my preferred buy area for the coming wave 2 pullback. The 2nd waves have reached higher fib ratios while still remaining smaller than the previous 1,2 ratios, showing the right look between impulsive and corrective structures thus far. Considering this, wave 2 could surprise us all (MMs known for this) and retrace to the .618 - .66 Golden Pocket area, while still remaining smaller than its past 1,2 fractal. I hope someone finds this useful or at least interesting! Happy Trading
BTC USDHI GUYS oule
Today is a good day we got entries on the DB 30min chart PRICE PATTERN.
just made more entries on the shoulder take profit area fib level 1.414 or 113077.12
once the take profit is hit we then open new entries on the head.
NOTE we are scalping the buys however the sells will take us till next week,

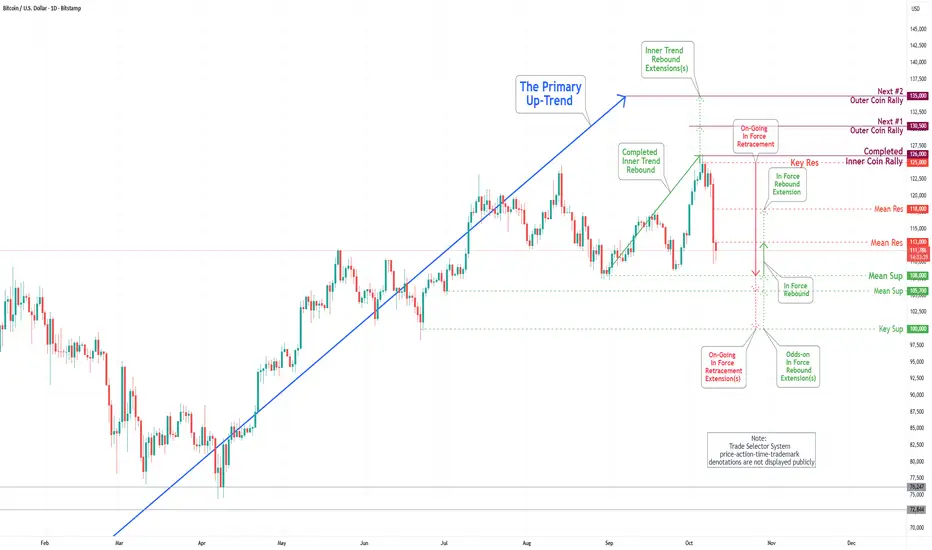
Bitcoin at a Crossroads: Strong Rebound or Impending Breakdown?Short-Term Analysis (1–2 Weeks)
The chart shows Bitcoin moving within a clear upward channel. Price recently touched the lower boundary of this channel — a zone that typically attracts buying pressure. The 50-day Simple Moving Average (SMA50) is currently around $114,300, acting as a near-term resistance.
Given the current bounce attempt from the lower trendline, if price holds above $113,000, a recovery toward $118,000–$122,000 is likely.
However, if a daily candle closes below $110,000, it would signal a potential channel breakdown, exposing Bitcoin to a decline toward $104,000.
Short-Term Setup:
Potential Entry: Around $112,500 after a confirmed rebound
Targets: $118,000 → $122,000
Stop Loss: Daily close below $110,000
Long-Term Analysis (1–3 Months)
The ascending blue channel remains intact and defines the broader bullish structure. Each touch of the lower boundary has so far led to a move toward the channel top. If Bitcoin reclaims and sustains above the 50-day MA, the next upside targets are in the $126,000–$128,000 range.
Conversely, a confirmed breakdown below the channel bottom (around $109,000) could flip the market structure to bearish, opening downside targets at $102,000–$98,000.
Long-Term Setup:
Bullish Scenario (as long as channel holds):
Targets: $126,000 → $128,000
Stop Loss: Below $109,000
Bearish Scenario (if breakdown confirmed):
Targets: $102,000 → $98,000
Stop Loss: Reclaim above $112,000
Summary:
Bitcoin is currently sitting at a critical decision point. Short-term signals suggest a possible rebound from the channel’s lower edge, but a daily close below $110,000 would confirm weakness.
From a long-term view, the overall trend remains bullish as long as the ascending channel structure stays intact.

Bitcoin(BTC/USD) Daily Chart Analysis For Week of Oct 10, 2025Technical Analysis and Outlook:
During the most recent trading session, the Bitcoin market experienced a notable decline, falling below significant support levels of 120000, 117500, and 114000, respectively. Current market analysis indicates an initial potential retracement toward the Mean Support level of 108000, with further extension possibilities to the Mean Support level of 105700 and the Key Support level of 100000. It is crucial to acknowledge that intermediary rebounds may occur at these defined levels, particularly at the Mean Resistance level of 113000.

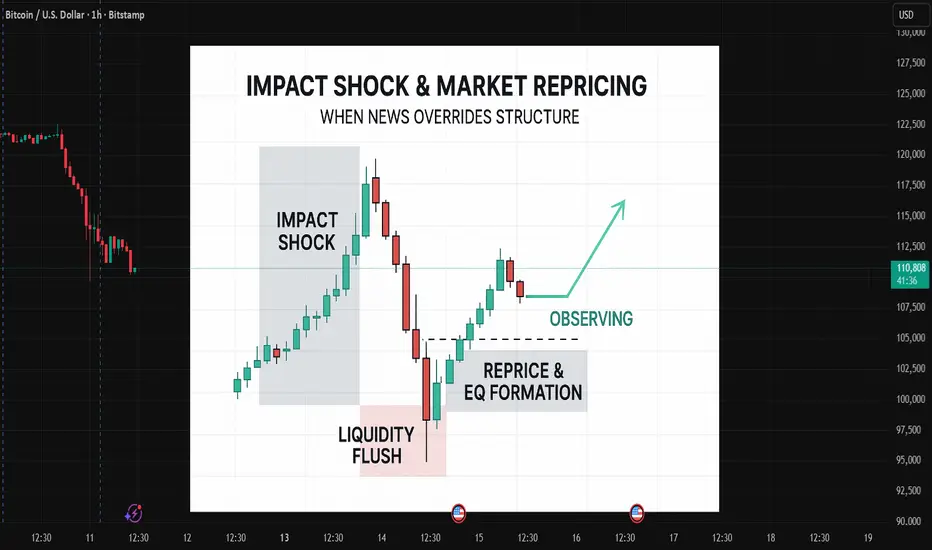
Impact Shock & Market Repricing – When News Overrides Structure
🧠 Impact Shock & Market Repricing – When News Overrides Structure
Market Insight (Educational Post)
Every trader remembers those days when price action seems to ignore every line on the chart.
Yesterday’s global shock — Trump confirming 100% tariffs on Chinese imports — was one of them.
Within minutes, equities dumped, crypto followed, and volatility spiked across all risk assets.
While most saw chaos, experienced traders saw a liquidity event — not a random collapse.
⚡ The Three-Stage Shock Mechanism
1️⃣ Impact Shock – Narrative Breaks the Model
When unexpected macro headlines hit, the first move isn’t “price discovery.”
It’s risk evacuation
Algos and institutions cut exposure instantly, creating vertical imbalance candles with no structural respect.
This is the moment where retail chases — and professionals pause.
2️⃣ Liquidity Flush – True Intent Appears
Stops below prior lows get cleared, and price digs into untested liquidity pools.
The key idea: the first drop isn’t the real move
The market must *flush the books* — removing trapped traders — before finding directional conviction.
Veteran traders know this as the Clean-Sweep Principle.
Liquidity gets harvested first; direction comes later.
3️⃣ Reprice & EQ Formation – Where Logic Returns
After the flush, volatility compresses.
Price starts forming a new equilibrium (EQ) — the level where fresh bids and offers rebalance.
Now structure matters again: range boxes, reclaim setups, and FVGs regain validity.
This is when patient traders quietly re-engage, not during the panic.
The Hidden Lesson for Experienced Traders
Liquidity doesn’t vanish in panic — it relocates.
When structure “breaks,” professionals ask:
*Where will the new liquidity base rebuild?*
* The first candle: belongs to algorithms.
* The reaction phase: belongs to liquidity engineers.
* The repricing phase: belongs to professionals.
If you can identify where equilibrium reforms after impact, you stop trading emotion — and start trading flow logic.
🧩 Takeaway
“In every macro shock, structure doesn’t die — it migrates to a higher timeframe.”
Recognize the impact, wait for the flush, and trade only when the new EQ stabilizes.
That’s how pros interpret chaos as structure.
Tags:
#MarketStructure #Liquidity #HybridTrading #MacroShock #PriceAction #RiskOff #Reprice #TechnicalAnalysis #EducationalNote #TradingView #TradingPsychology
@MashinChiFx
ElDoradoFx PREMIUM 2.0 – Weekend BTCUSD AnalysisBTC is trading around 110,200, after a sharp 12,000-pip correction from the recent 126,000 high.
This week’s movement confirms a bearish structure shift, driven by heavy liquidation and macro profit-taking after the extended bull leg.
⸻
🔍 Technical Outlook
📅 Daily Structure (1D):
• BTC broke below the 115,000 key support and is now testing the ascending trendline support near 108,800–107,700 (the previous swing-low region).
• The daily candle shows a long lower wick, signaling potential demand re-entry, but momentum remains weak.
• The 200-EMA (yellow) around 107,700 is critical — a close below would confirm a mid-term bearish reversal.
• MACD shows a strong bearish crossover with fading histogram strength, indicating decelerating bearish pressure.
• RSI has cooled to the 35–38 zone, approaching oversold — supporting a possible short-term rebound.
🎯 Fibonacci Golden Zone:
The retracement from the swing low (107,200) to the previous swing high (126,000) places the Fibonacci Golden Zone (61.8%–50%) between 112,000–114,500.
This zone will likely act as the first major resistance on any pullback.
If price retests this area and rejects, it offers a high-probability short continuation opportunity.
⸻
📈 Intraday Structure (1H + 15M + 5M):
• 1H structure remains bearish, with continuous Breaks of Structure (BOS) toward new lower lows.
• Short-term consolidation is forming around 110,000–110,500, right above the daily support zone.
• 15M and 5M charts show small bullish divergences on RSI and MACD, suggesting a possible technical bounce before continuation.
• 50EMA and 100EMA on intraday remain above price — still confirming short-term downtrend dominance.
• The current compression could lead to a small retracement toward 111,800–112,400, which aligns with the Fib retracement zone and intraday supply.
⸻
📌 High-Probability Entry Zones (≤600-pip SL)
🔴 SELL (Trend Continuation)
• Entry: 111,800 – 112,400 (Fib 50–61.8% zone)
• SL: 113,000
• TP1: 110,000
• TP2: 108,800
• TP3: 107,300 (200-EMA / Daily demand)
Bias: Short from retracement back into structure resistance & EMAs alignment.
🟢 BUY (Short-Term Reversal Play)
• Entry: 108,800 – 109,200 (demand & trendline)
• SL: 108,200
• TP1: 111,200
• TP2: 112,000 (Fib zone)
Bias: Only valid if RSI stays above 35 and MACD histogram flips green — scalp reversal before trend resumes.
⸻
📅 Fundamental Watch
• Weekend liquidity remains low — avoid chasing false breakouts.
• No major macro events until Monday, but watch CME Futures Gap risk between 109k–111k.
• U.S. CPI data from earlier in the week reinforced stronger USD; risk appetite still fragile — BTC sensitive to Dollar Index movements.
⸻
⚠ Key Levels to Monitor
Resistance: 111,800 / 112,400 / 114,500 / 116,500
Support: 109,200 / 108,800 / 107,700 / 106,800
⸻
✅ Summary
BTC remains in a bearish correction phase below 114,000 after failing to hold structure.
A pullback to 111,800–112,400 could offer the best short opportunity (sell-the-rally setup).
If bulls defend 108,800, expect a technical bounce back to 112k before another drop.
Below 107,700 = full bearish continuation toward 105,000,
while reclaiming above 114,500 = short-term bullish recovery.
— ElDoradoFx PREMIUM 2.0 Team
⸻
🥇 ElDoradoFx PREMIUM 2.0 – PERFORMANCE 10/10/2025 🥇
📊 MARKET RECAP:
🔻 SELL 🔴 +50 pips
🔻 SELL LIMIT 🔴 +20 pips
❌ SELL 🔻 –95 pips (SL)
🔻 SELL 🔴 +210 pips
🟢 BUY 🟩 +110 pips
🟢 BUY 🟩 +200 pips
🔻 SELL 🔴 +40 pips
---
🏆 GOLD TOTAL PIPS WON: +535 pips
📊 RESULT: 7 Signals → 6 Wins | 1 SL
🎯 ACCURACY: 86 %
---
🔥 Another strong trading day!
Controlled risk, solid entries, and consistent results 💪📈
👏 Congratulations if you profited ✅✅✅🚀🚀🚀

Announcement📢 Announcement
I’ve moved all my activity to my new account ➜ @ or
www.tradingview.com
From now on, all updates and indicators — including RMBS Smart Detector — will be published there.
Please follow that account to stay connected and receive future releases.

CBDCs in Global TradeThe Digital Currency Revolution Transforming International Commerce.
1. Understanding CBDCs: The Foundation of Digital Sovereign Money
A Central Bank Digital Currency (CBDC) is a digital form of a nation’s fiat currency issued directly by its central bank. Unlike cryptocurrencies such as Bitcoin or stablecoins like USDT, CBDCs are fully backed by the state and have legal tender status. They combine the stability of fiat currency with the efficiency of digital payment systems.
CBDCs can be retail (for everyday citizens and businesses) or wholesale (for banks and large financial institutions engaged in cross-border or interbank transactions). The core idea is to modernize money itself, bringing central bank-backed currency into the digital age.
Types of CBDCs:
Retail CBDC: Used by individuals and businesses for daily transactions, similar to digital cash.
Wholesale CBDC: Used for interbank settlements and large-scale trade or financial transactions.
For global trade, wholesale CBDCs play a more critical role, as they directly impact cross-border payments, trade financing, and settlements between international companies and governments.
2. The Need for CBDCs in Global Trade
The current global trade payment system relies heavily on a network of correspondent banks, SWIFT messaging systems, and foreign exchange intermediaries. While effective, it is slow, expensive, and prone to compliance and settlement risks. For example, an international trade transaction can take several days to complete, with high transaction fees and exchange rate fluctuations eroding profit margins.
CBDCs are designed to eliminate these inefficiencies. They enable instant settlement, reduce transaction costs, and allow for direct currency swaps between trading nations without the need for third-party intermediaries. This has massive implications for both developed and emerging markets.
Current Pain Points in Global Trade Payments:
High transaction fees due to multiple intermediaries.
Delays caused by time zone differences and banking hours.
Currency conversion risks and volatility.
Compliance and anti-money laundering (AML) challenges.
Limited access for smaller businesses in developing nations.
CBDCs aim to solve these challenges by creating a seamless, transparent, and programmable payment ecosystem that functions in real time.
3. How CBDCs Transform Cross-Border Trade
CBDCs can fundamentally change how imports, exports, and settlements occur between nations. By connecting central banks directly through digital networks, countries can bypass traditional systems and conduct instant, low-cost international settlements.
a) Faster Settlements
With blockchain or distributed ledger technology (DLT), CBDC transactions can be completed in seconds instead of days. This speed reduces liquidity needs and increases operational efficiency for exporters, importers, and financial institutions.
b) Reduced Currency Conversion Costs
CBDCs can enable direct currency exchange between two national digital currencies without involving an intermediary like the US dollar. For example, a trade between India and Singapore could use the digital rupee (e₹) and digital Singapore dollar (eSGD) for direct settlement.
c) Enhanced Transparency and Security
Every transaction made with CBDCs can be recorded on a secure digital ledger, ensuring full traceability and reducing the risk of fraud, money laundering, or trade-based financial crimes.
d) Programmable Smart Contracts
CBDCs integrated with smart contracts can automate payments upon fulfillment of trade conditions—such as delivery of goods, verification of documents, or customs clearance. This reduces disputes and increases trust in trade relationships.
4. CBDC Pilot Projects in Global Trade
Many nations are experimenting with CBDCs for cross-border trade. Some of the most advanced projects include:
a) China’s Digital Yuan (e-CNY)
China is leading the CBDC race with its digital yuan. It aims to internationalize its currency and reduce dependence on the US dollar in trade settlements, especially within the Belt and Road Initiative (BRI). The e-CNY has already been tested in Hong Kong and is being explored for cross-border trade in Asia and Africa.
b) Project Dunbar (BIS Initiative)
The Bank for International Settlements (BIS) collaborated with the central banks of Singapore, Malaysia, South Africa, and Australia to test a multi-CBDC platform. Project Dunbar demonstrated that multiple central banks could share a single platform for cross-border payments without needing intermediaries.
c) India’s Digital Rupee (e₹)
India’s Reserve Bank of India (RBI) launched pilots for the digital rupee, focusing on wholesale trade settlements between banks. In the future, India aims to use the e₹ for trade with friendly nations in Asia and the Middle East, reducing dependency on the US dollar.
d) Project mBridge
A collaboration between China, Thailand, Hong Kong, and the UAE, Project mBridge is one of the most promising multi-CBDC platforms. It aims to facilitate instant cross-border trade settlements among participating countries.
These experiments signal a major shift toward CBDC interoperability, where different nations’ digital currencies can seamlessly interact within a shared technological framework.
5. Geopolitical Implications: Redefining Economic Power
CBDCs have deep geopolitical consequences. For decades, the US dollar has dominated global trade and finance, giving the United States immense influence over international monetary policy and sanctions enforcement. However, with CBDCs, nations now have a tool to bypass the dollar-based system, reducing US leverage.
a) De-dollarization
Countries like China and Russia are exploring CBDCs to conduct trade directly with partners, avoiding SWIFT and dollar settlement systems. This could accelerate de-dollarization, reshaping global financial power dynamics.
b) Regional Trade Blocks
CBDCs could strengthen regional trade blocs like ASEAN, BRICS, and the EU, as members adopt interoperable digital currencies. For example, BRICS nations (Brazil, Russia, India, China, South Africa) are considering a common digital settlement platform for trade within the group.
c) Financial Sovereignty
CBDCs give countries more control over their monetary policy and international transactions, especially against the backdrop of sanctions, currency manipulation, and capital flight.
6. The Role of CBDCs in Trade Finance
Trade finance involves providing credit and payment guarantees to importers and exporters. Currently, it’s a complex system involving multiple banks, documentation, and intermediaries. CBDCs can simplify this by enabling instant, transparent, and programmable transactions.
Benefits in Trade Finance:
Real-time verification of documents and goods through blockchain.
Reduced paperwork via smart contracts and digital documentation.
Lower default risks due to traceable payment flows.
Easier compliance with KYC (Know Your Customer) and AML (Anti-Money Laundering) norms.
Financial institutions could use CBDCs to streamline letters of credit, escrow arrangements, and payment guarantees, making international trade faster and more reliable.
7. Challenges in Implementing CBDCs for Global Trade
Despite the immense potential, CBDCs also face several hurdles before they can become the backbone of international commerce.
a) Lack of Global Standards
Different countries are developing CBDCs using various technologies and regulatory frameworks, making interoperability a major challenge. A lack of common standards could lead to fragmentation in the digital currency ecosystem.
b) Cybersecurity Risks
CBDCs operate on digital infrastructure that is susceptible to hacking, cyberattacks, and data breaches. Ensuring strong cybersecurity measures is essential to protect national monetary systems.
c) Privacy Concerns
CBDCs can enable governments to monitor transactions in real-time, raising privacy and surveillance concerns among citizens and businesses.
d) Technological and Infrastructure Gaps
Developing countries with limited digital infrastructure may face difficulties in adopting CBDCs efficiently, creating digital inequality in global trade participation.
e) Monetary Policy Impacts
Widespread use of CBDCs could impact traditional monetary policy tools and potentially alter interest rate transmission and capital flows across borders.
8. The Road to Interoperability: A Global CBDC Network
The long-term goal of CBDC adoption in global trade is to achieve cross-border interoperability—the ability of one nation’s digital currency to transact seamlessly with another’s. Central banks and institutions like the BIS, IMF, and SWIFT are working on frameworks to make this possible.
Key Developments:
Multi-CBDC platforms such as mBridge and Dunbar.
Interlinking payment systems, like India’s UPI connected with Singapore’s PayNow.
Digital identity systems integrated with CBDCs for seamless verification.
A future global CBDC network could enable trade settlements that are instant, transparent, and secure, reducing friction and creating new efficiencies across supply chains.
9. The Future of CBDCs and Global Trade Dynamics
As CBDCs mature, we could see the birth of a new global payment architecture—one that is digital-first, decentralized, and less dependent on legacy banking systems. The implications will be profound:
Trade settlements could shift from the US dollar to regional CBDC pairs.
Emerging markets could gain greater participation in global trade.
Smart trade contracts could automate international logistics and compliance.
Real-time trade data could enhance transparency for governments and corporations alike.
Over the next decade, CBDCs could become as central to trade as shipping containers were to the globalization era.
10. Conclusion: A New Era of Digital Trade
CBDCs represent the next frontier of global finance and trade. They hold the power to make international commerce more efficient, inclusive, and transparent, while also challenging existing geopolitical and financial structures.
For businesses, this means faster payments, lower costs, and more predictable trade settlements. For governments, it means enhanced control and sovereignty over cross-border transactions. And for the world, it signifies the dawn of a digitally interconnected economy, where trade flows as seamlessly as information.
The rise of CBDCs is not just a technological evolution—it’s a monetary revolution. As nations continue to pilot and deploy these digital currencies, global trade is poised to enter a new era defined by speed, security, and sovereignty.

btcThe price is moving in two areas: green and red. I expect the price to correct lower, but it should be checked periodically. So, take a step-by-step approach to buy.


BTC DOWNIf ya'll be questioning the cycle. Toppy! Can it go back up to the highs, slightly higher, sure but overall... journey down again.

BTC USD, HI GUYS,
CORRECTION ON TECHNICAL BTC USD
BTC USD, has been selling for 2 hours and reached a major zone previous low area .
i still expect a DOUBLE BOTTOM as per the earlier posted idea however the selling pressure is too high which has led to new possible tread path and price action patterns to identify as shown in pic above.
will make entries today 9. am
