BTCUSD Short Idea: Bearish Rejection at Former SupportHello fellow traders,
This is a technical analysis of a potential short setup on the BTCUSD 15-minute timeframe.
Analysis:
The chart shows that after a notable downward trend, the price of Bitcoin has been consolidating in a tight range. We are currently observing a retest of the key horizontal level around $110,425. This level previously acted as support, and the current price action suggests it may be flipping into a new resistance level.
The expectation is for the price to be rejected from this resistance and continue the prevailing bearish trend.
Trade Setup:
Based on the short position tool placed on the chart, the parameters for this trade idea are as follows:
Entry: Approximately $110,423.09
Stop Loss: $112,626.92 (This is placed above the recent consolidation high, providing a buffer against volatility).
Take Profit: $103,822.05 (This targets a lower price point, potentially a new swing low).
This setup presents a clear risk-to-reward profile.
Disclaimer: This is a trading idea for educational and discussion purposes only. It does not constitute financial advice. Please conduct your own research and manage your risk appropriately before making any trading decisions.
BTCUSD.PI trade ideas

Saturday Bitcoin analysisSo far, Bitcoin’s trend is bearish, and the price is stuck in a range that seems to be getting tighter by the moment. Of course, in the next day or two we shouldn’t expect much movement because the Forex market is closed — unless some sudden major news comes out.
If the range breaks to the upside, we need to wait for a strong trigger, meaning clear signs of a trend reversal. But if the range breaks to the downside, we can enter a position even without a trigger, as long as risk management is applied. One important point: since the price has already dropped a lot, in case of a downside breakout we shouldn’t expect a high RR, because the trend could reverse at one of the support levels. ✅

UNWINDING WEAKNESS.📉 #Bitcoin 4H Technical Outlook
BTC is consolidating near $109K after a sharp drop, with major support resting around $98K–$100K.
• 🔴 Key resistance: $118K → $124K
• 🟢 Key support: $98K → $100K
• ⚠️ Bias remains bearish below $112K. A breakout from this tight range will define the next major move.
👉 Watch $109K for a decisive break. Below = bearish continuation. Above $118K = bulls regaining control.
#menlikelucid.

BTC Possible Scenarios for the WeekPossible Scenarios for the Week
Bullish scenario: BTC holds support at $110,000, breaks through $120,000, and heads toward $125,000-$130,000.
Sideways/consolidation: Movement between $110,000 and $120,000 without a clear direction.
Bearish scenario: Break below $110,000 — test of $105,000 and below.
Risks and factors to monitor
Fed policy and rate announcements can significantly influence the trend (as a driver for the USD).
Trading volumes: Weak volumes during breakouts may be false.
US macroeconomics, inflation, geopolitics — increased tensions could trigger volatility.
BITCOIN?????????????????????????SO this is how i think i like to see how do you think or what do you think about my analyse so please leave a comment
NOW here is the thing in btc.d we are doing a head and shoulderpattern
that there is a good chance that it will go down if btc.d brake the support
and go down the chance of btc to go down is even more AND in usdt.d we
broke our resistance and we are going up we already did 1 leg in usdt.d we
wait for a pullback or a good candle that brake the previous high and if we
do that btc WILL go down so chek the btc.d and usdt.d

Fractals and Patterns - Tell me what you seeWell I guess history gonna repeat itself :)
A copy paste scenario is very likely i think.
My moms message:
"His posts are not a financial advice"

I know you dont like me but.. but... the whole universe is a huge fractal. Repetition inside a repetition repeated over time. Trading and investing is not far away from philosophy.
Been showing this fractal for few years now :) its simple on point week by week.
Not an investment advice. Go to meditate.
BTS rules.

BITCOIN HIGH PROBABILITY SETUP SOON!!!🚨 BTC HIGH PROBABILITY BUY SETUP 🚨
* Here We Can See Clearly The Next Potential Moves For BTCUSD Coming Hours/Days.
* Keep Your Eyes Close On Your Trading Positions.
* Happy PIP Hunting Traders.
FXKILLA.

BTCUSD Bearish Flag Continuation: Short Setup Targeting $100,000Bearish Flag/Channel: The chart shows price action forming a downward-sloping, parallel channel after a prior drop (which isn't fully visible but implied by the setup). This pattern is commonly referred to as a bearish flag or descending channel, which is typically a continuation pattern.
Implication: A bearish flag/channel suggests that after this consolidation phase, the price is likely to break to the downside and continue the previous move lower.
Short Trade Plan
The chart outlines a specific short entry, stop loss, and profit target based on the potential bearish continuation:
Entry Point: $118,228.59
Interpretation: The trader is looking to enter the short trade on a retest of a previous resistance level or the top of the consolidation range, specifically a level around the potential breakdown area.
Stop Loss: $121,395.17
Interpretation: This is the price level where the trade would be closed to limit losses. It sits just above the entry point and the consolidation high, likely to protect against a false breakdown or a strong move back up.
Target Point: $100,481.05
Interpretation: This is the profit-taking level. It appears to be based on a measured move of the bearish flag pattern, projecting the distance of the "pole" (the move before the flag) downward from the breakdown point. It also aligns closely with the major psychological level of $100,000.
Risk/Reward
The setup, as drawn, shows a relatively favorable risk-to-reward ratio, which is generally a good characteristic for a trade:
Risk (from Entry to Stop Loss): $121,395.17 - $118,228.59 ≈ $3,166.58
Reward (from Entry to Target Point): $118,228.59 - $100,481.05 ≈ $17,747.54
Approximate R:R: 17,747.54/3,166.58≈ 5.6 to 1
Current Price Context
The current price at the time the chart was taken is $109,401.93.
This means the price is currently well below the proposed entry point of $118,228.59.
The price is sitting within the lower half of the drawn descending channel (bearish flag).
Possible Scenarios from Current Price:
Immediate Continuation: The price could break the lower boundary of the channel from its current position and head directly toward the target. In this case, the drawn trade setup would be missed, and the trader might look for a different entry on a retest of the broken channel.
Execution of Setup: The price could rally back up toward the upper boundary of the channel and the $118,228.59 entry point before reversing and heading down. This would allow the trade plan to be executed as intended.

BTCUSD - Price has retested an H1 Support Trendline I am anticipating a bounce from this support level and a break out to the upside of a falling wedge.
I have done a top down analysis from weekly and I am seeing strong bullish confirmations.
BTCUSD Short/Sell SignalBitcoin (BTC/USD) – Tactical Short/Sell Positioning Framework
From a technical perspective, Bitcoin is currently presenting a compelling short-side opportunity as the structure unfolds. After multiple failed attempts to sustain momentum above the $110,000 handle, price action has carved out a sequence of lower highs and retests of the same horizontal zone, a classic sign of weakening bullish conviction and potential distribution at elevated levels.
The current chart reveals several critical dynamics:
1. Stop-Loss Placement (Risk Management Discipline)
A prudent protective stop (SL) I have set at $112,800, just above recent resistance. This ensures adverse upside volatility is capped while preserving favorable risk-to-reward asymmetry.
2. Initial Breakdown Trigger
Bitcoin’s repeated interactions with the 200-day moving average highlight the significance of this level as both psychological and structural support. A clean break beneath it could catalyze accelerated downside flows, inviting systematic selling and liquidations.
3. Downside Targets (Profit Objectives)
Take Profit 1 (TP1): $100,070
This marks the first tactical support level, aligning with prior consolidation and offering a conservative initial profit capture.
Take Profit 2 (TP2): $89,566
A more ambitious level, representing the mid-range support where prior accumulation took place. A breach of this zone would likely confirm a broader bearish continuation pattern.
Take Profit 3 (TP3): $76,193
The ultimate downside objective in this framework, corresponding to deep structural support. Achieving this would imply a full retracement of the bullish leg initiated earlier in the year.
4. Strategic Interpretation
This sequence of measured downside targets aligns with a tiered scaling-out methodology, ensuring that profits are progressively locked in as price declines. Such an approach maximizes capital efficiency while allowing flexibility to ride the broader bearish trend should momentum persist.
My Conclusion
The technical confluence of repeated resistance rejection, weakening market structure, and clear downside liquidity targets positions Bitcoin as a sophisticated short candidate at current levels. Risk is well-contained above $112,800, while downside projections toward $100K, $89.5K, and ultimately $76K create a compelling asymmetric opportunity.

Saying goodbye isn't easy, but it's part of the journey.It was a good run. Play the small retraces if you dare, but be careful. See you next time.

Bitcoin’s Rising Wedge Signals a Potential Major DowntrendI believe Bitcoin is currently forming a rising wedge pattern on the long-term chart, which often indicates an impending reversal.
Looking at the multi-year price chart, we can see that each new high has been achieved on declining volume, a classic sign of weakening momentum. This is in contrast to the earlier years of Bitcoin’s growth, where price advances were supported by increasing volume.
The wedge is nearing its apex, and historically, wedges like this tend to break downward rather than upward. Key Fibonacci retracement levels—50%, 61.8%, and 78.6%—suggest potential downside targets if a breakdown occurs.
In my analysis, if the wedge breaks to the downside, Bitcoin could experience a significant drop, potentially retracing much of its previous gains. This aligns with the sharp red arrows shown in my chart, indicating possible downside targets.
I will be watching closely for confirmation of a breakdown below the wedge support line. If that occurs, I expect the next major support levels to come into play near the Fibonacci levels highlighted.
Clear risk management is essential—these are only technical levels and not certainties. Stop-loss levels should be set above the wedge resistance if entering a short position.
Disclaimer: This analysis represents my personal opinion based on technical patterns and should not be considered financial advice. Please do your own research and consult with a qualified financial advisor before making any investment decisions.

Btc - Lower low incoming?Based on the "3 red week down rule" a lower low is expected (with high probability).
He's a simplified chart of what I am expecting in the short term.
May the trends be with you.

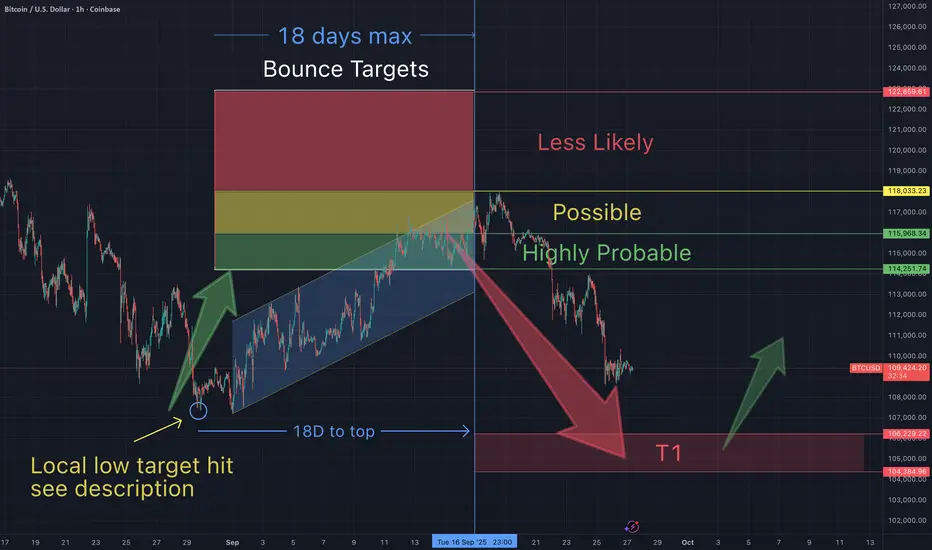
You will ask yourself, "how did he know Btc would do that"?On Aug 9th, I suggested Btc would bottom as low as 107,700, before a bounce.
On Sept 9th I suggested Btc had bottomed at my target, and would bounce to between $114K-118K (within 18 days)...the form a lower low. Day 19 began this current retrace.
Each of these predictions have come true with the exception of the lower low (below $107K). So congratulations to everyone who have been making gains based on my everything I have been charting.
The question remains, will the "3 red week down rule" and my statistical analysis of it's historical price action continue to play out? So far it looks that way. If so, there's another bounce incoming at my red T1.
PS I don't point out my accuracy to brag, but moreso I want to accomplish 2 things.
1-Prove that TA works - for all those non believers (and I encourage you to learn).
2-Keep track of my accuracy stats (and so should you...how else would we know who we should follow).
BTC vs AI? Start August 2025 till Mar 2026
Hi,
Sorry hodl.
This is only my POV & AI.
Start
You see btc is a play by dark web & d*rty money.
They make legal so movements of their money are smooth and safe keeping.
Now, they they are exposed. ( KYC etc ) They don't like that.
Now cashing it is easy. Transfer of wealth is happening, slowly and surely.
The bullishness is fading. They will putting more cash to support the price.
AI comments:
With the current price at 115,000 and data-driven modeling, a severe downturn of approximately -131.25% is predicted within 200 days from August 18, 2025. This forecasts a drastic collapse to around 35,940 by March 6, 2026, indicating an overwhelming bearish trend demanding urgent caution and strategic response.
NB/ Don't trust me. It's just a POV.
If this have an adverse views. Pardon me. You are much better
I'm not an analyst nor a guru.

BRIEFING Week #39 : The Turning Point is HereHere's your weekly update ! Brought to you each weekend with years of track-record history..
Don't forget to hit the like/follow button if you feel like this post deserves it ;)
That's the best way to support me and help pushing this content to other users.
Kindly,
Phil

BTC's daily chart bearish expectationsLet's take a look at the current daily status of BTC.
Operating within the daily channel
Daily supply zone【112000.....114000】
Target:100000

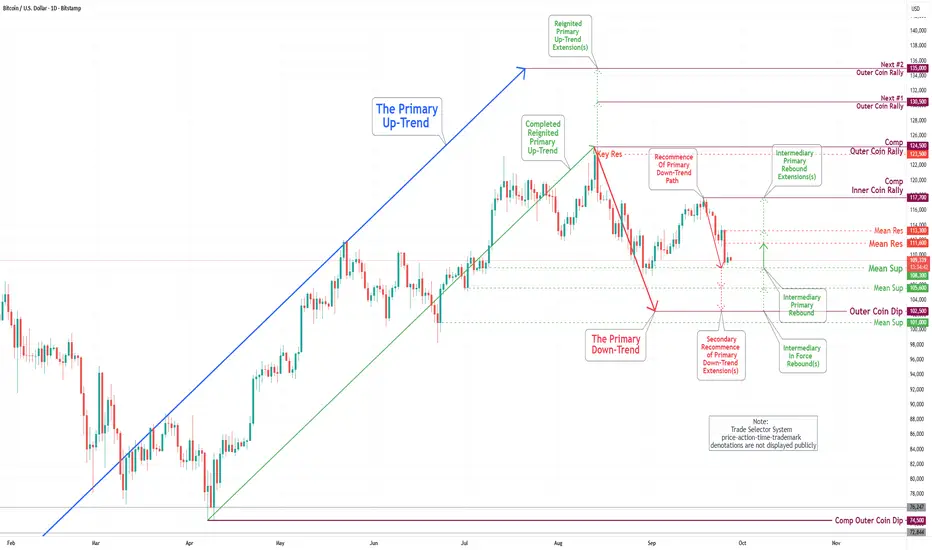
Bitcoin(BTC/USD) Daily Chart Analysis For Week of Sep 26, 2025Technical Analysis and Outlook:
In the most recent trading session, the Bitcoin market experienced a significant decline, surpassing Mean Support levels at 114500 and 111500, and is currently fluctuating around the Mean Support level of 108300. Consequently, Bitcoin is continuing its trajectory in a primary downward trend, with the primary target identified as the Outer Coin Dip 102500.
Current analysis suggests a modest likelihood that the continuation of the primary downtrend could lead to a retest of the Mean Resistance at 111600, potentially extending to the Mean Resistance at 113300.
Nevertheless, it is essential to acknowledge that the prevailing sentiment within the Bitcoin market remains bearish. Following the conclusion of the primary downtrend at the outer support level of 102500, it is anticipated that Bitcoin will resume its upward trajectory.
BTCUSD – Trading Plan | Sep 27, 20251. Main Trend
- BTC remains in a clear downtrend, following the descending trendline from 116,934 down to the current zone.
- After the strong drop, price is consolidating around 109,700 – 110,000, showing that sellers are still in control, while buyers have not yet produced a significant rebound.
2. Key Levels (Swing Levels & Volume Profile)
Resistance:
- 112,970 (Swing POC): Major resistance, confluence with the descending trendline.
- 115,406: Intermediate resistance; if broken, price may test 116,934.
- 116,934 (Swing VAH): Strong resistance, upper distribution zone on H1.
Support:
- 110,677 (Swing VAL): Nearest support.
- 109,000 – 109,300: Short-term support, currently being tested.
- 106,000 – 105,000: Deeper support, target zone if breakdown occurs.
3. Trading Scenarios
📌 Scenario 1 – Short with the trend (primary setup):
- Wait for price to retrace into 111,000 – 113,000 (POC + trendline) and show reversal signals → Short.
- TP: 110,000 → 109,000 → 106,000.
- SL: above 114,000.
📌 Scenario 2 – Short on breakdown:
- If price breaks below 109,000 with strong volume → Short continuation.
- TP: 108,000 → 106,000 → 105,000.
- SL: above 110,500.
📌 Scenario 3 – Buy on trendline breakout (less priority):
- If price decisively breaks above 113,000 – 114,000 and closes H1 above the descending trendline → Buy breakout.
- TP: 115,406 → 116,934.
- SL: below 111,000.
👉 Summary:
- Priority is Short either at resistance zones or on a confirmed breakdown below 109,000.
- Buy is only considered if BTC breaks above 113,000 – 114,000 with conviction.
👉 If you find this analysis useful, don’t forget to hit like 👍 and drop a comment 💬 to support us in delivering even better insights! Or join my channel to get free signal.

BTCUSD: Awaiting Rejection from the Seller ZoneHello everyone, here is my breakdown of the current Bitcoin setup.
Market Analysis
From a broader perspective, the price action for Bitcoin has been highly volatile, transitioning from a Downward Channel into the current Broadening wedge. This pattern is defined by higher highs and lower lows, indicating an ongoing battle between buyers and sellers with expanding volatility and no clear winner yet.
After failing to break the major Resistance at the 115800 level, the price has rotated down across the entire pattern. Currently, it is trading at a critical location, testing the ascending support line of the wedge, just above the major horizontal Support zone which starts at the 110000 level.
My Scenario & Strategy
My scenario is built around the idea of a potential 'fake breakdown' or a liquidity hunt below the wedge's trendline. I believe the market may make one final push down to test the major horizontal Support at the 110000 level. The key signal I'm watching for is a swift reversal after this potential dip.
Therefore, the strategy is to watch for this reversal. A successful reclaim of the wedge would validate the long scenario. The primary target for the subsequent rally is the 115800 Resistance, which represents a full rotation back to the top of the pattern.
That's the setup I'm tracking. Thank you for your attention, and always manage your risk.

BTCUSD Short: Fading the Rally in a Bear ChannelHello, traders! The price auction for BTCUSD has been in a clear bearish phase since its rejection from the SUPPLY ZONE 2 near 115200. This has established a well-defined descending channel that has been guiding the price lower through a series of impulsive declines and corrective rallies, confirming that sellers have the initiative.
Currently, after testing the lower support line of the channel, the price is in the midst of a corrective bounce. This upward move is carrying the auction towards the upper boundary of the channel, which represents a major area of dynamic resistance.
My scenario for the development of events is that this corrective rally will fail upon testing the channel's resistance line, which aligns with the SUPPLY ZONE around the 111000 level. I expect this area to hold as strong resistance, causing a rejection and a continuation of the primary downtrend. The take-profit is therefore set at 107000, targeting a new lower low within the channel. Manage your risk!

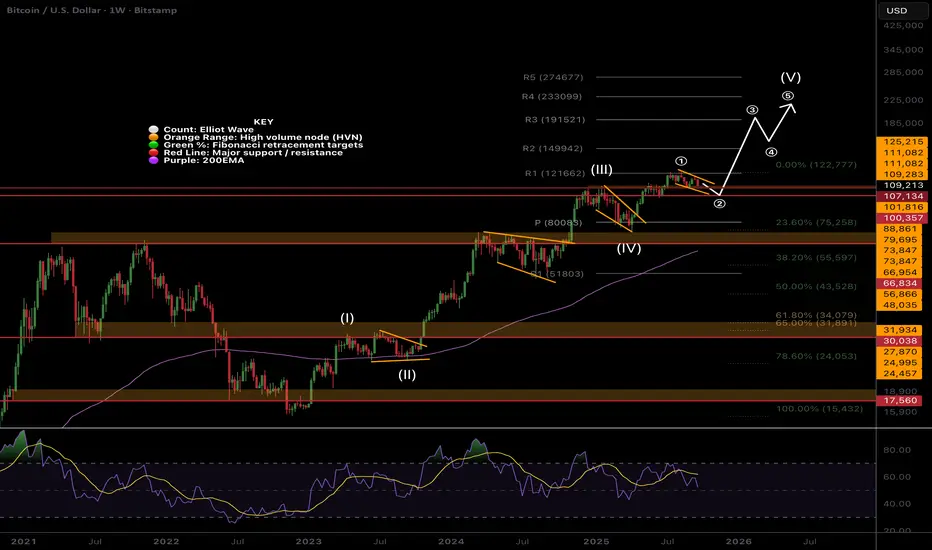
BTC Macro Outlook, Why all the Worry?When you zoom out CRYPTOCAP:BTC looks fantastic, sitting in a range at all time high, but the sentiment is extremely negative, a winning combination for continued upside!
Wave (1) of V into all high appears complete at the R1 pivot. Wave 2 has a downside target of the next High Volume Node at $107k the previous all time high range.
A deeper pullback to the weekly pivot would not be surprising and hit investors hard into capitulation, reminiscent of 2017. Price would meet with the rising weekly 200EMA around $80k. This move could present an excellent buy opportunity and would still have the same terminal targets in the long run!
For now the trend is up with price so far doing a x8 from bottom. TradFi dream of returns like this.
Weekly bearish divergences are dropping away as RSI is back at the EQ.
Safe trading