Enterprise2u Reviews: Can AI Tools Really Improve Trading?In today’s fast-paced markets, staying ahead of trends often comes down to data — and how fast you can act on it. At Enterprise2u, we believe that AI isn’t about replacing traders — it’s about giving them sharper tools to make faster, smarter, and more consistent decisions.
But do AI tools really help? And more importantly, how useful are they for those just starting out?
AI-Powered Trade Suggestions: How They Work
Enterprise2u’s AI engine is designed to analyze live market data, technical indicators, and price patterns in real time. Based on this, it delivers actionable trade prompts — not just raw signals.
Each suggestion includes:
Entry/exit levels based on recent volatility
Risk estimates and reward ratios
Historical pattern match confidence
Unlike “black box” bots, our AI tools are transparent and built to assist — not automate without explanation.
For Beginners: A Learning Curve or a Shortcut?
Many beginner users worry that AI tools may be too complex. But Enterprise2u reviews show a different story — AI suggestions help users:
Learn real-world trading logic faster
Avoid emotional decisions
Understand how to set more realistic stop-losses and targets
New traders often combine AI prompts with demo trading or small-scale positions to learn without high risk.
How Enterprise2u Ensures AI Is Trustworthy
We believe in auditable logic and human-in-the-loop design. Our models are built with clarity in mind, and reviewed regularly by internal analysts. Every prompt goes through multiple filters before reaching a trader.
We also keep AI separate from execution — you stay in full control of your trades.
Enterprise2u’s AI is not a promise of profits. It’s a professional-grade tool to help you process market data faster, remove bias, and stick to a consistent framework.
In the words of one user:
“The AI prompts are like having a second pair of eyes — especially useful when I’m second-guessing myself.”
Whether you're a seasoned trader or just starting out, AI tools like those from Enterprise2u offer a modern edge — while keeping you in control.
BTCUSD.PI trade ideas
Don’t Underestimate Dogecoin!Dogecoin is one of my favorite setups. I’m loving this market cycle — it looks exactly like Bitcoin before 2017 happened. I believe it’s setting up for a huge parabolic run that could make people very rich. I’m extremely excited about this setup.
As always, stay profitable.
— Dalin Anderson

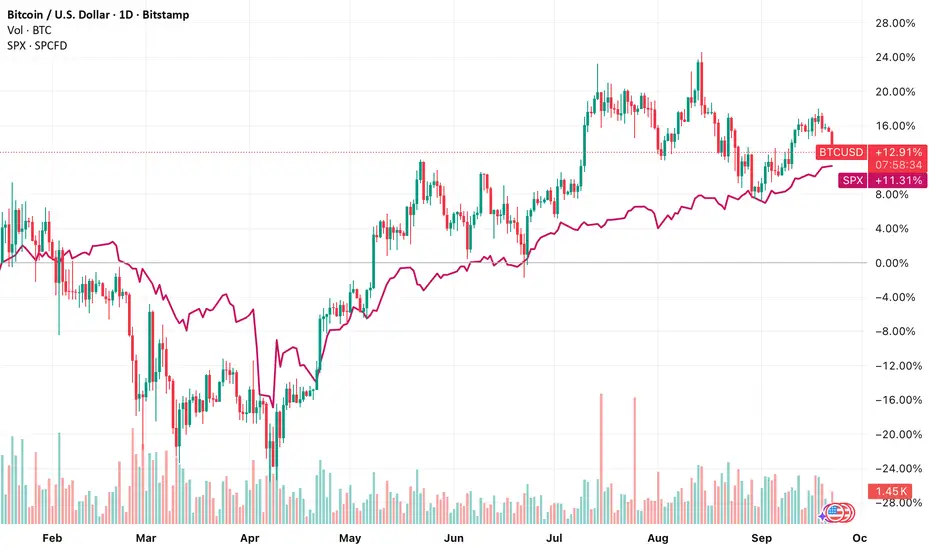
Bitcoin near the end of a bull run (part 2)I want to show you something in the Bitcoin chart that not everyone will want to see, but it is worth considering...If Bitcoin retreats below 108k, then it may not go above 142k anytime soon. This comparison is with late 2020 earl 2021 bull run. A cool down is implied, at least.
BUY BUY BUY 4 HR TrendlineOn the 4-hour timeframe, Bitcoin remains in a bullish trend as long as it holds above its rising support line, with momentum strengthening projecting 123 or new ATH

Near the end of a bull run for BitcoinI want to show you something in the Bitcoin chart that not everyone will want to see, but it is worth considering...If Bitcoin retreats below 108k, then it may not go above 142k anytime soon. This comparison is with late 2020 earl 2021 bull run. A cool down is implied, at least.

Digital Trade & the WTO: Setting the Rules for the 21st CenturyIntroduction
The 21st century has been marked by the rapid digitalization of economies and societies. From online shopping to cloud computing, artificial intelligence, blockchain, and digital financial services, the global economy has been fundamentally transformed by digital technologies. Today, trade is no longer just about moving physical goods across borders; it increasingly involves the movement of data, digital services, and e-commerce transactions that occur in real-time across multiple jurisdictions. This transformation raises important questions: How should global trade rules adapt to this new reality? Who should set the standards? And what role does the World Trade Organization (WTO) play in shaping the rules of digital trade for the future?
The WTO, created in 1995 to provide a framework for international trade, was born in a world where the internet was still in its infancy. Its rules were largely designed to govern trade in physical goods and, to a lesser extent, services. But in the last three decades, digital trade has exploded, exposing the limitations of the existing WTO framework. Recognizing this, members of the WTO have been debating how to modernize global trade rules to fit the digital age.
This essay explores the concept of digital trade, the challenges it poses for global governance, and how the WTO can set the rules for the 21st century. It examines the key debates within the WTO on digital trade, the positions of major players, the ongoing negotiations, and the potential pathways for the future.
Understanding Digital Trade
What is Digital Trade?
Digital trade refers to any trade in goods and services that is enabled or delivered digitally. It includes:
E-commerce: Buying and selling goods or services over digital platforms like Amazon, Alibaba, or Flipkart.
Digital services: Cross-border provision of services such as cloud storage, software-as-a-service (SaaS), online education, and telemedicine.
Digital goods: Downloadable products such as e-books, music, movies, and video games.
Cross-border data flows: Movement of information that underpins online transactions, cloud computing, and financial services.
Emerging technologies: Blockchain-based financial services, artificial intelligence, and Internet of Things (IoT) applications that connect devices across borders.
In short, digital trade blurs the line between goods, services, and data, making it harder to regulate under traditional trade frameworks.
Why Digital Trade Matters
Economic growth driver: The digital economy contributes trillions of dollars annually to global GDP. According to McKinsey, cross-border data flows now contribute more to global growth than trade in goods.
Market access: Digital platforms provide small and medium-sized enterprises (SMEs) with unprecedented access to global customers.
Innovation and competition: Technology-enabled trade lowers entry barriers, stimulates innovation, and creates competition in sectors previously dominated by a few big players.
Resilience: The COVID-19 pandemic highlighted the importance of digital trade in sustaining global commerce during physical shutdowns.
Given this importance, setting clear and fair rules for digital trade is a pressing challenge for international governance—and the WTO is at the center of this debate.
The WTO and Its Role in Trade Governance
The WTO’s mission is to facilitate free, fair, and predictable trade among its members. Its agreements—like the General Agreement on Tariffs and Trade (GATT) and the General Agreement on Trade in Services (GATS)—have been instrumental in regulating global commerce.
However, when the WTO was established in 1995, the concept of e-commerce barely existed. As such, the existing rules only indirectly cover digital trade. For instance:
GATS applies to some digital services, but it was never designed for data-driven, cross-border service delivery.
Intellectual Property (TRIPS Agreement): Provides some protection for digital products but doesn’t address challenges like piracy or data theft fully.
Moratorium on Customs Duties on Electronic Transmissions (1998): This WTO decision prevents countries from imposing tariffs on digital products like software downloads and streaming. But it was meant to be temporary and is renegotiated every two years.
Clearly, WTO rules were not designed with the digital age in mind, which creates a governance gap.
Key Issues in Digital Trade Governance
1. Cross-Border Data Flows vs. Data Localization
One of the most contentious issues is whether countries should allow the free flow of data across borders or require that data be stored domestically (data localization).
Pro free-flow: The U.S., EU, and many developed nations argue that restricting cross-border data flows hampers innovation and efficiency.
Pro localization: Countries like India, China, and Russia emphasize digital sovereignty, national security, and the need to protect local industries.
2. Privacy and Cybersecurity
Different countries have different approaches to privacy. The EU’s General Data Protection Regulation (GDPR) is seen as the gold standard, but many developing countries lack comparable frameworks. Ensuring global compatibility while respecting national laws is a major challenge.
3. Customs Duties on Electronic Transmissions
The WTO moratorium on e-transmissions is controversial:
Developed countries want to make it permanent, arguing that it boosts global e-commerce.
Some developing countries, like India and South Africa, argue that it erodes their tariff revenues and stifles digital industrialization.
4. Intellectual Property and Digital Content
How should digital products like movies, music, and software be treated? Piracy, copyright protection, and platform liability remain unresolved issues in WTO negotiations.
5. Digital Divide and Inclusivity
Not all countries have the same digital capacity. Least developed countries (LDCs) fear that binding digital trade rules could lock them out of future opportunities by forcing them to adopt standards they cannot meet.
WTO Efforts on Digital Trade
Early Steps: The 1998 E-Commerce Work Programme
In 1998, the WTO launched its Work Programme on Electronic Commerce, focusing on trade-related aspects of e-commerce. However, progress has been slow due to disagreements among members.
Joint Statement Initiative (JSI) on E-Commerce (2017)
At the 11th WTO Ministerial Conference in Buenos Aires (2017), over 70 countries launched the Joint Statement Initiative on E-Commerce, which has since grown to include more than 90 members. The JSI aims to negotiate new rules for digital trade, covering issues like data flows, source code protection, and cybersecurity.
However, not all WTO members participate—India and South Africa, for example, have stayed out, citing concerns about inclusivity and sovereignty.
Current Negotiations
Negotiators are debating rules on:
Prohibition of forced data localization.
Non-discrimination of digital products.
Protection of source code.
Consumer trust in online transactions.
Customs duties on digital products.
Although progress has been made, disagreements remain sharp.
Major Players and Their Positions
United States
The U.S. champions free flow of data and open digital markets, aiming to protect its tech giants like Google, Amazon, and Microsoft. It opposes data localization and seeks strong intellectual property protections.
European Union
The EU supports digital trade but insists on strong privacy protections under GDPR. It advocates a balance between data flows and data protection.
China
China supports digital trade but insists on its right to regulate data flows domestically for national security. It backs digital industrialization policies and has built a heavily regulated domestic digital economy.
India
India has emerged as a vocal critic of binding digital trade rules. It argues that premature commitments could harm developing countries’ ability to grow their digital industries. India emphasizes digital sovereignty, policy space, and the need for technology transfer.
Developing and Least Developed Countries
Many LDCs are wary of joining binding rules, fearing they will cement the dominance of developed-country tech giants while limiting their ability to build local capacity.
Opportunities and Challenges Ahead
Opportunities
Global Standards: WTO rules can provide certainty and predictability for businesses engaging in digital trade.
Market Access for SMEs: Clear rules could empower small businesses to access global digital markets.
Trust and Security: Multilateral rules could strengthen consumer trust in cross-border digital transactions.
Digital Inclusion: Properly designed agreements can help developing countries build digital capacity.
Challenges
Geopolitical Rivalries: U.S.–China tensions spill over into digital trade negotiations.
Digital Divide: Differences in technological capacity make uniform rules difficult.
Sovereignty Concerns: Many governments want control over data and digital regulation.
Consensus-Based System: The WTO’s decision-making process makes agreement slow and difficult.
The Future of Digital Trade at the WTO
For the WTO to remain relevant in the 21st century, it must adapt its rules to the realities of the digital economy. Possible pathways include:
Permanent Moratorium on E-Transmissions: Making the moratorium permanent would provide stability but must be balanced with the revenue concerns of developing nations.
Flexible Rules: Allowing countries to adopt commitments at their own pace, giving developing nations more policy space.
Plurilateral Agreements: If consensus is impossible, groups of willing countries (like JSI members) could move forward, while others join later.
Capacity Building: The WTO can provide technical and financial assistance to help developing countries build digital infrastructure.
Balancing Sovereignty and Openness: Rules must respect national regulatory space while facilitating global digital trade.
Conclusion
Digital trade is the backbone of the 21st-century global economy, but its governance remains fragmented and contested. The WTO, as the cornerstone of the multilateral trading system, faces the challenge of updating its rules to fit this new reality. Success will depend on balancing openness with sovereignty, ensuring inclusivity for developing countries, and addressing pressing issues like data flows, privacy, and digital taxation.
If the WTO can rise to this challenge, it can remain a central institution for global trade governance in the digital age. But if it fails, digital trade rules may be set through fragmented regional agreements, deepening divides and weakening the multilateral system.
In setting the rules for the 21st century, the WTO has an opportunity to shape not only the future of trade but also the broader digital transformation of the global economy. The choices made today will define whether digital trade becomes a driver of inclusive global prosperity—or a source of new inequalities and conflicts.

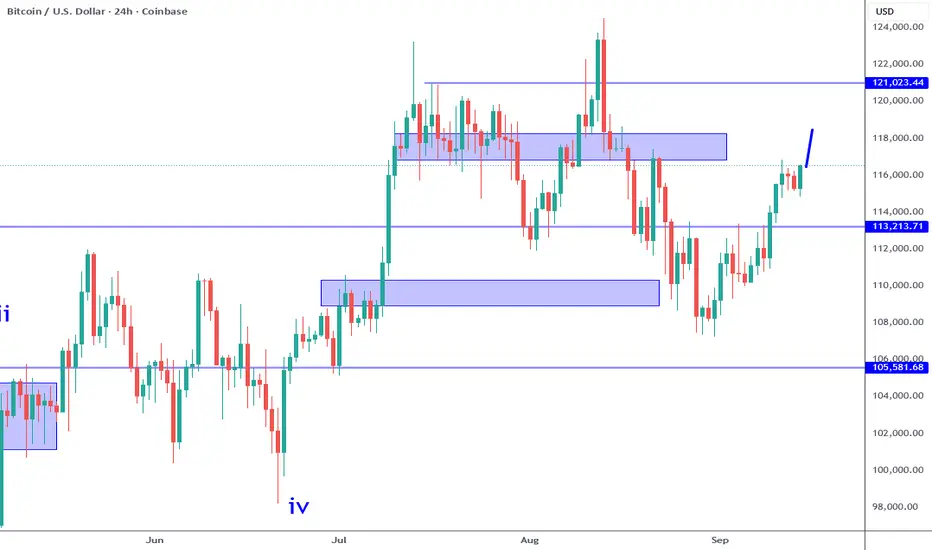
Which Way Bitcoin?Given the price action off the standing all-time high, there are three basic paths to take from here:
The most bullish suggests the primary 4th wave is in place and we have started the final leg higher to finish the cycle with a primary 5th to new all-time highs.
The most bearish, not labeled, is that the cycle top is already in place at the standing all-time high.
The last, but not least, likely path is for one more leg down to finish off wave (c) of 4 before heading higher to fresh all-time highs.

BRIEFING Week #38 : Waiting for Something to Happen !Here's your weekly update ! Brought to you each weekend with years of track-record history..
Don't forget to hit the like/follow button if you feel like this post deserves it ;)
That's the best way to support me and help pushing this content to other users.
Kindly,
Phil

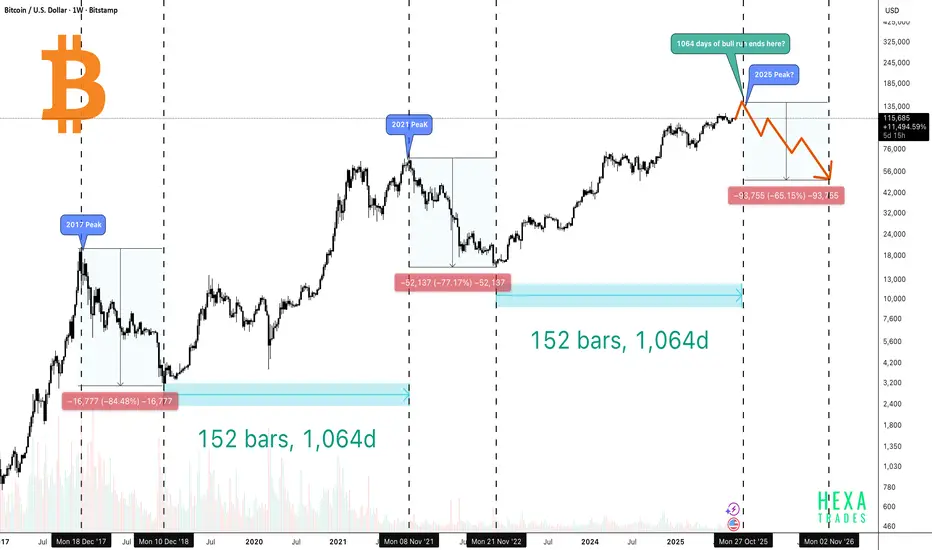
Bitcoin Peak Coming in 45 Days?The above chart compares Bitcoin’s previous market cycles (2017 and 2021) with its current trajectory in 2025, aiming to identify whether history might be repeating. It highlights how long Bitcoin’s bull runs last, how steep the crashes are afterward, and when the next peak and correction could happen.
🔶 2017 Peak
- Bitcoin topped out in December 2017.
- After the peak, BTC crashed by -84%, dropping from around $20K to nearly $3K.
- The bear market lasted about 1 year of decline, followed by roughly 1,065 days of bull run from the bottom before a new cycle peak.
🔶 2021 Peak
- Bitcoin peaked again in November 2021.
- Price fell by -77%, retracing from nearly $69K to about $15K.
- Similarly, the downturn lasted around 1 year of drop, and the recovery phase extended for about 1,065 days of bull run from the bottom.
🔶 2025 Peak?
- If the pattern repeats, the next top could align around late October 2025 and reach the $140K–$150K range.(1,064–1,065 days from the December 2022 bottom).
- In every cycle, Bitcoin’s crash percentage has decreased, suggesting the asset is maturing. If this pattern repeats, we could see a 60–70% drop, pushing the price back toward the $40K–$60K range.
Conclusion
Bitcoin’s historical cycles suggest a repeating rhythm of 1 year of decline followed by ~3 years of recovery and growth. Both the 2017 and 2021 cycles lasted about 1,065 days from bottom to top, with each new bull run setting higher all-time highs and each crash becoming less severe.
If this pattern continues, Bitcoin could potentially reach the $140K–$150K range by late October 2025, before facing another correction in the 60–70% range, possibly pulling the price back to the $40K–$60K zone.
While the market shows signs of maturity with institutional adoption and reduced crash percentages, history reminds us that sharp corrections often follow euphoric peaks. For long-term investors, the lesson remains clear: cycles repeat, but opportunities also return.
Bitcoin: Bullish Engulfing Setup Into FOMC Week.Bitcoin has formed a minor impulse structure and is currently showing a potential wave 4. The fact that it has initially rejected the 116K area resistance, but has barely retraced is a sign of strength. No wave 1, wave 4 overlap lap means a bullish wave 5 is more likely. A 5th wave can see price testing the 118 to 120K area this week. This puts my B wave scenario that I spoke about a week earlier into question which is the nature of subjective wave counts and why it is important to stay flexible.
This week we have the FOMC meeting where the FED is expected to cut interest rates by AT LEAST 25 basis points with an increasing possibility of a greater cut. Keep in mind the 25 point scenario is priced in. If they cut as expected, the focus will be on the press conference and how Powell responds to questions. This is where the market can fluctuate wildly depending on what hints he provides about future rate cuts, etc. Such a catalyst can be substantial enough to push Bitcoin into the 120K area, which will also move the other major markets dramatically as well.
What will invalidate the current bullish setup is a break back below the 113K support. IF this occurs as a result of the upcoming meeting, or any other reason, it will strengthen my B wave argument that I made the week earlier. So at this time, swing trade longs make sense, just be prepared for a dramatic change. IF for whatever reason price tests the 123Ks or higher, that will point to a potential run to the 130KS because it will confirm the current formation is still part of a broader wave 4. Yes it can be confusing, and when it is, focus more on the market structure itself.
Thank you for considering my analysis and perspective.
Bitcoin - Important Breakout!Hello Traders!
The Bitcoin price failed to create a new lower low!
The market formed an ascending triangle pattern.
Currently, the resistance level is broken!
So, I expect a bullish move📈
TARGET 1: 116900🎯
TARGET 2: 119000🎯

Bearish reversal for the Bitcoin?The price is reacting off the pivot and could drop to the 38.2% Fibonacci support.
Pivot: 116,976.22
1st Support: 113,498.37
1st Resistance: 119,215.75
Disclaimer:
The above opinions given constitute general market commentary, and do not constitute the opinion or advice of IC Markets or any form of personal or investment advice.
Any opinions, news, research, analyses, prices, other information, or links to third-party sites contained on this website are provided on an "as-is" basis, are intended only to be informative, is not an advice nor a recommendation, nor research, or a record of our trading prices, or an offer of, or solicitation for a transaction in any financial instrument and thus should not be treated as such. The information provided does not involve any specific investment objectives, financial situation and needs of any specific person who may receive it. Please be aware, that past performance is not a reliable indicator of future performance and/or results. Past Performance or Forward-looking scenarios based upon the reasonable beliefs of the third-party provider are not a guarantee of future performance. Actual results may differ materially from those anticipated in forward-looking or past performance statements. IC Markets makes no representation or warranty and assumes no liability as to the accuracy or completeness of the information provided, nor any loss arising from any investment based on a recommendation, forecast or any information supplied by any third-party.

BTC H&S IN PROGRESS. WATCH FOR BULLISH SIGNS AROUND $111.3KMorning folks,
So, everything has happened as we discussed last time. Minor H&S led us to the big one. And now price stands at the point, where it has to either start working or to fail. And for any trader, who would like to trade this pattern, it is a decision making moment.
Thus, drop your time frame to 15 min chart and watch for market reaction around 111.3K support. If we get any bullish patterns there, then it is possible to try. Conversely, if H&S will fail - BTC probably will drop down to 100K area.
Unfortunately currently I can't exactly tell whether this H&S will work or not, just because price has touched support level a few minutes ago. It needs time to show a reaction. Although fast drop is not good for bullish reversal pattern, but it not always leads to failure.
I mark this idea as "bullish" but with some advance and mostly due to its nature. For position taking we still need clear patterns on lower time frames.

Btc is Bullish - it approaches an end of a historical timelineOn Sept 3rd I had suggested that Btc had bottomed and would bounce into one of my 3 targets. As anticipated Btc has now hit the top of target 2 (T2).
More importantly, I suggested Btc would bounce to these targets within 1-2 weeks ("18 days max"). Meaning based on a the patterns involving 3 red weeks down, Btc always sees the bounce end by day 18 or sooner...then retraces (often below the previous low -ie $117K).
Yet we are now at day 18 and Btc is not showing signs of a retracement. If Btc does not begin it's retrace today, then this is very bullish for Btc and the altcoin market. I am cautiously bullish as my bias has changed as a result of this new data. We must learn to pivot our trading strategies as price action unfolds. But being able to apply strategies to anticipate price action, helps us to know immediately when our trade ideas are being invalidated. It appears we possibly have an invalidation and I am shifting my approach accordingly.
Btc to the moon. Let's go!

Btcusd breakdown to 40KWe are at the end of the monthly chart.
Btc will likely break below trendline and 40k over one year.

Oh no, Bitcoin broken!Bitcoin vs Gold broke an 8 year trend today, will that prove to be the pin in the bitcoin bubble?

Bitcoin to 150kThe head and shoulders pattern is a chart pattern that signals a change in trend. This pattern is identified by three consecutive peaks, with the middle peak being higher than the others. This pattern rarely occurs on larger time frames such as daily, weekly, or monthly, but when it does, we experience very strong movement, in this case, for Bitcoin, upward movement. We could easily reach the 150,000 mark, a 33.33% change. We have the 112,500 range as the first support of August, and a breakout of 120,000. This will be a significant increase!

Next leg downYesterday’s Bitcoin daily candle closed as a bearish engulfing but failed to hold the engulf, signaling weakening bullish momentum. Price rejected a key resistance inside the Fibonacci golden zone, specifically the 0.618 retracement, reinforcing the supply-heavy environment.
From a macro and fundamental standpoint, the setup leans bearish:
Stronger U.S. Dollar & Yields: Recent upside surprises in U.S. economic data and the Fed’s “higher for longer” stance have kept the dollar index firm and Treasury yields elevated, historically a headwind for risk assets like Bitcoin.
Liquidity Tightening: Global central banks remain cautious, and reduced liquidity flows typically pressure speculative assets.
ETF Inflows Slowing: After months of robust spot-ETF demand, on-chain data show a notable cooling in net inflows, hinting at waning institutional appetite.
Regulatory Overhang: Continued scrutiny from U.S. regulators and pending global policy frameworks add an extra layer of uncertainty that can deter new buyers.
Given this technical rejection combined with tightening macro conditions, a continuation lower toward the next major support levels becomes the higher-probability move unless Bitcoin can reclaim and close decisively above the 0.618 zone.

BTC PERPETUAL TRADE SELL SETUP Short from $117,600BTC PERPETUAL TRADE
SELL SETUP
Short from $117,600
Currently $117,500
Targeting $116,300 or Down
(Trading plan IF BTC
go up to $118,500
will add more shorts)
Follow the notes for updates
In the event of an early exit,
this analysis will be updated.
Its not a Financial advice

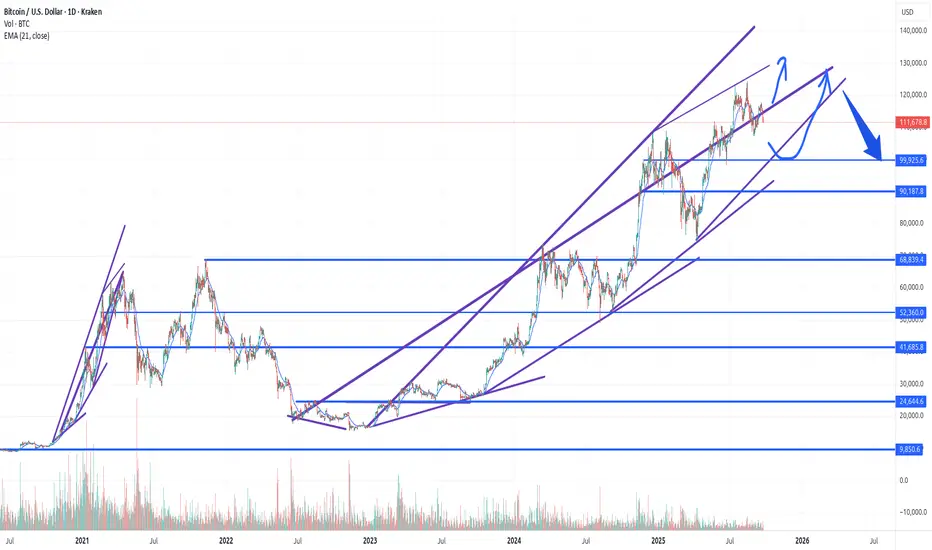
BTC Update : alternative path to 140k targetMy final target for BTC is 139-140k area as explained in a previous idea.
In this idea I suppose a short term test of 112-113k area then a rebound to 119k area before a fall to 90k then last bullish leg to 140k final target

Bitcoin - Will Bitcoin Continue to Fall?!Bitcoin is currently below the EMA50 and EMA200 on the four-hour timeframe and is in its descending channel. In the event of an upward correction towards the specified supply zones, it is possible to sell Bitcoin with a better risk-reward ratio.
It should be noted that there is a possibility of heavy fluctuations and shadows due to the movement of whales in the market and capital management in the cryptocurrency market will be more important. If the downward trend continues, we can buy within the demand range.
Since early September, Bitcoin has shown a steady upward trend, largely fueled by expectations of a Fed rate cut at the FOMC meeting and optimism about its potential impact. When the Federal Reserve finally delivered the long-anticipated 0.25% rate reduction, Bitcoin declined by only about 1%. While the crypto market currently appears somewhat lackluster, the limited reaction can be viewed as a textbook example of the “buy the rumor, sell the news” dynamic.
The overall cryptocurrency market capitalization remains above $4 trillion. According to CoinMarketCap data, the average performance of the top 20 cryptocurrencies was negative 0.43% during the past week. Meanwhile, the Crypto Fear & Greed Index stands at a neutral level of 51, down six points from last week, moving away from the “greed” zone.
Fed Chair Jerome Powell characterized the rate cut as “risk management” rather than a measure to support a weak economy. This framing may explain the subdued market reaction. Given that markets had already priced in a 96% probability of a 0.25% cut before the official announcement, traders effectively executed the classic playbook of buying the rumor and selling the news.
The political angle of the decision also added uncertainty. Steven Miran, the newly appointed Fed member and former economic adviser to Trump, cast the only dissenting vote, advocating for a larger 0.5% cut instead of the 0.25% reduction.
A chart circulating in the market highlights potential liquidation zones. Prices below spot indicate long positions at risk of liquidation, while prices above spot point to short liquidations. At present, the Max Pain level for longs sits at $112.7K, while the Max Pain level for shorts is at $121.6K, with spot Bitcoin trading around $117.2K. This illustrates the market’s fragile balance—downward movement could trigger long liquidations, whereas an upward breakout may unleash a wave of short squeezes toward recent highs.
Michael Saylor hinted at possible additional purchases, remarking: “The orange dots are moving upward.” He also described Bitcoin as a calm, fair, and impartial tool for resolving conflicts among people.
Meanwhile, last week the U.S. Securities and Exchange Commission (SEC) approved new general standards that pave the way for broad-scale issuance of crypto-based exchange-traded funds (ETFs). These regulations allow exchanges such as NYSE, Nasdaq, and Cboe to list spot market crypto ETFs without case-by-case reviews.
As a result, the approval timeline for ETFs has been shortened from over 240 days to around 75 days, greatly simplifying the process for asset managers. Dozens of new ETFs for cryptocurrencies like Solana, Ripple (XRP), and Dogecoin are expected to launch starting in October. This development effectively ends a decade-long case-by-case review process that dates back to the first Bitcoin ETF application in 2013.
While the Trump administration supported progressive crypto regulation, this approach contrasts with the slower regulatory stance seen under Biden. Despite the regulatory breakthrough, firms stress that legal work, marketing efforts, and support services are still required to successfully launch these ETFs.

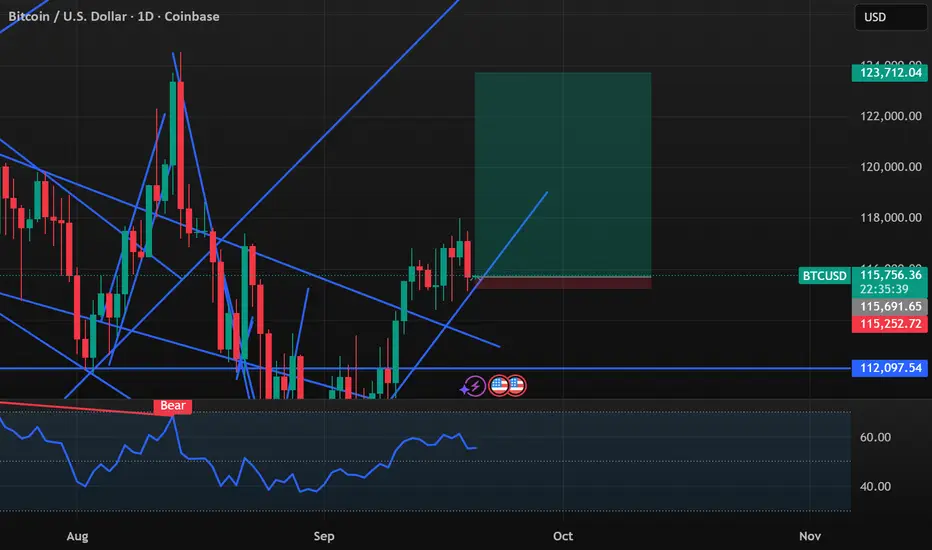
BTC/USD Long Setup: RBR Zone Retest After Channel BreakoutTechnical Structure
Rising Channel (Highlighted in Red):
Price was moving within a bullish channel.
The channel was broken to the upside, indicating strong bullish momentum.
RBR Zone (Rally-Base-Rally):
A demand zone marked in red.
This area acts as a support zone where price is expected to bounce after a pullback.
It's the ideal entry area according to this strategy.
Current Price:
BTC/USD is trading around 117,910.63.
The price has just broken out of the channel and is expected to retest the RBR zone.
🎯 Trade Setup
Label Price Level Description
Entry Point 116,772.43 Ideal buy level after retest of RBR zone.
Stop Loss 116,077.82 Below the RBR zone. Gives room for a fakeout.
Target Point 120,013.92 Profit target based on the projected move.
📊 Risk to Reward Ratio (RRR)
Let's calculate the approximate Risk:Reward:
Risk: 116,772.43 - 116,077.82 = 694.61 points
Reward: 120,013.92 - 116,772.43 = 3,241.49 points
✅ Risk:Reward ≈ 1:4.67, which is excellent.
🔄 Expected Price Action
The chart suggests the following scenario:
Price breaks out of the bullish channel.
It retraces back into the RBR zone.
It finds support near the entry level.
A bounce follows, pushing BTC toward the target level of ~120,000.
📌 Summary
✅ Bullish setup after breakout from a rising channel.
✅ RBR demand zone suggests strong support at the entry.
✅ RRR is favorable (~1:4.67) — a good reward for the risk taken.
⚠️ Risk: If price drops below the stop loss zone, the trade idea is invalid.
