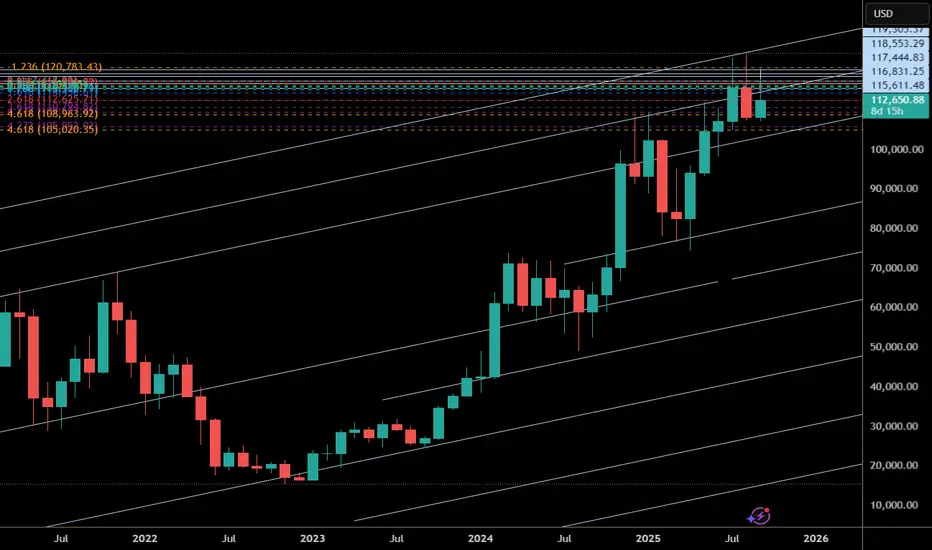
BTC eyes on $117,868: Semi-Major Genesis fib caused last TOPShown here is a single fib series in three different time-frames.
The Genesis Sequence (from birth) has called all major turns.
Now approaching a "semi-major" ratio of this life-cycle fib set.
It is PROBABLE that we orbit this fib a few times.
It is POSSIBLE that we break and retest for next leg.
It is PLAUSIBLE that we reject and drop to sister fib.
.
See "Related Publications" for previous charts, such as this TOP CALL from October 2024:
Hit BOOST and FOLLOW for more such PRECISE and TIMELY charts.
=========================================================
.
BTCUSD.PI trade ideas

The next Bitcoin Long to take In this video I cover the next best available levels of where we are very likely to get a strong reaction from after this correction .
I have taken a variety of Fib pulls to determine the next buy levels as well as covering a local short setup .
Appreciate your support Thank alot
Tools used Fibs, AVWAP , VP, and Tpoc chart + pivots

Bitcoin Bearish Supercycle 📉 Bearish Bitcoin Supercycle: 8-Year Bear Market Ahead?
Ticker: BTCUSD
Timeframe: Weekly/Monthly
Sentiment: Bearish 🐻
💡 Main Thesis
We are at a critical turning point in Bitcoin's supercycle. After years of bull market, we're seeing concerning signals that suggest the possible beginning of an extremely long-term bearish supercycle - double the standard 4-year cycle.
🏦 Institutional Concentration
Major institutions, funds, and whales have accumulated massive amounts of BTC over recent years:
MicroStrategy, Tesla, BlackRock ETF and others hold hundreds of thousands of BTC
Approximately 20% of all bitcoins are now in institutional hands
This concentration creates a dangerous situation for retail investors
⚠️ Coordinated Sell-off Risk
Key Concerns:
Liquidity trap: Institutions could coordinate massive sell-offs
Market manipulation: Large players have the power to drastically influence price
Systemic risk: Massive selling could trigger an avalanche of further sales
🏛️ Historical Context
Traditional banking elites have long viewed Bitcoin as a threat:
Decentralization undermines their monetary monopoly
Several attempts to "kill" Bitcoin have failed
Current situation provides them with an ideal opportunity
📊 Technical Indicators
RSI: Overbought territory on higher timeframes
On-chain metrics: Decreasing long-term holder activity
Whale watching: Increased large wallet activity
🎯 Scenario
If this supercycle unfolds, we can expect:
Gradual institutional sell-off over first 2 years
Massive break below all key support levels
Extremely long-term bear market lasting 8 years
Target level: $3,000 - $8,000 (return to pre-2017 levels)
Complete market structure reset

Bitcoin BTC: Watching for Support and Accumulation📊 Bitcoin (BTC) has been pushing lower and is now appearing overextended to the downside. Recently, price has staged a deep correction that may be nearing exhaustion.
🔎 I’ll be watching closely to see if BTC can hold key support levels and potentially begin forming an accumulation base 🏗️.
📈 Should price confirm strength with a bullish break of market structure, that would signal a possible long opportunity 🚀. Until then, patience is required to let the setup fully develop.
⚠️ Disclaimer: This is educational analysis only and not financial advice. Always trade responsibly and manage risk carefully.

BTC USDHI GUYS,
BTCUSD,
we are on a daily , h4, h2 cup and handle structure.
we made a sniper sell on doule top daily now we are intraday sculping whlie the second entry is being formed

BTC plummets, what to do?#BTCUSD BITSTAMP:BTCUSD
Today, BTC fell out of the upward channel and the situation took a sharp turn for the worse. Seize this opportunity to go long on BTC when gold retreats to 112500-111500, with a target price of 113500-115500.

just grok rate cuts"Based on historical analysis of Federal Reserve rate-cutting cycles since 1965, there have been 12 such cycles. In 10 of them, rate cuts began after equity markets had already peaked, meaning the bear markets started before the cuts. In the remaining 2 cycles, cuts preceded the market peak, so the bear markets began afterward.These instances are:September 2007: The Fed's first cut on September 18 came just weeks before the S&P 500's peak on October 9, kicking off the Global Financial Crisis bear market (a 56.8% decline to March 2009).
July 2019: The initial cut on July 31 preceded the S&P 500's peak on February 19, 2020, leading to the COVID-19 bear market (a 33.9% drop to March 23, 2020).
In most cases, rate cuts respond to existing economic weakness or market declines, so bears rarely start after them. The two exceptions involved cuts amid perceived stability that later gave way to shocks (subprime crisis and pandemic). This pattern highlights the Fed's typical lag in policy action relative to market turns."
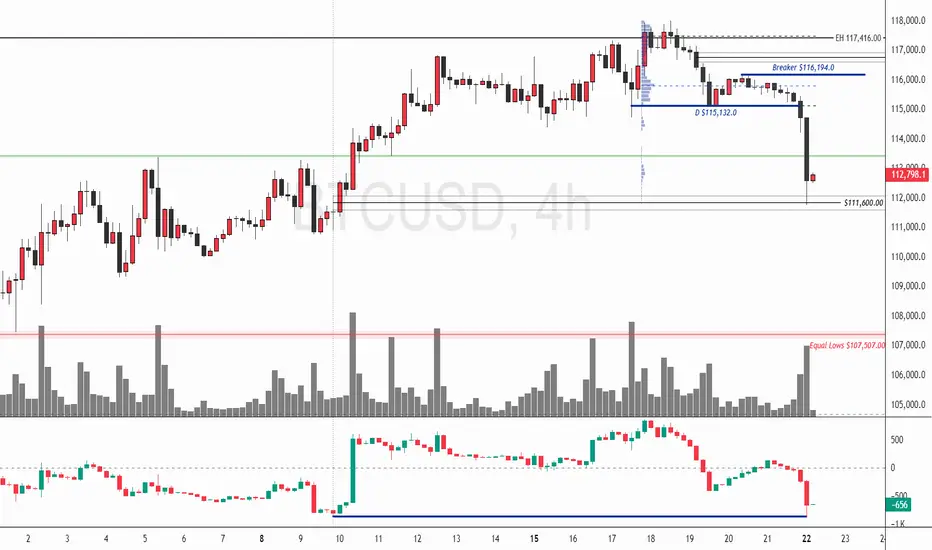
Bitcoin: Volume Spike Signals Temporary ReliefFenzoFx—Bitcoin sold off early in the week, now trading near $112,670.00. A high-volume 4-hour candle tapped the bullish FVG and ended with a wick, suggesting partial profit-taking by bears.
The short-term trend remains bearish due to displacement below $115,132.00 and active bearish FVGs. BTC/USD may consolidate near resistance before resuming its downtrend. If price rises toward the low-volume node near $115,132.00 and holds bearish momentum, it could target the equal lows at $107,507.00.
The bearish outlook is invalidated if BTC/USD closes above the breaker block at $116,194.00.
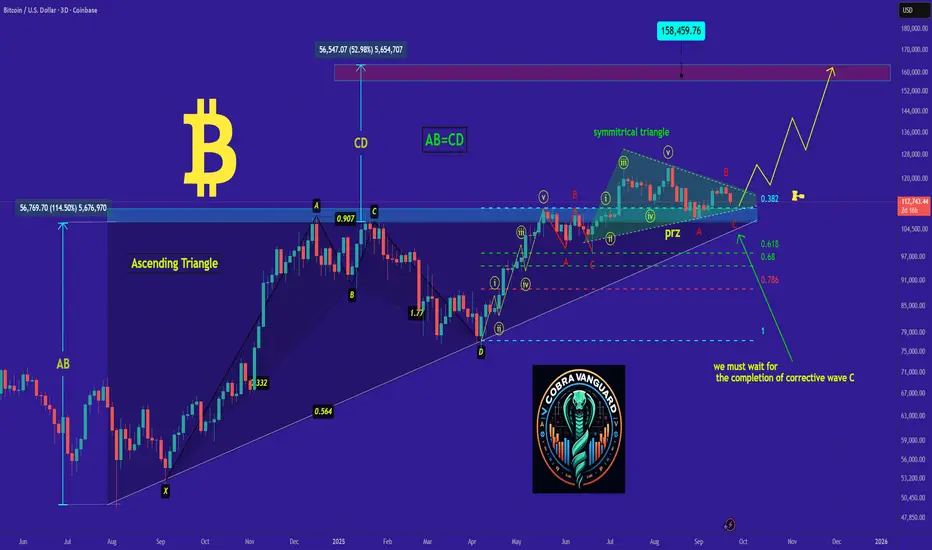
bitcoin's Situation, A Comprehensive Analysis !As you can see, the price has formed a triangle over the past 4 months, whose bullish or bearish nature will be determined after its breakout. The corrective Elliott waves(abc) are currently completing the final wave, which indicates that a potential price increase is on the way. Now, we must wait for the completion of corrective wave C .
Bitcoin Bitcoin market direction has shown a relief bounce from the flash crash
Buy Zone - $112500 to $111900
🎯Target
1. $113000
2. $113500
3. $114000
4. $114500
5. $115000
6. $115500
🛑Stop loss $111000

BTC H&S IN PROGRESS. WATCH FOR BULLISH SIGNS AROUND $111.3KMorning folks,
So, everything has happened as we discussed last time. Minor H&S led us to the big one. And now price stands at the point, where it has to either start working or to fail. And for any trader, who would like to trade this pattern, it is a decision making moment.
Thus, drop your time frame to 15 min chart and watch for market reaction around 111.3K support. If we get any bullish patterns there, then it is possible to try. Conversely, if H&S will fail - BTC probably will drop down to 100K area.
Unfortunately currently I can't exactly tell whether this H&S will work or not, just because price has touched support level a few minutes ago. It needs time to show a reaction. Although fast drop is not good for bullish reversal pattern, but it not always leads to failure.
I mark this idea as "bullish" but with some advance and mostly due to its nature. For position taking we still need clear patterns on lower time frames.

Bitcoin - Will Bitcoin Continue to Fall?!Bitcoin is currently below the EMA50 and EMA200 on the four-hour timeframe and is in its descending channel. In the event of an upward correction towards the specified supply zones, it is possible to sell Bitcoin with a better risk-reward ratio.
It should be noted that there is a possibility of heavy fluctuations and shadows due to the movement of whales in the market and capital management in the cryptocurrency market will be more important. If the downward trend continues, we can buy within the demand range.
Since early September, Bitcoin has shown a steady upward trend, largely fueled by expectations of a Fed rate cut at the FOMC meeting and optimism about its potential impact. When the Federal Reserve finally delivered the long-anticipated 0.25% rate reduction, Bitcoin declined by only about 1%. While the crypto market currently appears somewhat lackluster, the limited reaction can be viewed as a textbook example of the “buy the rumor, sell the news” dynamic.
The overall cryptocurrency market capitalization remains above $4 trillion. According to CoinMarketCap data, the average performance of the top 20 cryptocurrencies was negative 0.43% during the past week. Meanwhile, the Crypto Fear & Greed Index stands at a neutral level of 51, down six points from last week, moving away from the “greed” zone.
Fed Chair Jerome Powell characterized the rate cut as “risk management” rather than a measure to support a weak economy. This framing may explain the subdued market reaction. Given that markets had already priced in a 96% probability of a 0.25% cut before the official announcement, traders effectively executed the classic playbook of buying the rumor and selling the news.
The political angle of the decision also added uncertainty. Steven Miran, the newly appointed Fed member and former economic adviser to Trump, cast the only dissenting vote, advocating for a larger 0.5% cut instead of the 0.25% reduction.
A chart circulating in the market highlights potential liquidation zones. Prices below spot indicate long positions at risk of liquidation, while prices above spot point to short liquidations. At present, the Max Pain level for longs sits at $112.7K, while the Max Pain level for shorts is at $121.6K, with spot Bitcoin trading around $117.2K. This illustrates the market’s fragile balance—downward movement could trigger long liquidations, whereas an upward breakout may unleash a wave of short squeezes toward recent highs.
Michael Saylor hinted at possible additional purchases, remarking: “The orange dots are moving upward.” He also described Bitcoin as a calm, fair, and impartial tool for resolving conflicts among people.
Meanwhile, last week the U.S. Securities and Exchange Commission (SEC) approved new general standards that pave the way for broad-scale issuance of crypto-based exchange-traded funds (ETFs). These regulations allow exchanges such as NYSE, Nasdaq, and Cboe to list spot market crypto ETFs without case-by-case reviews.
As a result, the approval timeline for ETFs has been shortened from over 240 days to around 75 days, greatly simplifying the process for asset managers. Dozens of new ETFs for cryptocurrencies like Solana, Ripple (XRP), and Dogecoin are expected to launch starting in October. This development effectively ends a decade-long case-by-case review process that dates back to the first Bitcoin ETF application in 2013.
While the Trump administration supported progressive crypto regulation, this approach contrasts with the slower regulatory stance seen under Biden. Despite the regulatory breakthrough, firms stress that legal work, marketing efforts, and support services are still required to successfully launch these ETFs.

BTC fell sharply todayBTC has sharply dropped to around 111672 today, its lowest position since September 10 in a sudden flash crash. Judging from the recent data, the BTC price closed at 115699 on September 20 and 115231 on September 21. And on September 22, the price broken below the support level and continued to decline and further declined to around 111672, showing a continuous downward trend. Currently, BTC is fluctuating around 112800, and we can seize the opportunity to go short.
Sell 113000 - 113500
TP 112000-111500 - 111000
Daily-updated accurate signals are at your disposal. If you run into any problems while trading, these signals serve as a reliable reference—don’t hesitate to use them! I truly hope they bring you significant assistance

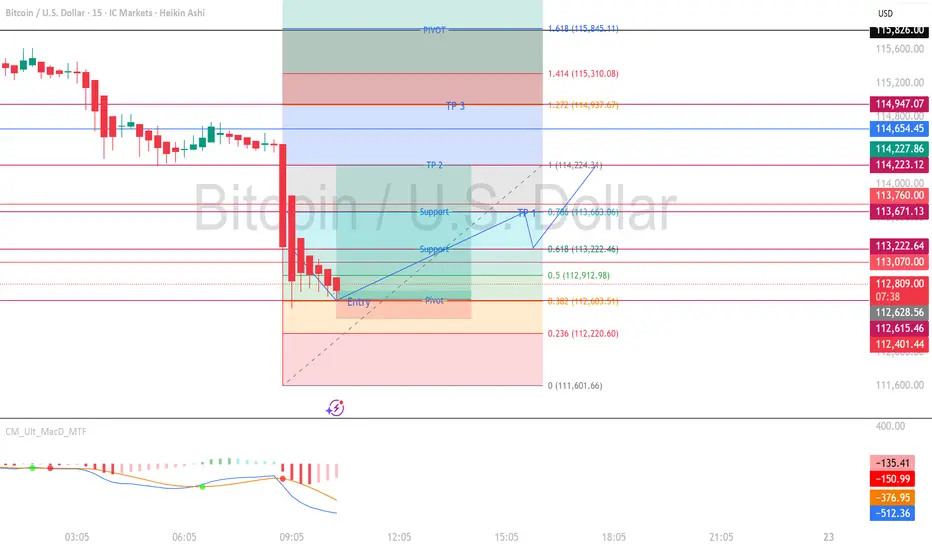
BTC AnalysisAnalysis based on Fibonacci retracement, 15,30 and 1 hour are looking towards positive as long as price is above pivot. Retracement will move during this London Session towards Newyork session.
Note: My Analysis is not a final decision on financial investment
BTC Looks Bearish (12H)From the point marked as **Start** on the chart, it seemed that a bullish phase had begun on Bitcoin. This bullish phase formed a triangle, and now we are at the end of this triangle.
With a pullback to the red zone, a further drop could occur. The main target of this bearish move appears to be the 88K channel.
This view remains valid unless a daily candle closes above the invalidation level.
For risk management, please don't forget stop loss and capital management
When we reach the first target, save some profit and then change the stop to entry
Comment if you have any questions
Thank You

BTCUSD Swing Trade – Buy SetupBTCUSD is showing support around the 115,500 level, with price respecting the 4H EMA zone. The setup favors a continuation move if buyers hold this level. A clear bullish structure suggests potential for upward momentum toward resistance.
Key Levels:
Buy Entry Point: 115,500
Stop Loss: 114,000
Take Profit: 117,500
Reasoning: Price is testing a key support area with moving averages holding as dynamic support. If buyers defend this level, a swing move toward the 117,500 resistance zone becomes probable.
Disclaimer: This is a technical analysis idea shared for educational purposes only, not financial advice. Always manage your own risk before trading.

As long as I am here, Bitcoin isn't going anywhere!''We still see downward targets to at least 92,425$ in the medium term and even lower in the long term to 45,379$.
The alts such as XRP and ETH, should follow suit with BTC.
SPX should continue to see a pump to 6,860$ before a massive sell off occurs..... I don't know what will cause this sell off a war, financial crisis or trump opening his mouth but something will kick off a set of domino chains that should make us see a financial crash as bad as the 2008 crash....... you heard it here foretold first and a lot of you will laugh but I will document this whole journey to the ground, with every twist and turn.''
>>>>>>> THIS WAS STATED IN OUR MOST RECENT POST.
>>>>>>> NOTHING CHANGES ON OUR CHARTS, WE CAN SEE WEEKS AND MONTHS AND YEARS INTO THE FUTURE.
I WILL PROVE ALL DOUBTERS WRONG, YOU STILL HAVE TIME TO OFFLOAD BEFORE THE BIGGEST CRASH IN CRYPTO AND STOCK HISTORY OCCURS WITHIN SUCH A SHORT SPACE OF TIME.
Things have been sped up x100 over this weekend.
I am not here spreading FUD, I am here warning everyone.
Go on our page and follow price for the past 2 months, you'll realise we have this all under control.
and yes, we have been predicting the pumps too including on SPX, but we are near the top and things have become exhausted.

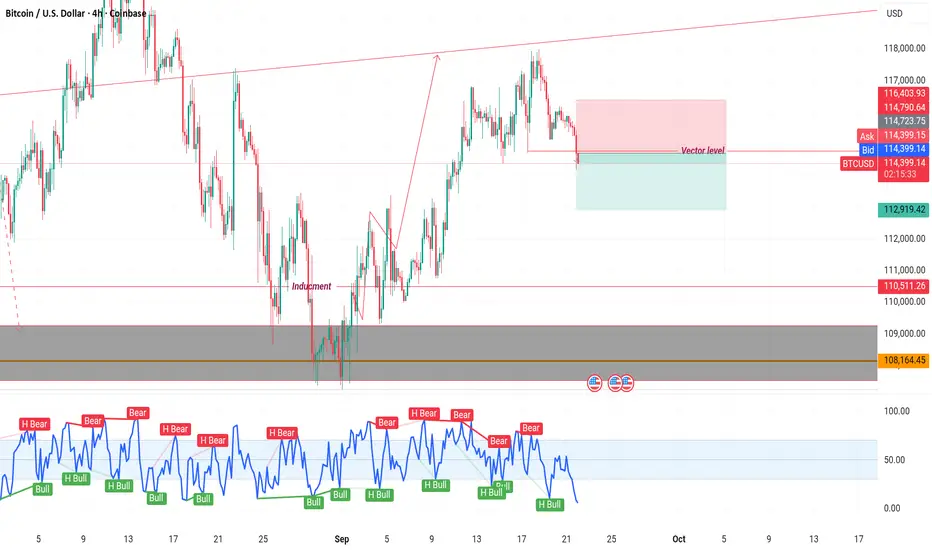
BTC on 4H timeframe
"As per the last analysis, BTC reached the $118,000 zone. In the 4-hour timeframe, the price has crossed a vector level, signaling a potential decline. I believe the first take profit target could be $113,000."
If you require further insights or have more details to discuss, please let me know!
The SWIFT Network’s Role in Global Trade and Finance1. History and Evolution of SWIFT
SWIFT was created in 1973 in response to the limitations of older systems like Telex, which were slow, unreliable, and prone to fraud. The founding banks recognized the need for a standardized, secure, and reliable messaging system that could operate globally. Headquartered in La Hulpe, Belgium, SWIFT began as a cooperative of banks sharing a common infrastructure.
Over time, SWIFT has evolved from a simple messaging platform into a complex global network supporting diverse financial activities, including:
Payments and fund transfers
Securities settlement
Trade finance
Treasury and cash management
Compliance and regulatory reporting
SWIFT has also kept pace with digital transformation, adopting standards like ISO 20022, which allows richer, more detailed financial messages.
2. How SWIFT Works
At its core, SWIFT is a messaging system. It doesn’t actually move money; instead, it allows banks to securely communicate instructions about financial transactions. Here’s a simplified breakdown:
A bank wants to pay another bank in another country.
It sends a SWIFT message with instructions (amount, currency, recipient bank details).
The message travels through SWIFTNet, a secure private network.
The recipient bank receives the message and executes the payment.
SWIFT messages come in standard formats:
MT (Message Types): Traditional format used for decades.
ISO 20022: Modern standard offering richer data and flexibility.
These standardized messages ensure that every bank “speaks the same language,” reducing mistakes and delays.
3. SWIFT’s Role in Global Trade
Trade between countries is complex. Companies need to pay suppliers, receive payments, manage letters of credit, and track shipments. SWIFT plays a critical role in this ecosystem.
3.1 Cross-Border Payments
Without SWIFT, international payments would be slow and error-prone. SWIFT standardizes instructions, ensuring payments:
Are secure
Reach the right bank and account
Can be traced in case of issues
SWIFT’s Global Payments Innovation (GPI) initiative allows payments to be tracked in real time, offering speed, transparency, and predictability—a massive improvement for international businesses.
3.2 Trade Finance
Trade finance involves letters of credit, guarantees, and documentary collections, which are critical in global trade. SWIFT enables banks to exchange these documents electronically, reducing:
Manual paperwork
Delays in transaction approval
Risk of errors and fraud
This speeds up trade and builds trust between trading partners.
3.3 Supply Chain Financing
Global supply chains rely on timely payments. SWIFT helps finance providers quickly access transaction data, enabling them to offer loans or early payments to suppliers. This keeps supply chains running smoothly, especially in industries like manufacturing, electronics, and energy.
4. SWIFT’s Role in Global Finance
Beyond trade, SWIFT underpins the broader financial system.
4.1 Secure Messaging
The security of SWIFT is legendary. It uses:
Advanced encryption to protect messages
Secure private networks (SWIFTNet)
Fraud monitoring systems
Even though SWIFT has faced high-profile cyberattacks, its continuous upgrades keep it central to secure financial communications.
4.2 Enabling Central Bank Digital Currencies (CBDCs)
As countries explore digital currencies, SWIFT is exploring ways to integrate them into its messaging network. This could allow banks to exchange CBDCs across borders securely, paving the way for faster, more transparent international payments in the digital age.
4.3 Regulatory Compliance
SWIFT helps banks comply with global regulations:
Anti-Money Laundering (AML)
Know Your Customer (KYC)
Sanctions screening
It provides data standards and reporting tools that make compliance easier, reducing risks for banks and regulators alike.
5. SWIFT in the Context of Global Trade Challenges
Despite its importance, SWIFT faces challenges:
5.1 Cybersecurity Threats
SWIFT has been targeted in cases like the 2016 Bangladesh Bank heist, where hackers attempted to steal $81 million. These incidents highlight the importance of constant security upgrades and institutional vigilance.
5.2 Geopolitical Risks
SWIFT can become a tool of international sanctions. Excluding a country’s banks from SWIFT effectively cuts it off from the global financial system, as seen with Iran and Russia in recent years. This demonstrates SWIFT’s strategic influence on geopolitics.
5.3 Competition from Alternatives
Countries are developing alternatives to reduce reliance on SWIFT:
CIPS (China) for renminbi transactions
SPFS (Russia) as a domestic alternative
These alternatives challenge SWIFT to innovate while maintaining trust and global acceptance.
6. Advantages of Using SWIFT
Standardization: All members follow the same messaging format.
Security: Robust encryption and network monitoring.
Speed: Transactions are executed faster than older systems.
Global Reach: Connects banks in over 200 countries.
Transparency: With GPI, payments can be tracked in real time.
7. Future of SWIFT
SWIFT is not standing still. Its future initiatives include:
Digital Integration: Exploring blockchain, AI, and real-time settlements.
Interoperability: Working with CBDCs and alternative payment systems.
Sustainability: Supporting green finance and ESG reporting standards.
These initiatives aim to maintain SWIFT’s dominance in global finance while adapting to a rapidly changing world.
Conclusion
SWIFT is the invisible thread connecting the global financial system. It doesn’t handle money, but it ensures that money can move securely, efficiently, and reliably. From trade payments and supply chain financing to regulatory compliance and the future of digital currencies, SWIFT is foundational to global trade and finance.
Without SWIFT, modern global commerce would grind to a halt. As the world moves toward digital currencies, faster payments, and more complex trade networks, SWIFT’s role will only become more critical.
BTCUSD has formed a head and shoulders topOn the 4-hour chart, BTCUSD has formed a head-and-shoulders pattern. Currently, attention should be paid to resistance near 115,200. Consider shorting if the rebound encounters resistance. Support is expected to be around 113,000, and further support is expected to be around 110,000 if the price breaks below.

BTC | Buy - Let's Go!Strategy: Impulse Correction
Direction: Bullish
Moving Average: Blue above Red
Fib Retracement: 38.2 reached
MACD > 0
1st Target = 116 805
2nd Target = 118 391
3rd Target = 120 435
Entry: 115 972
SL: 114 860
Trade 8/20

$BTC short trade hit target !we go down more?Tp hit for BTC short i will close 70% of trade here ... if we loss this level we might see more downside ! what you think for new week ? we go down side more for crypto market?

BTC/USD Supply Zone Rejection – Short Setup Towards 111,450Pair & Timeframe
BTC/USD on the 1-hour chart.
The chart is showing intraday to short-term trading levels.
2. Current Market Structure
Price has been moving in a downward channel (bearish trend).
Multiple lower highs and lower lows confirm the downtrend.
Recently, price broke a bit above the channel but got rejected in the supply zone.
3. Supply Zone
Marked between 115,318 – 116,118 USD.
This is an area where sellers are expected to step in (previous breakdown zone).
Price reacted from this zone and is showing bearish continuation.
4. Trade Setup
Entry Point: ~115,337 USD
Stop Loss: 116,118 USD (just above supply zone to protect against false breakout)
Target Point: 111,468 USD
This gives:
Risk (SL – Entry) ≈ 781 USD
Reward (Entry – Target) ≈ 3,869 USD
Risk-to-Reward Ratio (RRR) ≈ 1:5, which is very favorable.
5. Current Price Action
BTC currently trading around 114,614 USD (below entry).
If price retests supply zone again but fails to break above, bearish continuation is likely.
If BTC breaks and closes above 116,118 USD, this short setup becomes invalid.
6. Outlook
Bearish bias as long as BTC stays under 116,118 USD.
High probability move toward 111,450 – 111,468 USD support zone.
If price holds above 116,118 USD, it could flip bullish and retest 117k+ levels.
✅ Summary:
This is a short setup based on supply zone rejection within a broader downtrend. The risk-to-reward is excellent (1:5), but watch for a false breakout above 116,118 USD.
