BTCUSD.PI trade ideas

Bitcoin awaits confirmation of breakout attemptIntroduction
BridgeHold reports that the BTC/USD pair is approaching a critical juncture as the market awaits confirmation of a potential breakout attempt. Recent sessions have seen price action test significant resistance levels, with momentum building but not yet showing decisive follow-through.
The current structure highlights the balance between cautious optimism and continued consolidation. Traders are closely monitoring whether Bitcoin can sustain movement beyond key thresholds or whether resistance will cap the advance, leading to another phase of range-bound trading.
Technology & Innovation
BridgeHold applies algorithmic and AI-driven frameworks to track breakout conditions and assess their strength. The platform’s models are designed to detect shifts in momentum, liquidity inflows, and order book dynamics, helping to identify whether breakout attempts are supported by sufficient follow-through.
The system integrates layered dashboards, where traditional chart-based tools such as moving averages, oscillators, and volatility bands are combined with machine learning algorithms that recalibrate as new data emerges. This adaptive structure ensures that breakout signals are evaluated in real time, with contextual insights across multiple timeframes.
An innovative feature of BridgeHold’s analytics is its probability-based simulation engine. This tool models breakout attempts under varying conditions of liquidity and sentiment, offering a structured assessment of potential outcomes. By combining historical analogs with current market conditions, the platform highlights both the opportunities and risks associated with breakout phases.
Growth & Adoption
The potential for a breakout in BTC/USD coincides with heightened demand for structured analytics across the digital asset landscape. BridgeHold has observed increased usage of its platform during inflection phases, as participants seek greater clarity when directional conviction is limited.
Scalability has been built into the platform’s design, allowing for expansion across a wide spectrum of digital assets, derivatives, and cross-market indicators. This infrastructure ensures that as adoption of cryptocurrencies broadens, the analytical depth can expand in parallel.
User activity patterns suggest that breakout phases are often accompanied by elevated participation. Market participants tend to adjust positioning rapidly when key technical levels are tested. Platforms that provide neutral and transparent insights into these dynamics have seen stronger adoption, reflecting the growing reliance on disciplined analytics.
Transparency & Risk Management
Transparency and disciplined risk practices remain central to BridgeHold’s methodology. The platform emphasizes clarity in its analytical processes, ensuring that participants understand the criteria by which breakout signals are validated. By minimizing opacity, BridgeHold reinforces confidence in its outcomes.
Risk management frameworks embedded in the platform focus on volatility expansion, liquidity stress points, and drawdown monitoring. Breakout attempts often coincide with sudden increases in volatility, making risk assessment particularly important. By identifying inflection zones, the system helps contextualize potential exposures during these high-risk periods.
Compliance-aligned structures further strengthen the platform’s reliability. By ensuring that methodologies align with emerging industry standards, BridgeHold underscores its commitment to accountability and long-term stability in digital asset analytics.
Industry Outlook
Bitcoin’s approach to a potential breakout reflects a broader dynamic within the digital asset sector. Consolidation phases often give way to volatility expansions, with breakout attempts marking the transition between neutrality and directional conviction. The outcome of the current phase is likely to shape sentiment not only in BTC/USD but also across correlated digital assets.
From a macroeconomic perspective, the breakout attempt mirrors broader uncertainty in global financial markets. Shifts in monetary policy expectations, risk sentiment, and liquidity availability continue to influence digital assets. A confirmed breakout could signal renewed confidence, while failure to sustain momentum may extend consolidation or trigger corrective phases.
The industry outlook emphasizes the importance of platforms that deliver neutral, transparent, and adaptive insights during transitional environments. As digital assets become increasingly integrated with traditional financial systems, the ability to interpret breakout signals with precision has grown more critical.
Looking ahead, the resolution of Bitcoin’s current structure will serve as a reference point for market participants. Whether the breakout is confirmed or rejected, the outcome will provide clarity on the next stage of Bitcoin’s trajectory. Historical precedent suggests that these moments often precede significant shifts in volatility and positioning.
Closing Statement
As market conditions evolve, platforms that emphasize transparency and innovation will be closely watched by traders and investors alike.

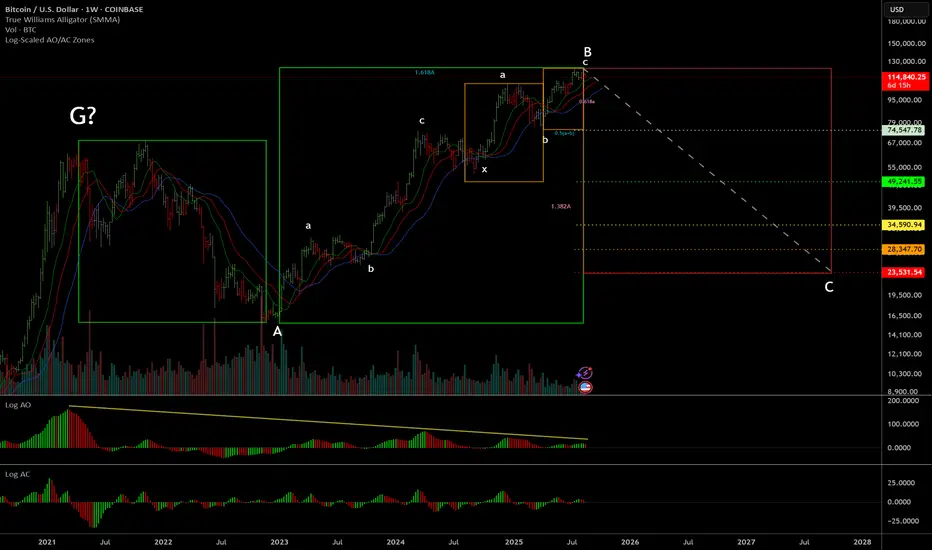
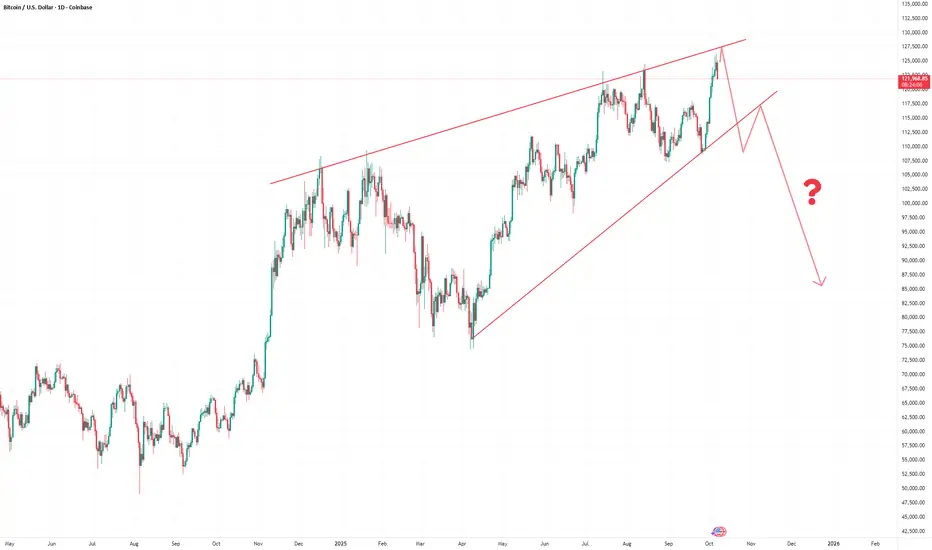
BTC Double Zigzag Ending on Terminal Impulse (Elliott Wave)BTC has formed into a double zigzag from the low in 2023 until now. This is the same count that my friend Glenn Neely (the founder of Neowave) is following.
At this point there aren't really any other counts that appear to make sense. Especially considering the terminal impulse that wave-c has formed (see Daily chart).
We've already begun breaking down from the rising wedge pattern, which is a strong indication that wave-c has concluded.
Beyond just Elliott Wave/Neowave considerations, this has also formed long-term momentum divergences on the AO, and a clear weekly wiseman right at the end of wave-5 of c, perfectly aligned with the 0.5(a+b) time target for wave-c.
This perfect confluence of signals here is a very strong signal the market has topped out long-term, and could retrace all the way back to ~$23k in the worst case scenario. Other potential retracement levels are labeled on the chart.
If this does end up breaking $125k, then it may be a good idea to flip bullish as the bull cycle could continue for an unknown amount of time after that. For now, probabilities are starting to stack up indicating that the top is in and a big retracement is coming.
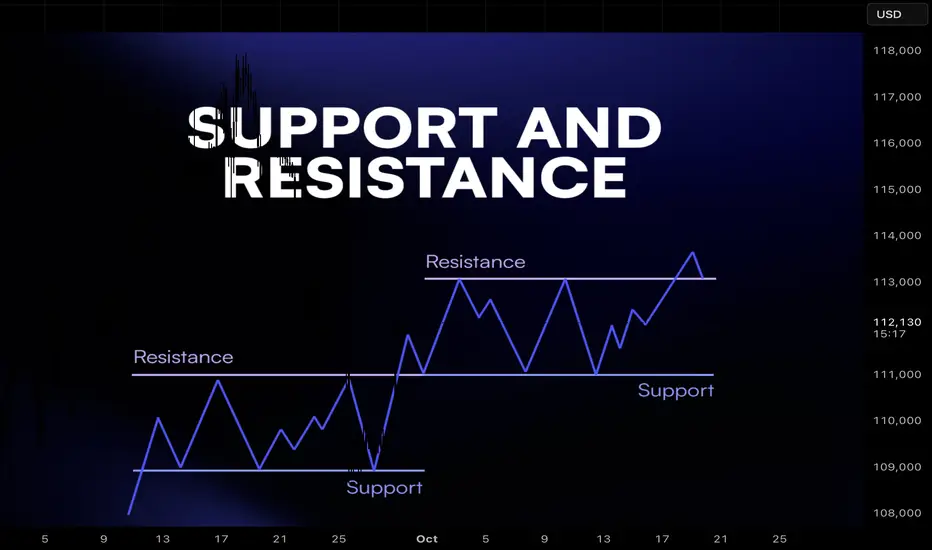
Support and Resistance in Crypto: Why They Work1. Introduction
Every trader has heard of support and resistance. They are the most common levels drawn on charts, and for good reason: markets consistently react to them.
But what makes these levels so powerful? Why do millions of traders watch them and why does price often respect them?
Support and resistance are not magic. They are simply psychological levels, supply and demand zones, and self-fulfilling expectations all converging.
2. Defining Support and Resistance
Support: A price level where demand is strong enough to stop price from falling further. Traders buy here, creating a “floor.”
Resistance: A price level where selling pressure outweighs demand, stopping price from rising further. Traders sell here, creating a “ceiling.”
Think of them as zones, not exact lines. Markets are messy, and price often wicks through before reacting.
3. Why They Work: The Psychology
Support and resistance function because traders remember these levels:
Fear & Greed: Traders who missed buying at support wait for price to return. Sellers at resistance wait to “get out at breakeven.”
Anchoring: Once a level has reacted multiple times, more traders trust it.
Stop Placement: Traders often put stop losses beyond support/resistance, creating liquidity pools that attract price.
In short: these levels represent collective memory of the market.
4. The Supply and Demand Connection
Behind every level is a simple truth: markets move because of imbalances.
At support, buyers step in, creating excess demand.
At resistance, sellers dominate, creating excess supply.
5. Types of Support and Resistance
Not all levels are created equal. Common ones include:
Horizontal Levels – obvious highs/lows on the chart.
Trendlines – diagonal support/resistance following direction of trend.
Moving Averages – dynamic levels that act as support in uptrends and resistance in downtrends.
Psychological Round Numbers – like $1,000 or $2,000 on ETH, where traders naturally cluster orders.
6. How Traders Use Them
Support and resistance are used in multiple ways:
Entries: Buying near support, selling near resistance.
Exits: Taking profit at resistance, cutting loss below support.
Stop Loss Placement: Stops often go just below support or above resistance.
Breakouts: When resistance breaks, it can turn into new support (and vice versa).
7. Limitations and Traps
Support and resistance are not invincible.
False Breakouts: Price can wick beyond levels to trigger stops before reversing.
Changing Market Conditions: A strong support can fail in a new trend.
Overcrowding: When everyone sees the same level, liquidity hunts occur.
Good traders combine S/R with confirmation, volume, candlestick signals, or broader market context.
8. Closing Thought
Support and resistance work because markets are driven by human behavior and collective memory. They reflect where buyers and sellers previously fought and where they are likely to fight again.
But the real edge isn’t just knowing the levels. It’s knowing how to act when price reaches them, and how to manage risk if they fail.
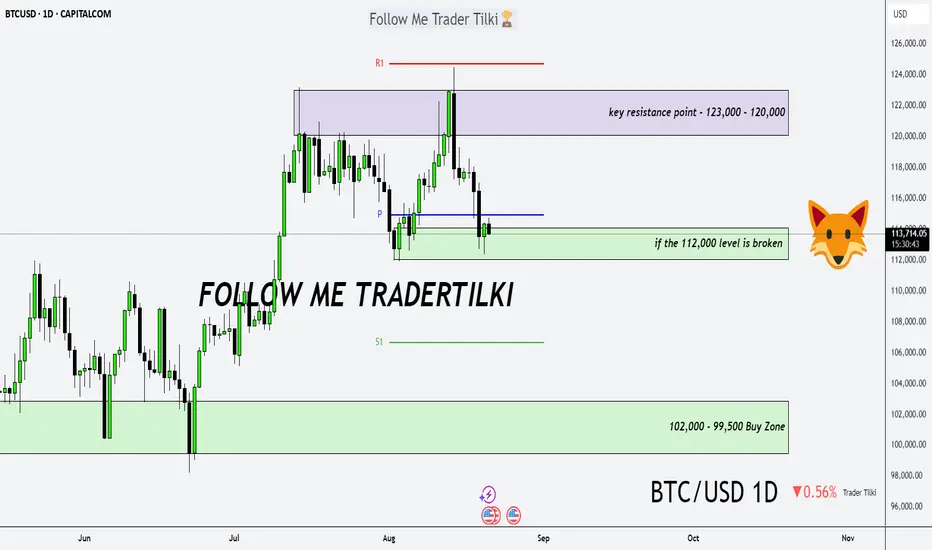
Bitcoin Daily Analysis – The Trend Is Our FriendGood morning, Guys,
I’ve prepared a fresh Bitcoin analysis for you.
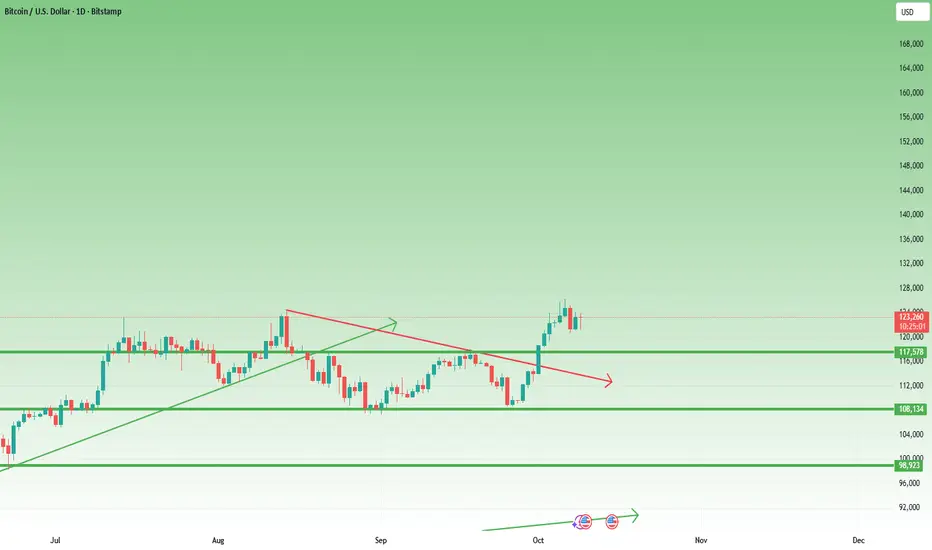
🔹 First off, I stand firmly behind my long-term targets of **127,000 – 137,000 – 146,000**. I previously shared these levels with you in a weekly analysis.
🔍 Now let’s shift to the 1-day chart:
What is Bitcoin telling us right now?
📉 If the **112,000 level breaks downward**, we could enter a correction phase toward **102,000** or even **99,500**. I expect strong buying interest to return from those zones.
📈 After that, we’re facing a key resistance structure between **123,000 – 120,000**.
But I believe this zone will also be broken—because we’re in an **uptrend**, and…
💬 **The trend is our friend. Never forget that.**
ANFIBO | BTCUSD Analysis – Weekly Trading PlanHi guys! It's me, Anfibo. My plan last week gave us a good profit selling from 118,000 USD to 115,000 USD.
And over the past weekend, BITSTAMP:BTCUSD consolidated in a sideways range, consistently holding above key support. However, with the opening of the new week’s Daily candle, the market decisively broke down through this support zone, signaling that selling pressure is now taking clearer control.
From a technical perspective, the next critical support levels to monitor are:
• $113,000
• $111,000
• $109,500
Around the $110,000 region, I view this as a pivotal area to consider initiating spot entries or building larger long-term positions. This zone is not only a technically strong support level but also carries significant psychological weight for institutional and large-scale flows.
Imo, in the short term, BTC may still attempt a retest of the $115,000 level before resuming its downward trend, depending on lower-timeframe reactions. This creates an opportunity for traders to capitalize on corrective moves.
>>> My Trading Plan for the Week:
(1) SELL SCALP:
– ENTRY: around 115,000
– SL: 117,000
– TP1: 113,000
– TP2: 110,000
(2) BUY SETUP:
- ENTRY: 109,000 - 111,000
- SL: 107,000
- TP1: 117,500
- TP2: 122,000
- TP3: 128,000
This strategy is designed for short-term trades, taking advantage of volatility within the current range. For long-term investors, patience will be key—waiting for BTC to approach $110,000 or lower provides a strategic opportunity to restructure portfolios and scale into positions at more favorable prices.
👉 Conclusion: BITSTAMP:BTCUSD has broken out of its weekend consolidation and is now entering a fresh leg down. Short-term traders should look to sell corrective bounces, while long-term investors should focus on accumulation opportunities near $110,000 - a level that could serve as a “strategic entry” for the upcoming cycle.
WISH EVERYONE A NEW WEEK FULL OF ENERGY! ;)

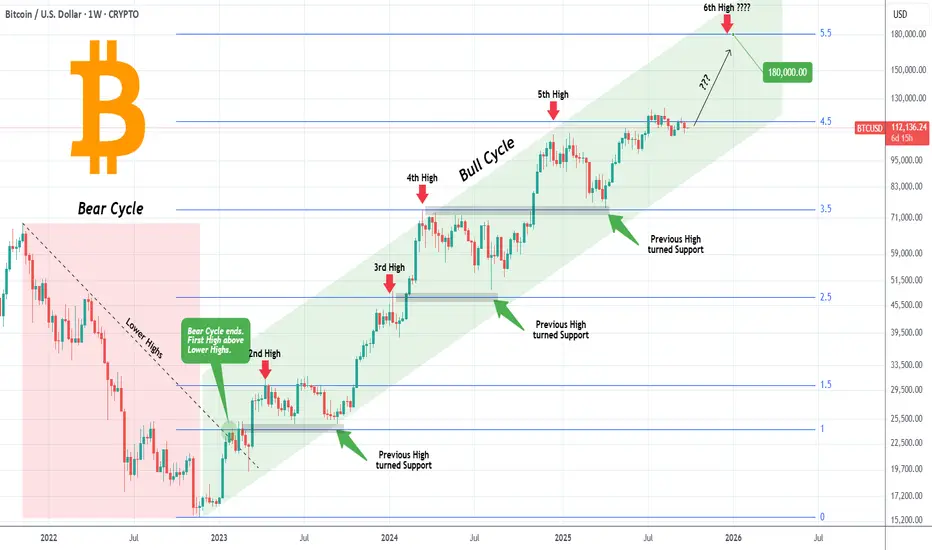
BITCOIN Is there time left for one final run??Bitcoin (BTCUSD) has been trading within a Channel Up pattern through the entirety of its Bull Cycle. The key characteristic of this pattern, which has also helped us at taking profits during each phase in timely manner, has been that every High since the Bear Cycle's Lower Highs trend-line broke, has been on a +0.5 Fibonacci extension interval.
As you can see, starting from Fib 1.5 ext, BTC has fulfilled the pattern by making Highs on the 2.5, 3.5 and 4.5 Fibs so far. What technically remains plausible until the end of the year is the 5.5 Fib ext, which sits at $180k.
With the 4-year Cycle theory suggesting a Cycle Top a little before the end of the year, is it realistic to expect this Target? Do you think there's time for BTC to make one final run like this? Feel free to let us know in the comments section below!
-------------------------------------------------------------------------------
** Please LIKE 👍, FOLLOW ✅, SHARE 🙌 and COMMENT ✍ if you enjoy this idea! Also share your ideas and charts in the comments section below! This is best way to keep it relevant, support us, keep the content here free and allow the idea to reach as many people as possible. **
-------------------------------------------------------------------------------
💸💸💸💸💸💸
👇 👇 👇 👇 👇 👇
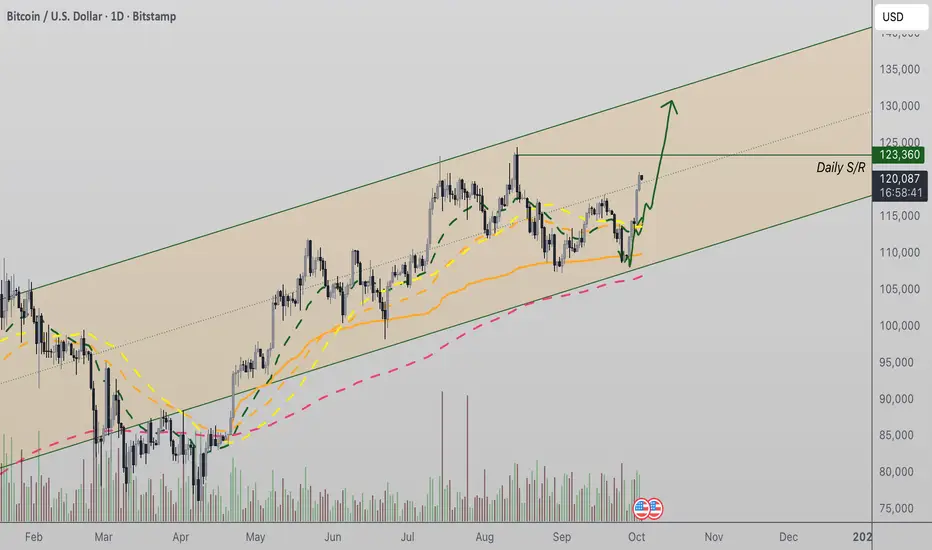
Bitcoin Targets $133,000 as Bulls Defend Channel SupportBitcoin has maintained bullish structure by repeatedly defending channel support, with price now testing midline resistance. A reclaim of $123,360 could unlock the path to $133,000 and new all-time highs.
Bitcoin’s price action continues to respect its structured trading channel, where multiple retests of support have consistently attracted buying pressure. This bullish defense has kept the macro trend intact while setting the stage for a test of higher resistance. With the midline region now being challenged, the next decisive move will determine whether Bitcoin can push toward uncharted territory.
Key Technical Points:
- Channel support has held across multiple retests, confirming bullish structure.
- Price is testing midline resistance of the channel.
- A reclaim of $123,360 could lead to a rally into $133,000, marking a new all-time high.
Bitcoin’s trading channel has become a defining feature of recent price action. Each retest of the lower boundary has produced bullish reactions, demonstrating that long-term holders and fresh buyers continue to defend the structure. This recurring pattern has created confidence in the sustainability of the bullish trend.
At present, Bitcoin is challenging midline resistance, a key area where momentum is often tested. A successful reclaim would provide validation that buyers are in control, opening the probability of price expansion toward the next major level. That level sits at $123,360, and reclaiming it would act as the springboard for a measured rally toward $133,000.
Breaking $133,000 would mark a new all-time high for Bitcoin, further solidifying the channel as a bullish continuation pattern rather than a temporary trading range. Volume inflows will remain critical, as any hesitation near the midline could result in another correction back to support.
Despite these near-term challenges, Bitcoin’s market structure remains intact. Consecutive higher lows have been maintained, confirming the persistence of the bullish trend. As long as channel support continues to hold, the risk of significant downside remains limited.
What to Expect in the Coming Price Action:
Bitcoin’s outlook remains bullish while the channel holds. If midline resistance and $123,360 are reclaimed, the probability of a rally into $133,000 and new all-time highs becomes highly favorable. Consolidation within the channel, however, may persist before the breakout attempt gains traction.
Bitcoin Outlook: Structure Intact, 140K Still on the TableIn my previous BTC analysis, I mentioned that a new all-time high was almost a certainty, with potential for a new leg up toward 140K–150K.
Indeed, BTC delivered — printing a fresh ATH, followed by a short and healthy correction.
At the time of writing, the price has reversed from just above 120K, showing strong demand.
Today’s daily candle displays a long lower tail, a clear sign of buying pressure, and could easily close as a continuation Pin Bar — signaling that bulls are still in control.
Key Zone to Watch
118K support – remains the line in the sand.
As long as this level holds, bulls have no reason for concern and the “buy the dips” strategy stays valid.
Outlook
Momentum remains bullish, structure remains intact, and the path toward 140K stays open — until proven otherwise. 🚀
BTCUSD: Sideways market plan🔁 Review of Yesterday’s Plan
Yesterday, we had two breakout trading plans for BITSTAMP:BTCUSD :
IRB (Inside Range Break)
Price moved exactly as projected.
Trade reached a profit of 2R – 2.5R, depending on individual target exits.
RB/ARB (Range Break / Advance Range Break)
Price reached the top boundary of the range and formed a bullish breakout candle,
but was immediately followed by a strong bearish candle pulling back into the range.
This was a clear False Breakout → No trade was taken, waiting instead for the next clear setup.
📈 Market Outlook for Today
BITSTAMP:BTCUSD has now moved back inside the larger range (125,710 – 122,383), showing that the market is currently sideways within a wide range.
The most recent candle closed below the EMA, indicating no clear signal for continuation trades yet.
🧭 Trading Plan for Today
Wait for a new compression setup to form before entering.
If price consolidates and compresses near the upper boundary of the range, prepare to Buy once confirmation appears.
If price continues to drop toward the lower boundary of the range, consider Sell setups, depending on how price reacts to support.
🎯 Summary:
BTC is currently in an accumulation (sideway) phase.
Be patient and wait for a valid breakout setup before taking action — avoid chasing the market and focus on trading only when momentum and confirmation align.
You can refer to my previous analysis here:
Please like and comment below to support our traders. Your reactions motivate us to do more analysis in the future 🙏✨
Daniel Miller @ ZuperView

BTCUSD: Monday analysis and buy plan within rangeLast week, BITSTAMP:BTCUSD had a strong bullish recovery, setting a new all-time high.
At the moment, the trading plan remains bullish (Buy bias), but risk and position sizing should be managed carefully, as the market may experience short-term corrections after such an extended rally.
🧭 BTC Trading Plan
Small Range within a Larger Range
Price is currently moving inside a smaller range within a larger range.
Wait for price to accumulate momentum and form an IRB (Inside Range Break) signal before setting up a potential Buy entry.
Upper Boundary of the Larger Range
Once price breaks the IRB and approaches the upper boundary of the major range, look for price compression near EMA.
Upon confirmation of an RB/ARB (Range Break / Advance Range Break), execute a Buy market order, aiming for a reward ratio of 2R or higher.
If the Market Deviates from Plan
Stay on the sidelines and wait for clearer signals before re-entering the market.
🎯 Summary:
BTC remains in a bullish structure, but selective entries and disciplined risk control are essential.
Wishing everyone a productive and profitable trading week ahead!
You can refer to my previous analysis here:
Please like and comment below to support our traders. Your reactions motivate us to do more analysis in the future 🙏✨
Daniel Miller @ ZuperView

BTC rejected from key 114,228$ - down to 103,792$ now!Hey, guys
sometimes I wish I could do more regular updates to make you aware of things as they happen, but I don't get the chance to, saw this pump coming but was away from my computer and TV only allows to post on desktop and not mobile, if I am correct.
There's a strong support at 110,600$ but this should be broken to the downside, for price to see lows of 106,607$.
if 106,607$ is broken to downside, which I expect it will, then we will reach final target of 103,792$ for this move - we expect downside to 80k before EOY but, lets take things step by step as it most likely won't be a straight drop to that level.
so yes, we are still very much bearish on BTC.
Everyone will have the chance to dollar cost average on BTC between 30-50k in the long run before the next bull cycle, I will make sure you all achieve this.

BTC eyes on 105.5k: Semi-Major Genesis fib is CRITICAL support Shown here is a single fib series in 3 different timeframes.
The Genesis Sequience has called all major turns since 2015.
We called the recent top at 125,550 by the Genesis Sequence.
Prices are from Coinbase, others will vary a bit.
$ 105,541.85 is the Semi-Major fib just below.
$ 111,661.25 above is a minor ratio and resistance.
$ 96,769.44 would be the sub-100k stop hunt level.
.
Last Analysis that called the EXACT TOP:

BTCUSD: Short term sell setup - Long term buy opportunity ahead
🔁 Review of Yesterday’s Plan
After BITSTAMP:BTCUSD rallied and set a new high at 126,190, the market entered a corrective phase.
In yesterday’s plan, we expected that:
Once the H1 candle closed below EMA, BTC could continue its decline and retest the lower support zone.
After touching support, price might pause briefly, then break lower to continue the downtrend.
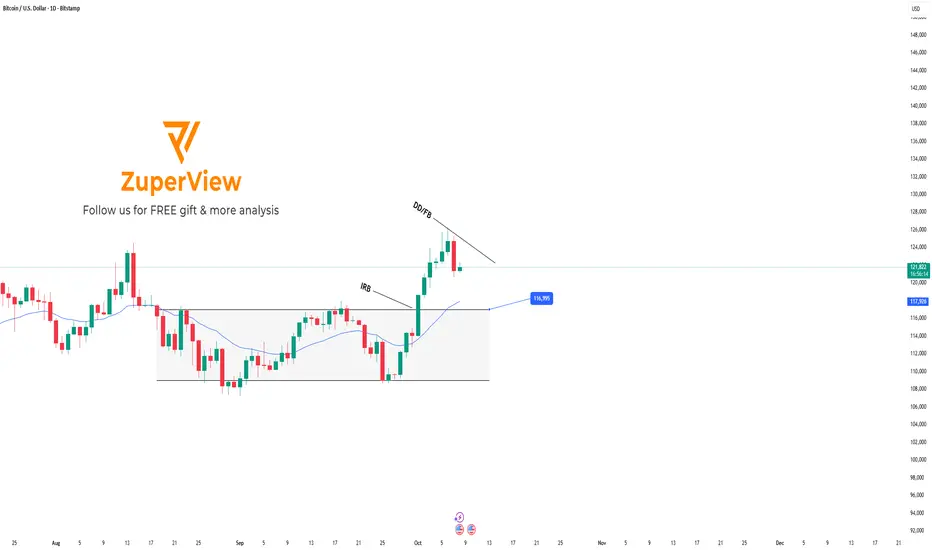
Currently, BITSTAMP:BTCUSD has broken below and is consolidating sideways within a narrow range on H1, aligning perfectly with the anticipated correction scenario.
📈 Trading Plan for Today
On the H1 timeframe
Two key levels to watch for the Sell plan:
Resistance: 123,449
Support: 121,293
Scenario 1:
If price fails to break above EMA and keeps consolidating near 121,238While staying below EMA, → wait for a BB (Break Block) confirmation → Sell following the breakout signal.
Scenario 2:
If price retraces toward EMA and moves up to test 123,471→ wait for bearish confirmation around resistance to Sell from that level.
On the Daily timeframe
After the strong rally, BTC is now undergoing a technical correction.
The plan is to wait for price to pull back to retest the upper boundary of the previous range around 116,995, and Buy from that area.
Alternative setup:
If price reaches EMA sooner without testing the 116,995 zone,→ wait for BTC to accumulate momentum, then look for DD (Double Doji) / FB (First Breakout) pattern confirmation → Buy after signal confirmation.
🎯 Summary:
Short-term (H1): Bearish correction.
Mid-term (Daily): Bullish bias intact, waiting for confirmation near support.
Please like and comment below to support our traders. Your reactions motivate us to do more analysis in the future 🙏✨
Daniel Miller @ ZuperView
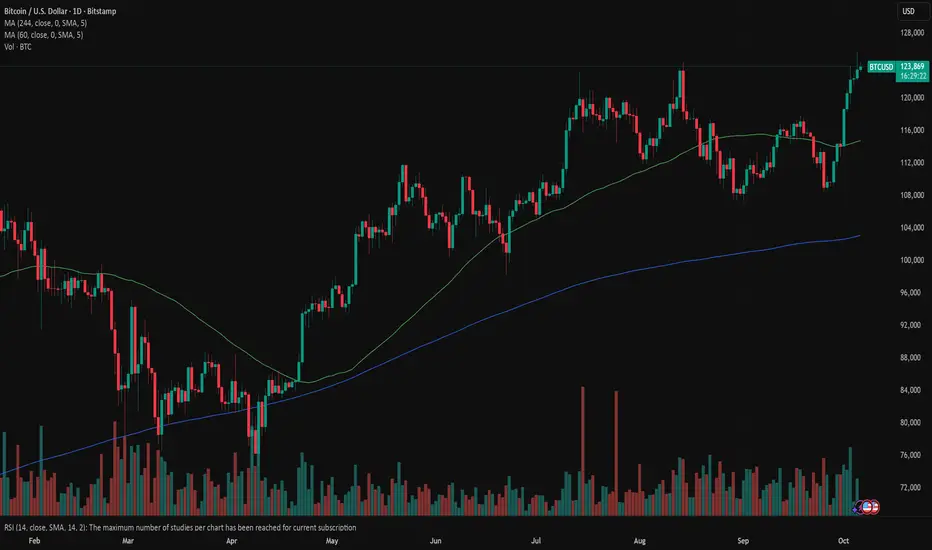
Bitcoin: Shutdown fuels BTC movesBTC had a very good week, where the price of coin returned to its highest levels, above the $122K, modestly touching the new all time highest level at $123.870. At Saturdays trading, the price modestly reverted back to $122K. There are several reasons for such a move during the week. Political and fiscal uncertainty caused by the “shutdown” of the US government on October 1st, prompted some investors to enter into more “safe-haven” alternatives like BTC. On the other hand, weaker private jobs and the government shutdown increased investors expectations that the Fed might cut further interest rates as of the end of October by another 25 basis points, which again supported investments in riskier assets. As per comments from analysts, the latest push of BTC to the upside was supported by a real allocation of funds from investors, where the most of it came from institutional ones, while on-chain data shows fiat funding rates and accumulation by long-term holders, implying the move is backed by real demand rather than excessive leverage.
BTC started the week around the level of $112K, and for the rest of the week was strongly pushed toward the $123K. The RSI modestly touched the level of 70, indicating the potential for a short term reversal in the coming period. Although MA50 previously started its modest path toward the MA200, since last week, it reverted back to the old path, and started diverging again from its counterpart. The cross is certainly not in store for some time in the future.
The combination of fundamentals pushed the price of BTC toward the upside during the previous week. It could be expected that on the same grounds the price of BTC will either hold with a modest reversal, or will be pushed further, depending on further fundamental news. In case that BTC starts to revert, then the next level to watch would be the $118K current support. On the upside, $123K is the level to watch. In case that it is clearly broken toward the upside, then we will have a fresh new ATH for BTC.
118.60-119.50K for BTC BounceMorning folks,
So, the final leg up has happened that we discussed last time, but it was not as strong as we've expected. It means that all time high target around 127K is not done yet.
Meantime, BTC is taking the breath. Since upside momentum looks nice, we consider first support area around 118.6K - 119.50K as potential for long trade. Especially if we get this butterfly pattern.

BTCUSD next move (Expecting a mild correction)(03-10-2025)Go through the analysis carefully, and do trade accordingly.
Anup 'BIAS for BTCUSD (short term)
Current price- 120300
"if Price stay below 122000 then next target is 118300, 116000 and 114000 above that 124000.
-POSSIBILITY-1
Wait (as geopolitical situation are worsening )
-POSSIBILITY-2
Wait (as geopolitical situation are worsening)
Best of luck
Never risk 2% of principal to follow any position.
Support us by liking and sharing the post.

$BTC Trend Continues.Bitcoin is still holding onto its upward trend. The recent move should be seen as a healthy correction within the main uptrend. After being rejected from the supply zone, the price got a strong bounce off the major demand zone, showing that buyers are still in control.
Short-term fluctuations are essentially noise, especially for those not engaging in margin trading. The macro trend remains positive; such pullbacks serve as fuel for the next run.
BTC remains strong, trend up, momentum alive.

Where Is Bitcoin (BTCUSD) Headed After Record Highs?The short-term Elliott Wave analysis for Bitcoin (BTCUSD) indicates a five-wave impulse cycle unfolding from the September 1, 2025 low. Wave 1 reached $117,968, and wave 2 corrected to $108,739. Bitcoin then surged to a new all-time high, advancing in wave 3. Within wave 3, sub-wave ((i)) peaked at $109,995. Sub-wave ((ii)) pulled back to $108,676. The rally progressed, with sub-wave ((iii)) hitting $125,725. Sub-wave ((iv)) found support at $122,355, maintaining the bullish structure.
Sub-wave ((v)) is nearing completion, finalizing wave 3 on a higher degree. Following this, wave 4 should correct the rally from the September 25, 2025 low. The uptrend will likely resume in wave 5. As long as the pivot low at $108,676 from September 25 remains intact, dips should find support in a 3, 7, or 11 swing pattern. This support will facilitate further upside. After wave 4 concludes, traders can project the wave 5 target using the 123.6–161.8% inverse Fibonacci retracement of wave 4. This calculation will provide a precise target for Bitcoin’s next rally. The cryptocurrency’s price action reflects strong bullish momentum, suggesting continued growth in the near term.

Despite ATH, Bitcoin is not looking solidCOINBASE:BTCUSD hit it's all time high above 126000 yesterday and yet, when you look at the structure of #BTCUSD, it doesn't inspire confidence. It looks like a huge rising wedge with bearish implications. And if this structure is going to play out then bitcoin is likely near it's top.

BTCUSD: Weekly reviewThis week, BITSTAMP:BTCUSD recorded a strong rally, moving from 109,900 → 120,800, equivalent to about +10,900 USD (+9.9%).
After last week’s sharp decline, the market clearly reversed into an uptrend as price broke out and held firmly above the EMA.
Today is Friday, and the market may experience strong volatility due to the Non-Farm Employment Change (NFP) report – an event that often has a major impact on price movement and trading strategies during the day.
Key Setups of the Week
1. BITSTAMP:BTCUSD Review – September 29
After a sharp drop, BTC rebounded, broke out of the range, and held above the EMA.
This was an early signal confirming a trend reversal from bearish to bullish.
2. BTC Review – September 30
After breaking out of the larger range and rallying strongly, the plan was to wait for a pullback toward the EMA.
Price formed a diagonal wave and gave confirmation signals through DD (Double Doji) / FB (First Breakout).
The entry was triggered, and the market rallied nicely, hitting the target as expected.
3. BTC Review – October 1
After the rally, BTC retraced and closed below the EMA.
At this point, the short-term trend was unclear → staying out and waiting for more market data to avoid unnecessary risk.
4. BTC Review – October 2
On the following day, price recovered and consolidated right at the upper boundary of the range.
EMA pressed tightly, creating a momentum compression zone and setting up for the next breakout.
The plan was to wait for RB/ARB confirmation, then Buy following the breakout.
This setup worked out successfully, BTC broke out strongly and continued to hit the target.
5. BTC Review – October 3
The main bullish trend continued, showing no signs of weakness.
The plan: wait for a pullback to the EMA, confirm a FB/SB (Second Breakout) signal, then Buy in line with the uptrend.
The scenario played out accurately, delivering another profitable setup.
Conclusion
Trend of the week: Clearly bullish.
Buy setups around EMA and breakout strategies performed effectively, resulting in a consistent winning streak.
Caution for today: With NFP on the schedule, unusual volatility may occur. Traders should manage risk carefully and patiently wait for clear confirmation signals before entering the market.
You can refer to my previous analysis here:
Please like and comment below to support our traders. Your reactions motivate us to do more analysis in the future 🙏✨
Daniel Miller @ ZuperView

todays set ups btc usd here are my trades for today currently in sell position to the 50/60 fib with ifvg and liquidity in the same area then looking for buys to take the all time hight one more time then looking for sells to wipe out some money
