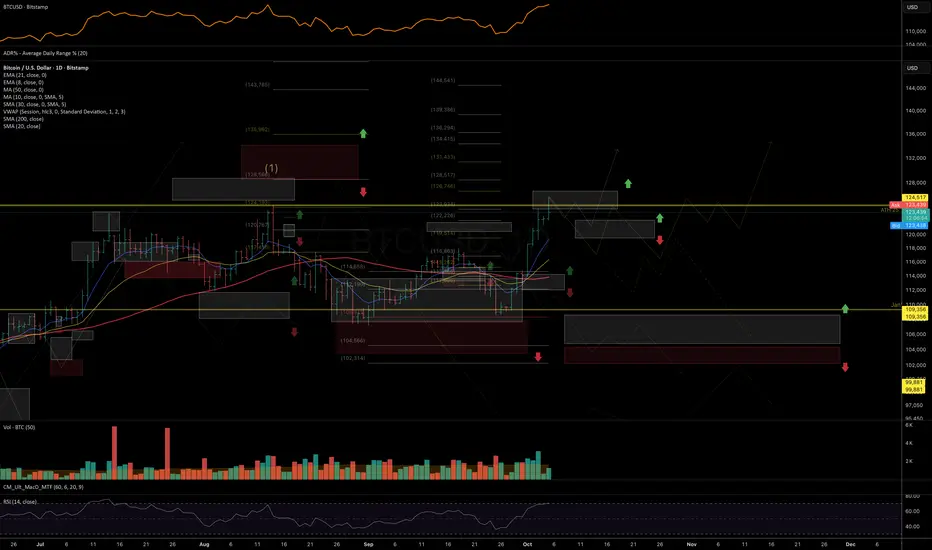
BTC/USD Trade with Support & Resistance | Double Top BTC/USD Daily Chart Analysis | Sell Signal Active
Today’s Bitcoin analysis shows a short position setup after forming a possible Double Top near 124,510 – 126,246 resistance.
The daily candle has confirmed a Bearish Engulfing pattern, signaling potential downside momentum.
🧠 Trading Idea:
Current price action suggests sellers are gaining control. If BTC breaks below 107,658, it could trigger a deeper drop toward 107K and possibly lower in the coming days.
🎯 Key Levels:
Resistance: 124,510 – 126,246
Support: 107,658
Target: 107,658 and below
⚠️ Note: This is a technical analysis for educational purposes — not financial advice. Always manage risk before entering trades.
#BTCUSD #BitcoinAnalysis #CryptoTrading #BearishEngulfing #DoubleTop #BitcoinPricePrediction #BTC #CryptoChart #DayTrading
BTCUSD.PI trade ideas

seeing the market in layers.. "A 3PART SERIES"The Art and Science of Timeframes (Part I): Matching Timeframes to Your Trading Style
Every trader operates within a different rhythm. Some thrive on fast scalps, others on slow swings. The secret is to match your personality to the right timeframe not the other way around.
1. Scalpers (1M–15M)
Term: Short
Characteristics: Lightning-fast execution, exploiting small intraday moves.
Pros: Frequent setups, many profit opportunities.
Cons: High stress, risk of overtrading, spreads and slippage matter.
Best For: Traders who enjoy instant feedback and thrive on volatility.
MTFA Tip: Use 15M for structure, 5M for setup, 1M for entries.
2. Day Traders (15M–1H)
Term: Short to Medium
Characteristics: Combine intraday technicals with small-scale structure.
Pros: Clear daily cycles, lower overnight risk.
Cons: Requires constant attention and discipline.
Best For: Traders with time during active sessions.
MTFA Tip: Use 1H for bias, 15M for setup, 5M for execution.
3. Swing Traders (1H–4H)
Term: Medium
Characteristics: Ride waves lasting several days to weeks.
Pros: Less screen time, cleaner structure.
Cons: Exposure to weekend gaps and news spikes.
Best For: Professionals balancing trading with other commitments.
MTFA Tip: Use Daily for bias, 4H for setup, 1H for execution.
4. Position Traders (Daily–Weekly)
Term: Long
Characteristics: Focus on macro trends and fundamentals.
Pros: Larger reward potential, fewer decisions.
Cons: Patience required; drawdowns can be larger.
Best For: Investors and macro traders.
MTFA Tip: Use Weekly for trend, Daily for confirmation, 4H for entries.
The Takeaway: Timeframes as a Symphony
Think of the market as a piece of music, each timeframe a different instrument. The higher timeframe sets the melody, the mid-timeframe adds rhythm, and the lower timeframe provides texture and precision. When they play in harmony, your trades flow with the market instead of fighting it.
The Art and Science of Timeframes (Part II): The Multi-Timeframe Edge
Every price candle tells a story but no single timeframe tells the whole story. To trade with clarity instead of confusion, you need to see how the market breathes across multiple scales. That’s where Multi-Timeframe Analysis (MTFA) becomes a trader’s most powerful lens.
Most beginners lock themselves into a single chart, maybe a 15-minute or 1-hour and miss the broader context that defines the real opportunity. Professionals, on the other hand, zoom in and out like astronomers switching between telescopes, observing both the vast structure and the fine detail of price action.
Let’s break down the science behind this art.
1. Choose Your Timeframes
The key is to pick two to three timeframes that serve different purposes:
Higher Timeframe (HTF) → defines the trend and macro structure.
Mid Timeframe (MTF) → helps you spot setups and consolidation zones.
Lower Timeframe (LTF) → fine-tunes entries and exits.
Example for a swing trader:
Trend: Daily (D1)
Setup: 4H
Entry: 1H or 15M
Each timeframe acts like a different layer of resolution from the forest down to the individual leaves.
2. Analyze the Higher Timeframe (HTF)
Always begin from the top down. The higher timeframe shows the path of least resistance.
Ask:
Is price trending or ranging?
Where are the key supply/demand or support/resistance zones?
What is the dominant direction of institutional flow?
This framework prevents you from buying into resistance or shorting into demand. Remember: the HTF is the map; the LTF is the magnifying glass.
3. Study the Mid Timeframe (MTF)
This is where traders plan their battlefield. The MTF captures structure, accumulation, and distribution phases.
You might see:
Trend continuation flags
Range breakouts
Retests and confluence zones
It bridges the macro and micro perspectives. When the HTF is bullish, you look for higher-low formations or break-and-retest setups on the MTF to align with the major flow.
4. Drop to the Lower Timeframe (LTF)
The LTF is where precision lives. Here, you look for:
Candlestick confirmations
Liquidity sweeps
Minor structure breaks
But precision means little without context. Always ensure your LTF entries echo the HTF narrative. When the HTF trend and LTF setup agree, your probability improves dramatically.
5. Align All Timeframes
Confluence is your compass. If all your timeframes tell a consistent story, say, higher highs on the D1, bullish structure on the 4H, and breakout retests on the 15M, the trade idea gains strength.
If they conflict, patience is the best position. Misalignment breeds confusion, and confusion costs money.
6. Confirm with Indicators (Optional)
Multi-timeframe analysis is primarily price-action-based, but technical indicators can complement your judgment.
Think of RSI, MACD, or moving averages as secondary confirmation tools not decision-makers.
7. Plan and Execute
With all layers aligned, define your:
Entry
Stop-loss
Take-profit levels
Ensure a risk-reward ratio of at least 1:2, ideally better. Plan your trade on the MTF, execute it on the LTF, and manage it according to the HTF.
Part III : The Multi-Timeframe Breakdown
In the next last section of the publication, I’ll apply this framework to a real market showing how multiple timeframes converge to shape high-probability setups on a live chart. We’ll analyze BTCUSD class step by step from the MONTHLY map to the 4HR trigger.
remember: timeframes don’t just measure time; they reveal structure.
1MONTH CHART :
Starting off on the monthly chart, first highlighted the all time high @ 126296.00 based on the exchange i used and the supply CP represented by the orange horizontal line of proximal price @ 115,697.37 and also significant previous high @ 100,390.00 and also identified liquidity pool represented by rectangle zone ranging from @ 96429.84 to 93354.22..
WEEKLY
weekly i only added a rectangle zone which connects recent supply level and the supply cp and trendline indicating current market still having bullish momentum and daily i had no levels to mark...
4HR
4hr we found support at liquidity pool connecting recent high and low @ 121,115.33 and 121523.68 with possible shorts at 123,796.00 which is supply and also demand cp and also there is fib retracement of 61.9% and 50.0% taken from intraday high 126296.00 and low 120,636.00 with price currently reacting to the 38.2% which can cause price to drop without having to go to the supply level...
another alternative the support can hold and cause price to rise to the all time high and maybe create a new ath as shown below..
There are reasons to support both upside and downside for Bitcoin currently. What matters is weighting the signals (technical + on-chain + macro) and letting price confirm. Below I’ll lay out bullish evidence, bearish risks, and how a trader might synthesize these into a balanced view.
Bullish Evidence (Reasons Bitcoin might rise)
Record ETF and institutional inflows
Bitcoin and crypto ETFs recently attracted $5.95 billion in a week, with a large share into Bitcoin.
The rally is being underpinned by institutional demand rather than pure speculative retail flow.
Reuters
Deepening institutional participation tends to anchor support and reduce volatility (if sustained).
New all-time highs & momentum breakout
Bitcoin has pushed to new highs (above ~ USD 125,000) in recent trading days.
Price breaking past a resistance level often triggers fresh buying (breakout momentum).
Analysts see the market in a “decisive phase” after breaking above prior peaks.
Macro tailwinds / safe-haven rotation
As the U.S. dollar shows signs of pressure and economic uncertainty looms (e.g. U.S. government shutdown), investors are leaning into safe-haven / non-correlated assets like gold and Bitcoin.
Bitcoin’s narrative as “digital gold” gains more weight in such contexts.
Messaging from major banks (e.g. Deutsche Bank) that Bitcoin is approaching reserve-asset status adds psychological weight.
Barron's
Technical structure — retest and consolidation
Even though price has surged, many analysts suggest that after the breakout, Bitcoin might pause or retrace slightly (to ~ USD 118k) before continuing upward.
That kind of “breakout → retest → continuation” structure is common in strong trends.
Also, technicals show that if support levels hold, there is room for extension.
Maturing volatility trend / more stable regime
Over time, Bitcoin’s volatility (on a yearly scale) has shown a decreasing trend, which suggests the market may be maturing.
Fidelity Digital Assets
A somewhat calmer environment can attract more risk capital and reduce fear of large intraday drawdowns.
Bearish Risks / Evidence to Watch (Reasons Bitcoin might drop or pull back)
Overbought conditions / exhaustion
After such a rapid rally, markets often pause or correct. Momentum traders may already be booking profits.
Some crypto news sources refer to a loss of momentum or a slide after the recent highs.
Leverage, liquidations, and risk unwinds
Crypto markets are still sensitive to leveraged positions. A sharp reversal could trigger cascades of liquidations.
In prior sessions, large liquidations contributed to dips.
Macroeconomic policy / central bank moves
If central banks (especially the U.S. Fed) surprise markets with hawkish tone, less rate cuts, or quantitative tightening, that could strengthen the dollar and put downward pressure on crypto.
Uncertainty in fiscal policy (e.g. government shutdown) could cut toward risk-off flows.
Support breakdown / structural failure
If Bitcoin fails to hold key support zones (for instance, if the retest fails, or prior swing support is broken), it might reverse more aggressively.
Analysts warn of consolidation or retracement if momentum stalls.
Regulation / policy risk
Though not as immediate lately, regulatory shifts especially in major jurisdictions (U.S., EU, China) can swing sentiment violently.
Balanced View: What the Evidence Suggests Right Now
Given all this, one can’t confidently predict either direction with certainty but we can lean. Here’s how a well-calibrated, probability-based view might look:
Primary base case (moderately bullish): Bitcoin continues upward, but with intermittent pullbacks or consolidation phases. The recent breakout is validated by institutional flows, and the macro weather is somewhat favorable. If the retest (e.g. ~ USD 118k) holds, it could become a launchpad to new highs.
Alternate bear scenario (guarded): If the retest fails and support breaks, or macro sentiment shifts hawkish, we could see a deeper correction possibly toward older support zones.
Invalidation / risk threshold: A break and close below major structural support (on a daily / weekly chart) would weaken the bullish thesis. That becomes a warning zone.
put together by : Pako Phutietsile as @currencynerd

BTCUSD 30M – Pullback Setup Loading BITSTAMP:BTCUSD
Bitcoin showing retracement signs after rejection from 126K zone — liquidity resting below 123K 👇
If it taps back into 122.8K–123K range, bulls could reload for next impulse 💪
✅ Upside Targets: 125.8K / 126.5K / 128K
❌ Invalidation: Below 122.5K
📊 Trendline structure still strong — this could be the last dip before continuation!

Bitcoin Technical Analysis – Bearish Butterfly Nears Completion As mentioned in my previous forecast, Bitcoin is consolidating near $125,200 after a strong breakout from $118,000, maintaining a bullish trend within an ascending channel. The Bearish Butterfly harmonic pattern is nearing its Potential Reversal Zone (PRZ) between $128K–$130K. The RSI near 70 suggests mild overbought conditions, while price action above the 50- and 100-SMA confirms trend strength.
If BTC holds above $124,600, another push toward $130K is likely before facing resistance. However, a break below $121,100 could retest $118,500. The structure remains bullish overall — with the next potential expansion phase targeting $160,000 in the months ahead.

BTC: a necessary up confirmation !BTC:
.
A necessary up confirmation !
Weekly Engulfing Candle Pattern to confirm big smart money.
A shakeout maybe/ maybe not for a continuously uptrend confirm.
.
US STOCKS- WALL STREET DREAM- LET'S THE MARKET SPEAK

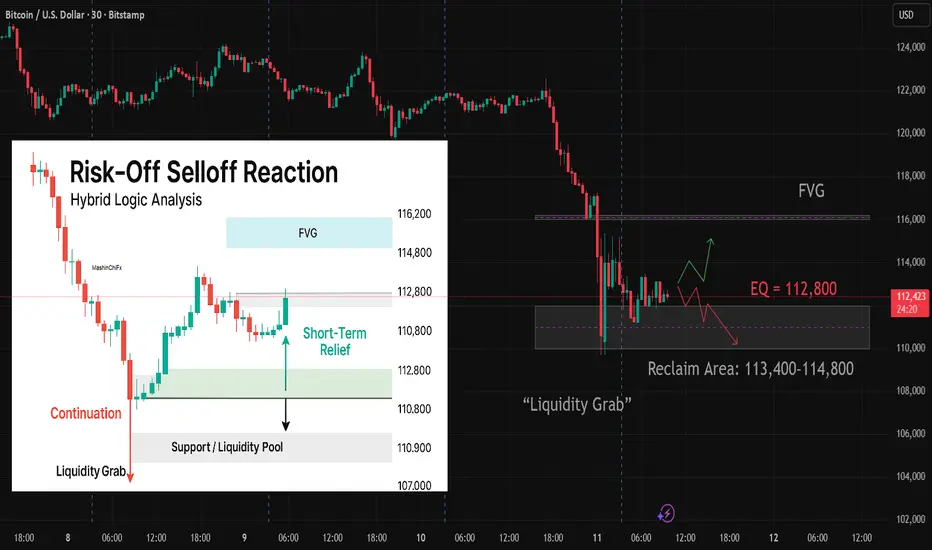
BTCUSD – Risk-Off Selloff Reaction | Hybrid Logic AnalysisMarket Overview :
BTCUSD extended its decline after Trump’s new China tariffs and Wall Street’s sharp drop. The market is in a risk-off mode, consolidating near 112k with bearish bias. Liquidity sits below 110.8k while 113–115k acts as a potential reclaim zone.
Key Levels:
Resistance: 113.4k–114.8k
EQ: 112.8k
Support: 110.8k–109.9k
Scenarios:
A: If 110.8k breaks → continuation toward 108.5k.
B: If 112.8k reclaims → corrective move to 114.5k.
Tags:
#BTCUSD #RiskOff #PriceAction #Liquidity #HybridTrading #Sweep #Reclaim #TechnicalAnalysis #TradingView #MarketStructure
@MashinChiFx
BTC SHORT 📊 BTC Short Setup Plan
Sell Limit: $121,429.4
Stop Loss (SL): $125,316.9
Take Profit 1 (TP1): $117,461.7
✅ Take partials
🔁 Move SL to Entry once TP1 is hit
Take Profit 2 (TP2): $113,266.7
🧠 Technical Confluence
1. Commitment of Traders (COT) Data
Commercial positions are at extreme sell levels for Bitcoin, indicating large institutional players are heavily positioned short.
2. Structural Liquidity Sweep
Price has already swept structural liquidity, clearing out stops above prior highs.
This often marks the end of a liquidity grab and the start of a larger reversal move.
3. High-Level Order Block With Imbalances
The order block near $121,429 also contains multiple imbalance zones (FVGs).
These imbalances suggest that price is likely to retrace into this block to rebalance order flow before continuing lower.
Once price taps this zone, heavy sell orders are expected to react, pushing BTC downward.

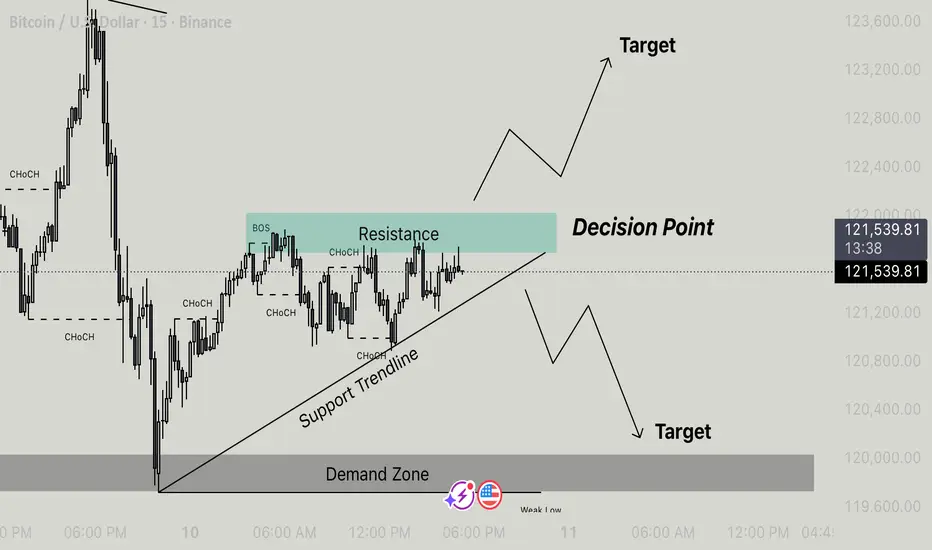
Btcusd - At A Critical Decision Point Bitcoin is currently trading around $121,575, consolidating near a key decision point where price action meets both resistance and the ascending support trendline.
Key Technical Zones
• Resistance Zone: 121,400 – 121,800
This area has acted as a rejection zone multiple times, forming the current decision point.
• Support Trendline: Connecting higher lows, showing bullish structure short-term.
• Demand Zone: 119,600 – 120,200
A strong reaction zone where price previously reversed — potential target if price breaks down.
Market Structure
• Multiple CHoCH (Change of Character) signals indicate short-term range-bound behavior.
• BOS (Break of Structure) confirms local bullish momentum but price is nearing resistance.
• Decision Point: Market could break either way soon, watch for confirmation.
Scenarios
Bullish:
• Break and close above resistance with retest → potential rally toward 122,800 – 123,200 target zone.
Bearish:
• Rejection from resistance or break below support trendline → possible drop toward Demand Zone (120,000 area).
Summary
Price is at a critical juncture — watch closely for breakout or rejection signals around 121,600. Traders should wait for confirmation before entering positions.
BTC Weekly CycleWanted to share this chart on the weekly on BTC, this could be the next possible move in the next few months.

BTCUSD NEXT POSSIBLE MOVE Bitcoin is consolidating near a strong support area where buyers are gradually stepping in. If the price continues to respect this zone, a bullish breakout can be expected.
Market structure remains positive above support, indicating that buyers may soon regain control.

BITCOIN IDEA
Bitcoin is still stuck in a sideways range.
KEY level bullish is at 122,300, and right now price isfilling orders near 121,183 daily cap.
That means we’re kind of in the middle — not super strong, not super weak.
The daily trend is still up, but price is pulling back a bit to fill orders.
If Bitcoin starts dropping, 118,543 is the next big level to watch.
If it holds and bounces, we might see another push higher.
If it breaks, we could fall deeper into that lower area.
The U.S. dollar is strong this week → makes it harder for BTC to move up.
Jack Dorsey (the Twitter guy) just dropped a new Bitcoin wallet — cool for long-term use.
So for now: stay patient, watch 121K and 118K zones, and don’t chase candles.

Bearish momentum building?The Bitcoin (BTC/USD) has rejected off the pivot and could drop to the 1st support that aligns with the 38.2% Fibonacci retracement.
Pivot: 124,139.15
1st Support: 119,294.96
1st Resistance: 126,282.29
Disclaimer:
The above opinions given constitute general market commentary, and do not constitute the opinion or advice of IC Markets or any form of personal or investment advice.
Any opinions, news, research, analyses, prices, other information, or links to third-party sites contained on this website are provided on an "as-is" basis, are intended only to be informative, is not an advice nor a recommendation, nor research, or a record of our trading prices, or an offer of, or solicitation for a transaction in any financial instrument and thus should not be treated as such. The information provided does not involve any specific investment objectives, financial situation and needs of any specific person who may receive it. Please be aware, that past performance is not a reliable indicator of future performance and/or results. Past Performance or Forward-looking scenarios based upon the reasonable beliefs of the third-party provider are not a guarantee of future performance. Actual results may differ materially from those anticipated in forward-looking or past performance statements. IC Markets makes no representation or warranty and assumes no liability as to the accuracy or completeness of the information provided, nor any loss arising from any investment based on a recommendation, forecast or any information supplied by any third-party.

Double Bottoms and Double Tops Providing some education about market shifting shapes alongside live market conditions
Also, I am being taught by the AI mentor whilst is works with the live markets

BITCOIN 4HRBITCOIN(H4): Bearish FVG just formed on H4
FVG (Fair Value Gap) on H4 signals strong selling imbalance—smart money drove price down so quickly, it left an empty gap.
ICT teaches this gap often acts as resistance: price may retrace into the FVG, then reject lower.
Watch for price to revisit and respect this level before potential continuation down. #ICTreferences #MarketImbalance #PriceActionBearish
The bearish momentum that created the FVG, does seem to lack strength behind it.. The Principle stands though..

Strong Dollar Cools Crypto Market RallyBitcoin Pulls Back After New Highs: Strong Dollar Cools Crypto Market Rally
By Ion Jauregui – Analyst at ActivTrades
Bitcoin (BTCUSD) retreated to $121,000 on Wednesday after reaching a new all-time high of $126,186 earlier this week. Profit-taking and the recent strength of the U.S. dollar have temporarily slowed the bullish momentum that has dominated the market in recent weeks.
From a macroeconomic perspective, the correction comes amid fiscal uncertainty in the United States, where the government shutdown has entered its second week. This situation has reinforced demand for traditional safe-haven assets such as the U.S. dollar and Treasury bonds, whose yields remain elevated. The U.S. Dollar Index (DXY) climbed to a three-week high, reducing the appeal of cryptocurrencies compared with dollar liquidity.
Bitcoin’s recent rally was driven by sustained inflows into Bitcoin ETFs, expanding institutional participation in the asset, and by speculative positioning linked to so-called “devaluation trades”, where investors bet on the depreciation of fiat currencies against scarce assets. However, the dollar’s recovery and caution ahead of the Federal Reserve minutes have temporarily cooled that optimism.
BTCUSD Analysis:
On the technical front, Bitcoin faces strong resistance near its highs around $126,245, an area showing a clear exhaustion pattern accompanied by lower volume. The immediate support lies at $121,000, followed by $117,997, and the key Point of Control (POC) zone around $108,296, from where the latest bullish leg began. The daily RSI has eased from overbought levels to 61.63%, suggesting a healthy consolidation phase within a structure that remains bullish in the medium term. The MACD continues to indicate upward momentum, and the moving average crossover that began on October 2 appears to be expanding, with the current price well above the 50-day average, which aligns with the $117,970 support area. A break below these levels could open the door to declines toward $117,800–$115,000, while a sustained move above $123,500 may trigger new breakout attempts toward $128,000–$130,000.
Crypto Ecosystem Follows the Pullback
Across the sector, crypto-related equities mirrored the retreat: MicroStrategy (MSTR) dropped 8.7%, Coinbase (COIN) fell 2.7%, Riot Platforms (RIOT) slipped 0.4%, and Marathon Digital (MARA) lost 1.5%. Among major altcoins, Ethereum declined 4.6%, Solana 4.5%, and Cardano 5%, reflecting a broader risk-off sentiment across digital markets.
In summary, Bitcoin is undergoing a technical correction within a volatile macroeconomic environment, where the dollar’s performance and the Federal Reserve’s guidance are likely to dictate the direction of the next major move.
*******************************************************************************************
The information provided does not constitute investment research. The material has not been prepared in accordance with the legal requirements designed to promote the independence of investment research and such should be considered a marketing communication.
All information has been prepared by ActivTrades ("AT"). The information does not contain a record of AT's prices, or an offer of or solicitation for a transaction in any financial instrument. No representation or warranty is given as to the accuracy or completeness of this information.
Any material provided does not have regard to the specific investment objective and financial situation of any person who may receive it. Past performance and forecasting are not a synonym of a reliable indicator of future performance. AT provides an execution-only service. Consequently, any person acting on the information provided does so at their own risk. Political risk is unpredictable. Central bank actions can vary. Platform tools do not guarantee success.

WHATS UP WITH BITCOIN?
✅BITCOIN went up by almost 16.5% in under 11 days and established a new All-Time-High. An absolutely incredible run, so no wonder we are now seeing a bearish correction.
The take profit wave and the local opportunistic selling pressure might take the price back down to around 118,000$ demand area. This is where we can start buying from again as I am sure a new ATH will be established soon!
LONG🚀
✅Like and subscribe to never miss a new idea!✅

BTC Monthly RSI - where is the cycle top?I drew these RSI trendlines on the monthly chart.
I compared where we are now (~RSI 72) to where RSI might top if it follows this trendline (~85). Then I looked at BTC price action from the same RSI levels in past cycles... This is interesting!
In 2017, BTC rallied about 2000% from today’s RSI (72) value to the cycle top.
In 2021, it was around 411%.
If this pattern rhymes again, even a small 74% rally from now could mean a 200k BTC price. (180k is a 55% rally from now.)
This doesn’t guarantee anything—future price action is unpredictable—but it could be a indicator about where we’re heading... No one knows if the top will be 150k, 200k, or 250k, of course!

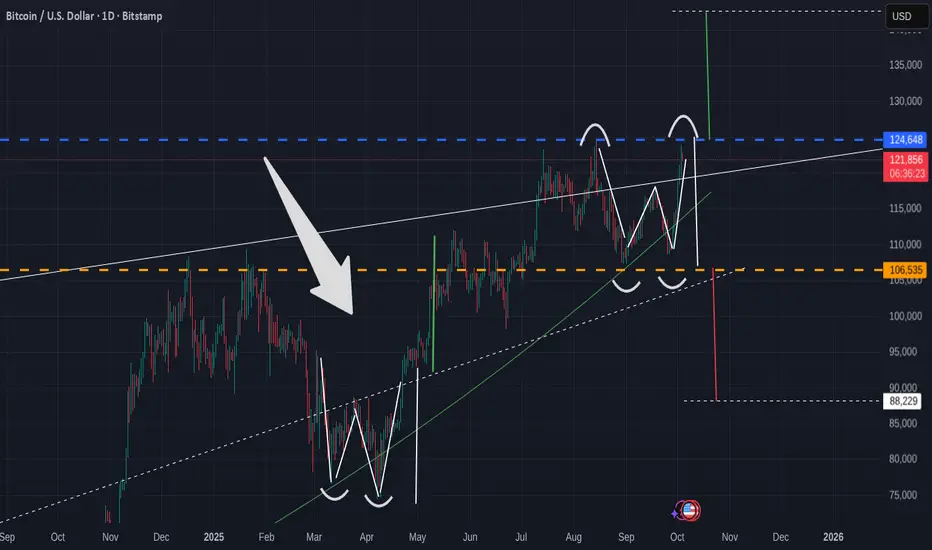
A VERY Bullish sign for Bitcoin but with a possible Warning
A Very simple Bitcoin Daily chart
Obviously, the eye is drwan to the Arrow pointing towards March / April 2025 when Bitcoin PA printed a W patter, or a double bottom.
The Vertical lines show the measured move higher that was executed perfectly.
The question we have right now is, have we just printed another W pattern, with a Measured Move higher to 142K usd
Or Have we just printed a Double TOP with a measured move LOWER to around 88K usd
4 days ago I posted the Monthly Charts and mentioned that we may start October with a Drop, that may last till around 12 - 15 October.
Untill this measured move plays out, I stand by this But I am obviously also open to this not happening.
What ever happens, I have learnt over the years to be ready for BOTH sides of the coin.
I DO have a BUY SPOT order placed for Bitcoin at 92K
IF we get down there,,IF,,,,,It may well be thelast time we get the chance to Buy Bitcoin under 100K
Time will tell
BTC SHORT FORECAST 96K TargetIm expecting some coling in price to a 96k discount per coin guarantee you this guy going to rebound from one of the targets but 96k is my best bet
im the master of forecasting the coin remebr that
like comment follow
Bitcoin to $134kAccording to the broadening wedge (blue lines) from the bottom of that , we get a target to 134k for bitcoin

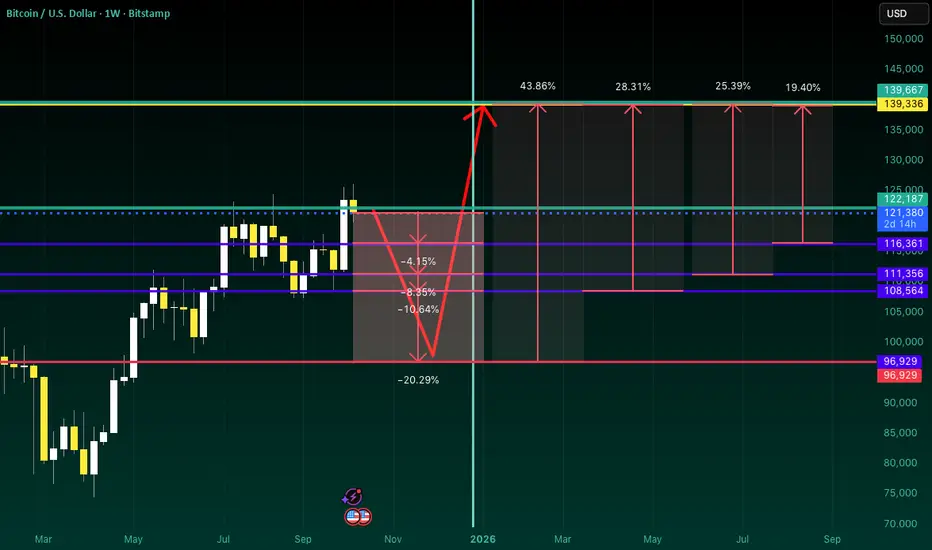
Weekly Crypto Market Outlook: Trend Structures and Expectations The market continues to follow a macro-pattern similar to the previous bull cycles that unfolded in Q4 of 2013, 2017, 2020, and 2021. I discussed this structure in detail in my August 18 update:
Specifically: a summer rally, several weeks of September correction and consolidation, followed by the beginning of a new upside leg in early October.
Updated BTC chart:
Another key development is the stablecoin market capitalization approaching a major technical zone. A confirmed breakout above it could signal a strong liquidity rotation into crypto assets — potentially marking the start of a new wave of growth across the crypto space, similar to the dynamics seen in 2023 and 2024.
Inverse correlation of BTC and stablecoin market cap:
Perhaps the most compelling factor is Bitcoin’s relationship with gold. Despite massive institutional adoption through ETFs, the BTC/GOLD ratio has remained stagnant since early 2021. This suggests that Bitcoin remains significantly undervalued relative to gold, leaving substantial room for appreciation as the digital asset continues its mainstream integration.
BTC/GOLD chart:
These factors — combined with the fact that most altcoins have already broken above their local resistance zones mentioned in the previous review — point to a potential recovery of upside momentum across the crypto market and higher targets into Q4.
As long as prices hold above their local and mid-term support zones, I expect continuation of the rally toward the next resistance levels. Breaking these support zones, will push odds in favor of more prolonged consolidation. But as long as BTC is not closing bellow its 50DMA for more than two weeks, macro bull cycles remains intact.
Below are the key technical levels for the main assets this week:
BITSTAMP:BTCUSD
Chart:
Short-term support: 122–119.5K
Mid-term support: 117–115K
Resistance: 131–135K
BITSTAMP:ETHUSD
Chart:
Support: 4400–4375
Resistance: 4870–5070
BINANCE:BNBUSD
Chart:
Support: 1142–1089
Resistance: 1225–1275
BINANCE:XRPUSDT
Chart:
Support: 2.92–2.88
Resistance: 3.20–3.35
CRYPTO:HYPEHUSD
Chart:
Support: 48.5–47.35–46
Resistance: 55.5–60
BINANCE:SOLUSDT
Chart:
Short-term support: 223–219
Mid-term support: 212–207
Resistance: 247–260
Thank you for reading - wishing you a great Sunday and a strong start to the new trading week.
BTCUSD 4H | Precision Long at High-Probability SupportThe 122,250 level is not just a number; it's a technically significant zone that has been respected multiple times. Price is once again probing this liquidity pool. We are looking for a precise, high-conviction entry on a bullish rejection candle (e.g., Bullish Engulfing, Hammer) at this level, signaling buyer commitment.
The Trigger: A confirmed bullish reversal pattern on the 4H chart at 122,250-122,280.
The Narrative: This is a mean-reversion play within the larger range, targeting the other side where liquidity rests.
Execution:
Entry: On the close of the bullish reversal candle.
Stop Loss: 122,100 (allowing minimal room for a stop hunt below the key level).
Target 1: 122,550 (Range High)
Target 2: 122,800 (Breakout Confirmation Level)

BTC pending for long to $140001. Accumulate Area is done prepared, waiting for break higher
2. Retracing may happen due to RSI reaching peak
3. Waiting the price bounce up at Channel Support line before decided to long
4. Long to $14000
