Long trade
4Ht TF
📘 Trade Journal Entry
Pair: BTCUSDC.P (Bitcoin Perpetual Mix Contract)
Direction: Buyside Trade
Date: Sat, 18th Oct 2025
Time: 8.00 AM
Session: London to New York Session AM
Timeframe: 4-Hour
🔹 Trade Details
Entry: 107,571.0
Profit Target: 111,494.0 (+7.22%)
Stop Level: 106,095.5 (–0.88%)
Risk-Reward Ratio (RR): 8.4
🔹 Technical Context
Price rebounded from the Fibonacci 0.75 retracement zone, forming a clean swing low around 107,044 before reversal.
Kaufman Adaptive Moving Average (KAMA) starting to turn upward — confirmation of shifting short-term bias.
RSI is recovering strongly from oversold territory (~30) and now trading above 61, supporting bullish momentum.
Structure shift after consecutive higher-lows — potential CHOCH confirmation and accumulation phase breakout.
The previous range deviation and liquidity sweep below the 0.75 fib provide a solid accumulation context.
1Hr Timeframe (Discount range observed)
🔹 Narrative
This buyside setup forms after extended downside liquidity collection beneath the major swing low. The market structure indicates accumulation and early-stage reversal, supported by RSI divergence and EMA/KAMA realignment. A continuation toward the 111–112K zone remains the primary trajectory unless rejection occurs near 109.8K resistance.
Trade ideas

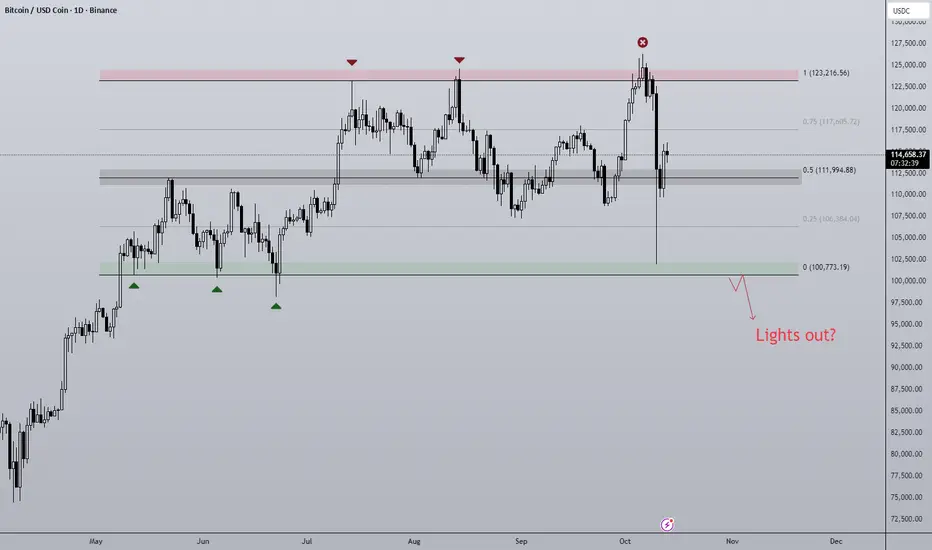
Post Flash-Crash BTC Despite such a large sell-off event, has the outlook on BTC actually changed? Structurally BTC remains very much rangebound with two clearly definable halves of the range. That is until Fridays move off the back of a Tariff Tweet from President Trump causing a liquidation event similar to that of April earlier this year and the Covid crash of 2020.
Bitcoin was less effected when compared to altcoins as is usually the case, some majors dropping as much as 80% in a single 1h candle! An entire bear market in an afternoon. Bitcoin on most exchanges fell roughly 20% on the news and eventually found support at range lows ($100,000), a significant amount of this drop got bought up and so BTC finds itself hovering around range midpoint.
To me this is a no trade zone initially, there is no clear directional bias that is actionable at this time but I am looking for clues as to where price may be going next:
- Should BTC stay above midpoint the next clear resistance level is 0.75 ($117,605). On the lower time frames the trend is bearish, 0.75 would be a good place for the bears to defend.
- A loss of the midpoint would open the door to backfilling the wick, this could get ugly as on the higher time frames a new lower low and price acceptance lower would signal a bearish shift in structure. Calls for "the top is in" will get much louder and so will the 4 year cycle theory comparisons.
- A V-shaped recovery and move straight to the highs would be max pain after such a brutal move down. Although IMO it's the least likely I would not rule it out.
Is the Bitcoin market bearish?📊 Bitcoin Market Psychology Analysis
Market psychology analysis is one of the most fascinating and practical approaches to understanding Bitcoin's current position! 🎯
🎭 Market Psychology Cycle Phases:
1. Hope Phase 🟦
Likely the current point for many assets
· 📈 Description: After a panic-driven crash, the market stabilizes and consolidates within a relatively stable range
· 💰 Price hasn't returned to previous lows and shows occasional small positive breakouts
· 😌 Sentiment: Fatigue from the downturn, but quiet hope for gradual improvement
· 👴 Experienced investors accumulate while newcomers remain cautious
· 📊 Indicator: Moderate trading volume typically
2. Optimism & Belief Phase 🟩
· 🚀 Description: Price begins breaking key resistance levels
· 📰 Media gradually starts paying attention again
· 😨 Sentiment: FOMO (Fear Of Missing Out) among experienced investors
· 😞 Regret over selling at the bottom
· 📈 Indicator: Beginning of increasing trading volume
3. Greed & Euphoria Phase 🟨
· 📈 Description: Full-blown bullish phase - price rises consistently and rapidly
· 🗞️ Positive news dominates everywhere
· 👥 Friends and acquaintances talk about massive profits
· 💭 Sentiment: Belief that "this time it's different" and "price only goes up"
· 💸 Greed for more profits and borrowing to buy
· 📊 Indicator: Very high trading volume and positive media coverage
4. Denial Phase 🟧 - Danger Point!
· 📉 Description: Price falls from the peak
· 🤦 Many investors consider this just a "temporary correction"
· 🔮 Expect a return to the peak
· ❌ Sentiment: Strong denial
· 🛒 Buying during the decline hoping for recovery
· 📊 Indicator: Trading volume remains high
5. Fear, Panic & Capitulation Phase 🟥
· 🚨 Description: Sharp and rapid decline
· 📉 Price experiences consecutive breakdowns
· 😱 Sentiment: Intense fear, panic selling
· 💔 Acceptance of heavy losses - absolute despair
· 📊 Indicator: Very high selling volume
6. Apathy & Depression Phase ⬜
· 😴 Description: Market remains stagnant with low volatility for extended periods
· 💤 Prices are low and boring
· 🚫 Sentiment: Complete disinterest in the market
· 👋 Most people have accepted defeat and exited the market
· ☠️ Talk of "Bitcoin's death" resurfaces
· 📊 Indicator: Very low trading volume and minimal media attention
---
💡 Golden Insight:
Understanding these phases can help you make the best trading decisions! ✨
---
📌 Market Psychology + Technical Analysis = Trading Success 🚀
---
💬 Let's Interact!
I'd love to hear your thoughts! 👇
· 🤔 Which phase do you think we're currently in?
· 📊 What's your market outlook for the coming months?
· 💭 Share your technical analysis perspective
· 🎯 Have you used market psychology in your trading strategy?
· 📉 What indicators do you find most reliable?
· 💡 Any successful trades based on market sentiment?
· 🔮 Where do you see Bitcoin in the next 6 months?
Let's learn from each other! Share your comments and analysis below 👇
Your experience and insights are valuable - let's build our trading knowledge together! 🌟
Feel free to ask any questions or share your trading experiences! 💪

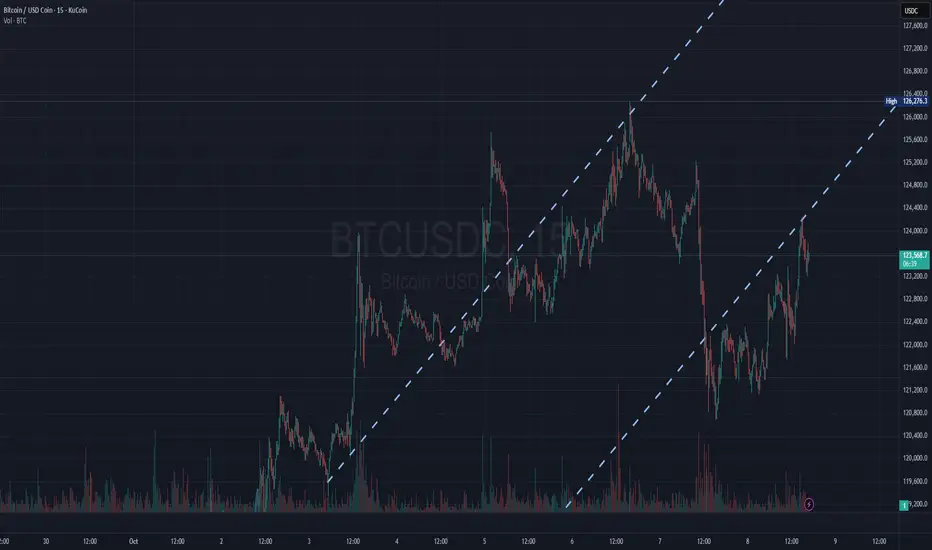
We are looking to go higher stillBitcoin is climbing a clean rising channel 📈 — higher highs and higher lows forming a short-term bullish structure. Watch for a breakout above 126K or a breakdown below 122K to confirm the next move. #BTC #CryptoTrading #TrendChannel
Breakdown:
The lower dashed line marks support, where buyers have repeatedly stepped in.
The upper dashed line marks resistance, where the price has pulled back each time it reached that boundary.
The volume shows spikes on upward moves, confirming buying interest within this range.
If BTC holds above the mid-channel zone (~123K–124K), it is likely to continue toward the upper boundary (~126K).
A close below the lower line (~121K) would signal potential short-term weakness and channel breakdown.
Long trade
Trade Journal Entry
Pair/Asset: BTCUSDC (Bitcoin / USDC, Perp)
Trade Type: Buyside trade
Date: Monday, 29th Sept 2025
Session: Tokyo Session AM (4:00 AM)
Trade Details
Entry: 112,051.5
Profit Level (TP): 115,828.0 (+3.41%)
Stop Level (SL): 111,561.0 (-0.97%)
Risk–Reward (RR): 8.42
Technical Narrative
Structure & Context:
BTC was in a clear downtrend but found demand at ~111,000–112,000.
A consolidation phase formed before a sharp, impulsive move upward (accumulation confirmed).
Multiple FVGs (fair value gaps) printed on the way up, acting as support levels.
Entry Justification:
Long taken on breakout above consolidation and demand validation.
Entry at 112,051.5, just above liquidity sweep low.
Confluence: bullish displacement + FVG alignment + demand retest.
Target Rationale:
TP aimed at 115,828, near the previous structural high / liquidity pocket.
Price path shows strong imbalance magnets above (113.2K → 115.7K)
Scaling partials around 114.6K–115.0K is recommended before final TP.
Risk Management:
SL set at 111,561, just under the structural low, keeping tight invalidation.


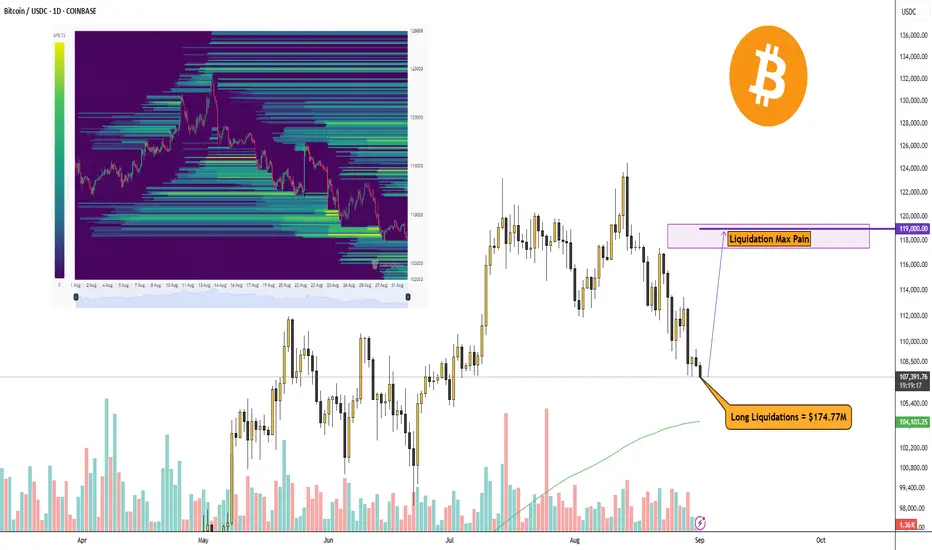
Bitcoin up or down?Bitcoin has corrected a bit more, and it looks like the main liquidations of long traders are done.
Right now, there’s a huge volume of Liquidation Max Pain at the $119,000 level, give or take. It’s the perfect time to buy Bitcoin.
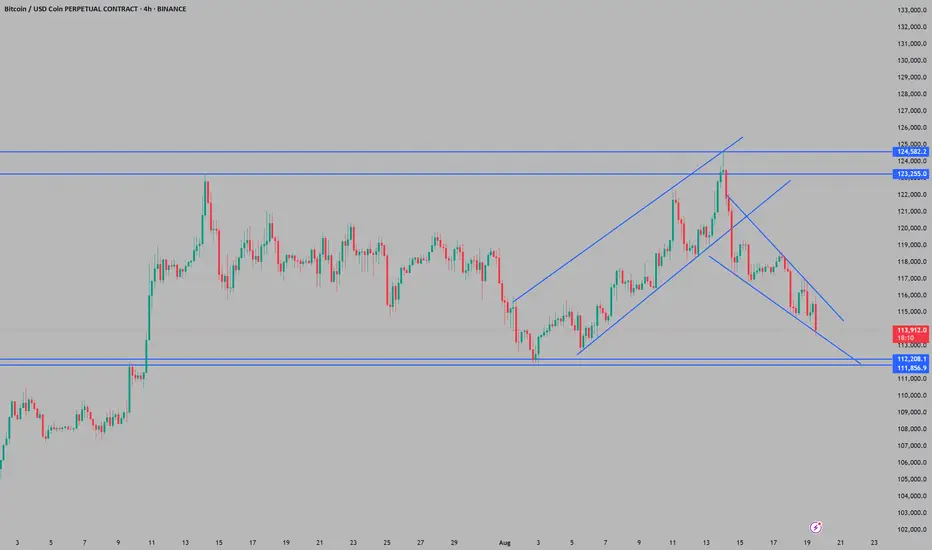
Bitcoin underperforms during unsettled conflictsSupport and Resistance Levels:
Major support appears to be around 111k–112k, which has held previously after a strong upward move.
Resistance levels marked at 123k and 124k indicate prior highs and significant selling pressure.
Price Action & Structure:
The price recently had formed an ascending channel, which was broken to the downside, suggesting the bullish momentum has faded.
Currently, price is inside a descending channel, moving lower after the recent drop from the highs. This typically indicates continued bearish pressure in the short term.
Trend:
With the breakdown of the ascending channel and price forming lower highs and lower lows, the short-term trend is bearish.
The price is approaching the major support zone (near 112,000). If this holds, a bounce is possible; if it breaks, further downside could occur.
Outlook:
Bearish bias short-term: Price is trending downward inside the channel.
Key zones to watch: The 111k–112k area for support. Bulls need to defend this level; failure likely leads to deeper corrections.
If the price recovers and breaks above the descending channel, it would be the first sign of potential reversal or consolidation.
Summary
Right now, Bitcoin’s 4H chart suggests weakness, with sellers in control short-term. Watch for reactions at the 111-112k zone—this will likely decide the next directional move. Bulls have to defend this area, or further decline is likely. Bulls should wait for signs of strength or a channel breakout before re-entering aggressively.
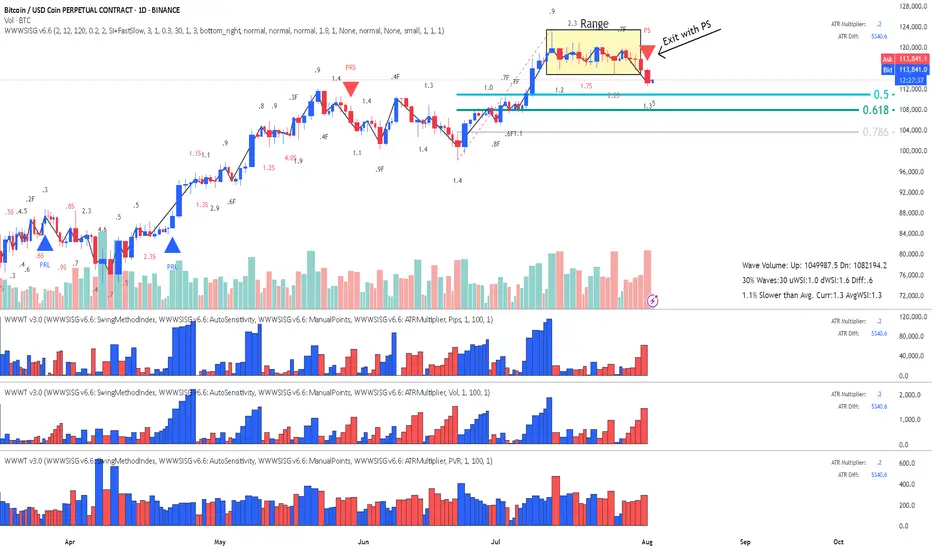
BitCoin - Is it heading for the Fib?This is a classic Entry Short for Weis Wave with Speed Index owners called " Exit from Range with a Plutus Signal" and in this case it was a PS. It looks that it's heading for the Fib, I will wait for some pullback on 1HR to confirm with Speed Index and the waves, as well as getting a better RR.
I
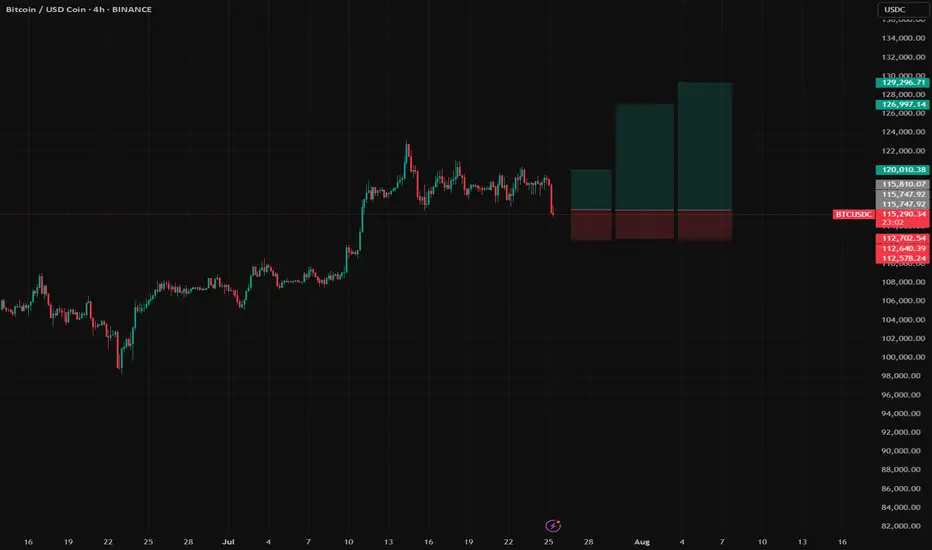
BTC Long Setup | Multi-target Swing Trade with Reasonable SL📝 Description:
Buy Bitcoin (BTC) based on continuation correction structure.
Entry: 115,800
Stop-Loss: 112,600
Risk: 1% per trade (position size adjusted accordingly, no leverage used trade spot only!)
🎯 Take-Profit Levels:
*Watch for a strong red candle at each TP zone.
If it happen, take full profit.
If not, let the position run and watch it again at the next target.
TP1: 120,000
TP2: 126,990
TP3: 129,296
RRR (Risk-Reward Ratio) across targets:
• TP1 = 1:1.3
• TP2 = 1:3.69
• TP3 = 1:4.36
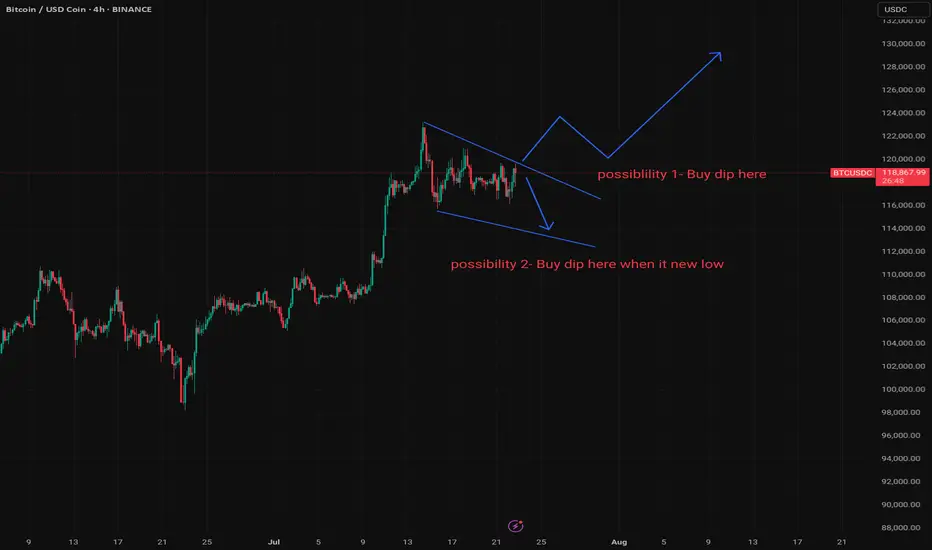
BTC Decision Point – Trade the Plan.BTCUSDC Outlook – Standby Mode Until Confirmation
BTC is currently forming a wedge on the 4H timeframe, typically a bullish continuation structure. However, now is NOT the time to enter. Patience is key — wait for price confirmation.
📌 First Plan (Possibility 1):
If price clearly breaks out to the upside, wait for a pullback
Drop to the 1H or 15min chart
Plan a long entry after price pulls back and forms a supportive structure and Stoploss below that pull back structure a little bit.
📌 Second Plan (Possibility 2):
If price breaks below the support line and forms a new low, do NOT panic sell
Switch to the 15min timeframe — it will likely appear as a downtrend. Wait for the first bullish impulse that may signal a potential reversal.
Enter only after price action confirms a shift from bearish to bullish trend (with green impulse) and Stoploss below that green impulse a little bit.
⛔ Conclusion: This is not an entry zone yet. Wait for clarity and confirmation from lower timeframes before taking action.
Long trade
15min TF
BTCUSD Perpetual – 15-Minute Chart Analysis
Key Trades Highlighted
Trade #1:
Type: Buyside trade
Entry: 114,171.5
Profit Level: 118,677.0 (+3.97%)
Stop Level: 113,635.5 (–0.47%)
Risk/Reward: 8.63
Entry Time: Thu 10th July 25, 5:15 pm (NY Session PM)
Target Reached: Fri 11th July 25, 5:30 pm
Trade Duration: ~24 hrs 15 min
Trade #2:
Type: Buyside trade
Entry: 116,411.5
Profit Level: 121,406.0 (+4.29%)
Stop Level: 115,751.0 (–0.57%)
Risk/Reward: 7.56
Entry Time: Tue 15th July 25, 11:30 am (NY Session AM)
Chart Structure & Technicals
Trend: Strong bullish impulse, minor retracement, continuation attempt.
Moving Averages:
EMA (blue): 117,873.4 (dynamic support/resistance)
WMA (yellow): 117,858.0 (price riding above, confirming bullish momentum)
Key Levels:
Resistance: 121,406 – 121,390 zone (Profit Target)
Support: 116,416 – 116,411 zone (entry confluence for current trade), 115,751 (stop)
Major Swing Low: 113,635 (protective stop on previous trade)
Volume/Orderflow Insights
Impulse up from below 114k, pausing at 121k resistance.
Volume is considered likely to increase at key support zones (116,400–116,000) and around target/profit-taking regions.
Actionable Trade Ideas
If Long:
Stay in: As long as price holds above the 116,411–116,416 support, with stops below 115,751.
Targets: 121,406 (major), consider partials at prior swing highs or if momentum stalls.
If Not In:
Re-entry Zone: Watch for bullish reaction at 116,416–116,000; enter on confirmation (engulfing, break of LTF structure).
Invalidation: Clean 15-min close below 115,751, or signs of heavy sell pressure.
If Short Bias:
Wait for a break and retest below 115,751 for a possible short to 114,700, but primary bias remains bullish above this zone.
Summary Table
Trade Direction Entry Stop Target R: R Duration Status
#1 Long 114,171.5 113,635.5 118,677.0 8.63 24h 15m Closed TP
#2 Long 116,411.5 115,751.0 121,406.0 7.56 In Progress Active trade
Outlook
Maintain bullish bias as long as 116,400 holds.
Look for trend continuation toward 121k+ on breakout.
Monitor for reversal signals if price fails to reclaim/hold above WMA or EMA.

Btc have big long chanceI want to get an optimistic scenario from Bitcoin, which can increase up to five times as far as the history of Hawings.
🇮🇷Long Live Iran🇮🇷
Swing D1 Double TopHigherHigh > HigherLow structure is broken.
LowerHigh > LowerLow has formed, so the main trend is Short at present.
Trendline break until it occurs, until then the Long direction is lost.
MovingAverage retest may give strength to another Long trend...

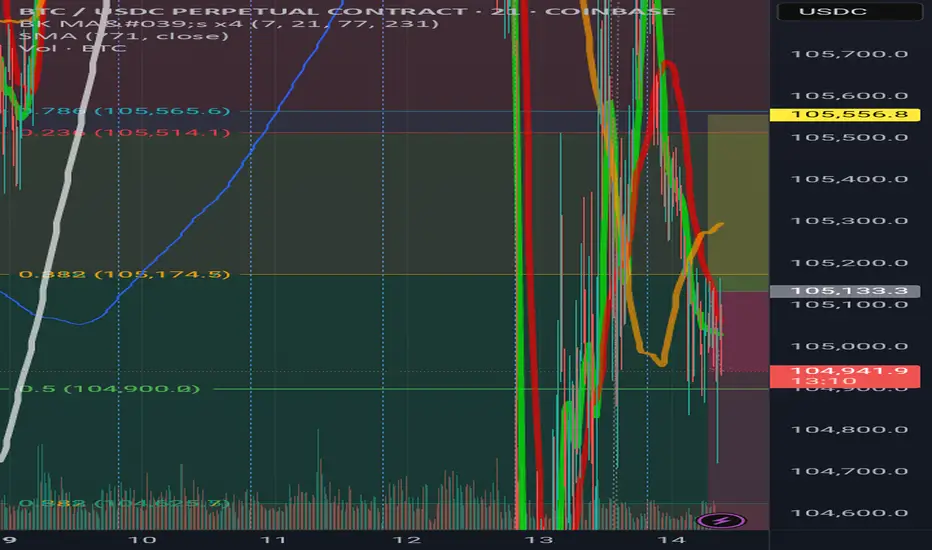
Bitcoin - Levels of the Range On the hourly time frame it is clear that BTC is within a rangebound environment. Using key levels such as the weekly highs and lows with Mondays highs and lows to to paint a picture of where support and resistance may be.
In the "weekly outlook" post for this week I suggested a retest of the $108,500 area, an orderblock that pushed prices lower and is notorious for protecting Stop losses of the shorts that pushed price lower, nearly instantly as the week starts we get that move to sweep the supply zone and stop hunt the short trades.
After a successful sweep the swing fail pattern typically follows when in a rangebound environment or absent of a trend. This structure plays out and the sell-off follows.
Price breaks through the Monday low with zero fight so momentum is with the bears in the low time frame. Should momentum continue the previous week low is @ $102,500 which is in line with HTF key level too.
RSI is also entering the oversold zone and in a rangebound environment can be when price reverses direction, as seen by the previous Monday High and Previous week low.
With FOMC just over 24 hours away volatility usually follows. No rate cut forecast however many think the interest rate should be brought down in line with inflation as the ECB has already done.
In conclusion, BTC is in a clear rangebound environment on the hourly time frame.
Stop loss hunt/supply zone sweep and then SFP, the LTF momentum is with the bears going into FOMC.
Next point of support at $102,500 (Previous week low) and could be boosted by the oversold RSI.
An FOMC rate cut should be bullish although currently thought to be unlikely.

Non Uclidean Fib BTC down after denial of Dual ZoneBTC keeps denying Zone the future of BTC spells a fall down a cliff
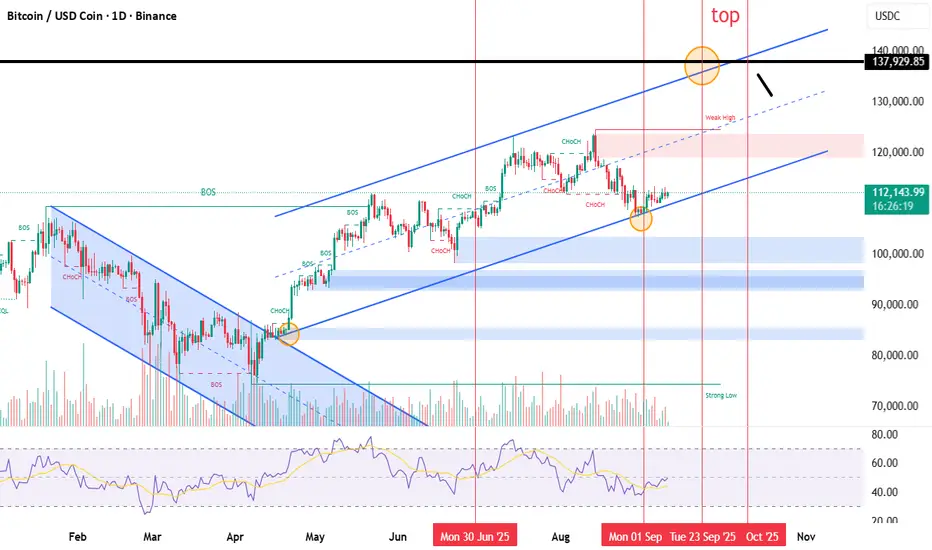
Bitcoin New ATH - Where now?After Bitcoin makes new all time highs, the next steps are very important. Where price goes now can be tricky to predict as there is the rare factor of price.
One of the only ways to predict where BTC may find resistance during price discovery is to use Fibonacci levels, using Fib extensions the first target for me would be between $117,500-$120,000. This area would be between the fib extension and the big even level, RSI would also be overbought on the daily time frame.
For the bearish scenario I think it's a much simpler play from a TA standpoint, lose the trend channel and get back under the old ATH level and I think we see a pullback towards $97,000. After such an extreme rally over the last 2 months with little to no rest a 10% correction would not be out of the ordinary despite such bullish ETF inflows. I have mapped a second target area should $97,000 fail, a SFP of the range can lead to a retest of the midpoint, this correction path would be much more severe with a more than 15% move lower.
To sum it all up Bitcoin has been on a great run in the last 2 months and has reached most traders common target of making a new ATH. Now there must be a new objective... Continue the move into price discovery or a corrective move? Price discovery has no previous selling history and so Fib levels along with big even levels are used to predict resistance levels. Corrective move would mean dropping out of the bullish trend channel and falling into a place of support, in my mind that would be ~$97,000 or failing that ~$91,000 (range midpoint).

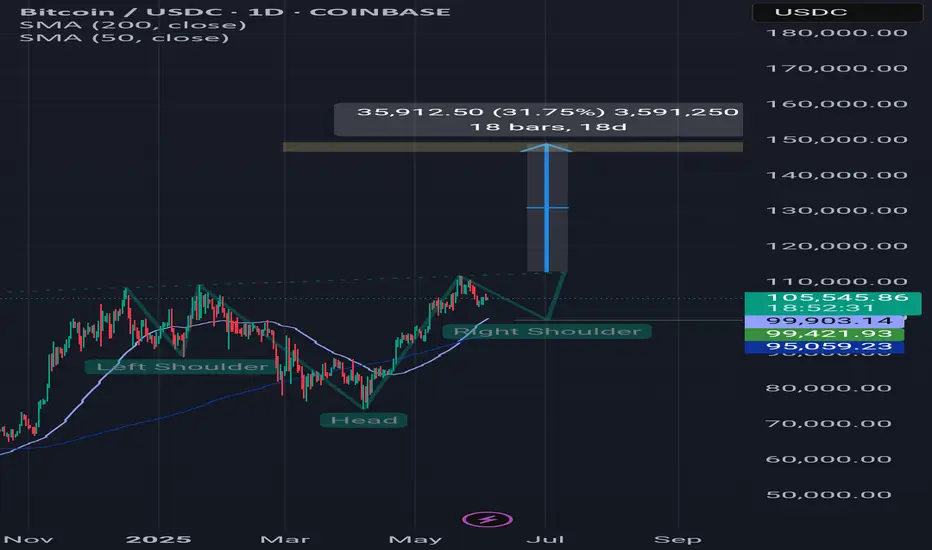
Btcusdt updateAnother scenario that can be imagined for Bitcoin is this. A head and shoulders pattern and a reversal from the $99,400 range and a rise to the $140,000 range, which could be the end of Bitcoin's celebration. In addition, we have a lot of news in these two weeks that may cause this 40% scenario to happen. Thank you for reading this text. Please share your opinion. Thank you.
BTC will drop from here to around 100k **Bitcoin Analysis Update**
Bitcoin has printed a **bearish divergence**, suggesting a potential reversal from the current level. Based on the setup, a drop toward the **\$100,000–\$101,000** range is likely.
This presents a **low-risk, high-reward trade opportunity**, with a **risk-to-reward ratio of approximately 8:1 or 9:1**, depending on whether the position is held through to the \$100K target.
As always, conduct your own analysis and manage your risk accordingly.
**This is not financial advice—trade responsibly.**

BTC short to 101!
**"Bitcoin is likely to retrace to at least the 101 level before resuming its upward trend. This area represents the next significant demand zone. Additionally, the next Fibonacci support 0.382 fib lies around the 98 level. Despite this expected pullback, the overall market sentiment remains very bullish, and I view this dip as a potential buying opportunity."**
---
This is not financial Advice, follow your own TA*****

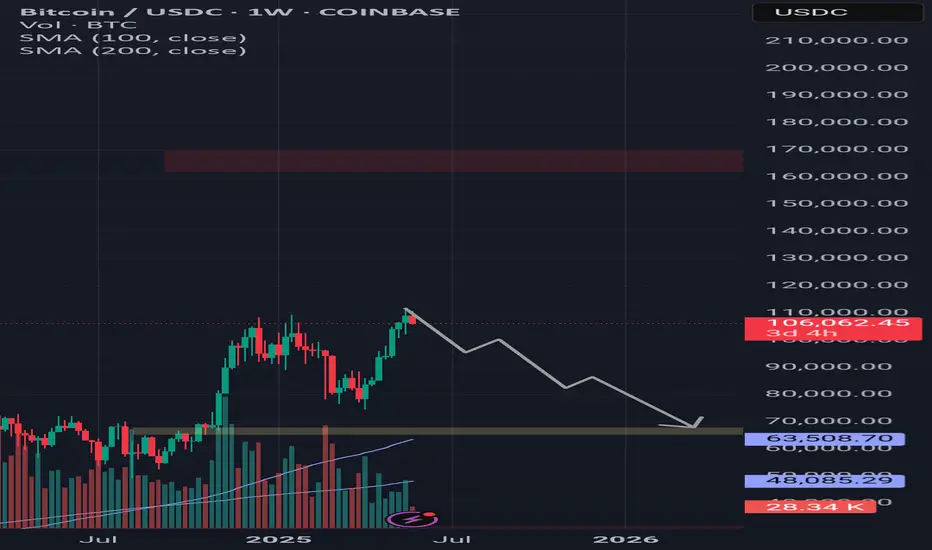
BtcusdtHello dears, I did a simple analysis of Bitcoin for you. If the next weekly candle is also bearish, it may happen with a probability of sixty percent. If you want to buy, buy at the specified price, which is about sixty-five thousand dollars. Good luck (⚠️A lot of data was reviewed for analysis, such as the Fear and Greed Index, Fibonacci, previous bullish periods, etc., but the responsibility for trading is yours⚠️)
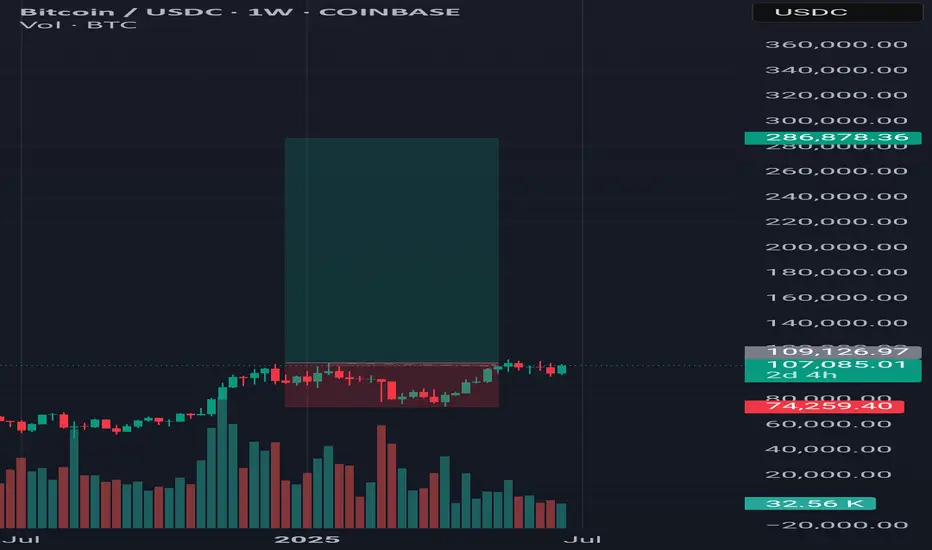
Bitcoin Levels in 2025Prediction levels on Bitcoin in 2025.
*first step - 143000 $ - 144000 $
* quick shot and back - 210000 $
* almost imposible in 2025 - 280000 $
We waiting for Fed decissions in this week.
- FOMC protocol 28 may 2025 - 19:00 (GMT +1)
- PKB USA 29 may 2025 - 2:30 PM (GMT +1)
- Core PCE 30 may 2025 - 14:30 (GMT +1)
