Bitcoin - Sacrificed by the banks! (100k, then 130k - buy here)Bitcoin and the whole crypto market have been dropping heavily these days. And I know why! You may wonder, why is Bitcoin in such a weak uptrend, and why do the majority of altcoins never grow, or after a small pump, a huge dump follows? Finally, I bring you the answer to this important question many of you are wondering about.
You know that the world is basically controlled by these 2 companies, BlackRock and Vanguard. So every time you visit a supermarket, you can be sure that 95% of all items are from 1 major company, so they are pretty much telling you what to eat and drink. That's public information; everyone can verify it. There is really nothing special or secret about it.
So there is no doubt that the financial markets are manipulated by whales (banks, governments, and big funds). They can very easily move the price in whatever direction they want. And because altcoins have a very low market cap, they made the price action look like a pump and dump scheme. So every time you buy a coin, you end up in a loss, because they use altcoins as a casino. That's their game, and that's how they make money in crypto. There is really no real uptrend or downtrend on altcoins; in fact, the majority of the time the market has been going down, and only sometimes do we see a big pump, but that's just a temporary event. You can be sure that the market will go down again. Please boost and comment if you agree with you.
Now, everyone is buying coins such as XRP, but what if I tell you that XRP will drop heavily in 2026 to 0.6 USD? The current price is 2.8 USD, so that's a huge crash. Yeah, the majority will find out that this was a scam, and they will sell with an 80% loss on their account into the hands of banks.
So what about Bitcoin? I expect Bitcoin to hit 100k in the next weeks! I think this is a very strong buyable support, but we need more data to confirm another uptrend to 130k! Write a comment with your altcoin, hit the like button, and I will make an analysis for you in response.
BTCUSDT.5S trade ideas

Bitcoin Short Update - Updated Targets and Corrective MoveHi all,
Short update on my BTC short - with updated numbers and anticipated zig zag correction.
I’m updating frequently because this drop will happen extremely fast. Only those who are prepared before hand will be able to take advantage.
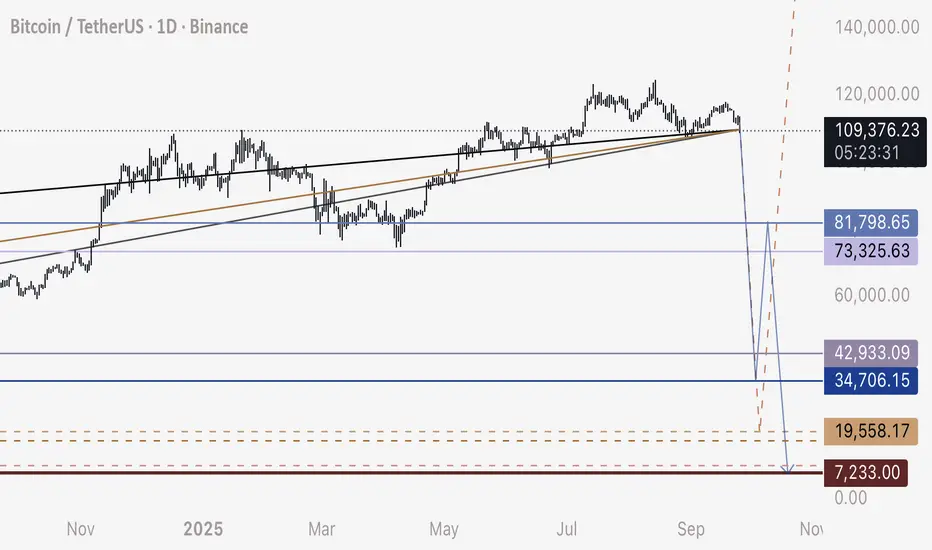
110,000 to 35,000
35,000 to 81,000
81,000 to 8,000
Take profit roughly 5,000 below or above each respective pivot point.
Best of luck and thanks to those who support my ideas.
Bitcoin’s Next Big Move: Buy the Dip Before $138K!Hello guys!
Bitcoin is once again at a critical stage, and the chart is giving us a clear roadmap for the next move. Let’s break it down:
Current Setup
Price is holding above $108K–109K and has shown strength around the $103K support zone.
The structure remains bullish as long as BTC trades above $100K.
Strategy
1- Entry zones for buying:
Current market price (~$109K)
Support zone around $103K (a good second chance for buyers).
2- Stop-loss: Around $99K, just below the psychological and structural support of $100K.
3- Target: Upside potential points toward $138K , which aligns with the next major resistance zone.
⚠️ Risk Factor
If BTC breaks below $100K, the bullish phase ends, and we should expect a bearish shift in momentum. In that case, caution and defensive trading will be the smarter play.
📌 Conclusion
For now, the play is simple:
👉 Stay bullish and buy dips while BTC is above $100K.
👉 Watch the $103K zone for re-entries.
👉 Protect your capital with a $99K stop-loss.
👉 Aim high-> the next big target sits around $138K.

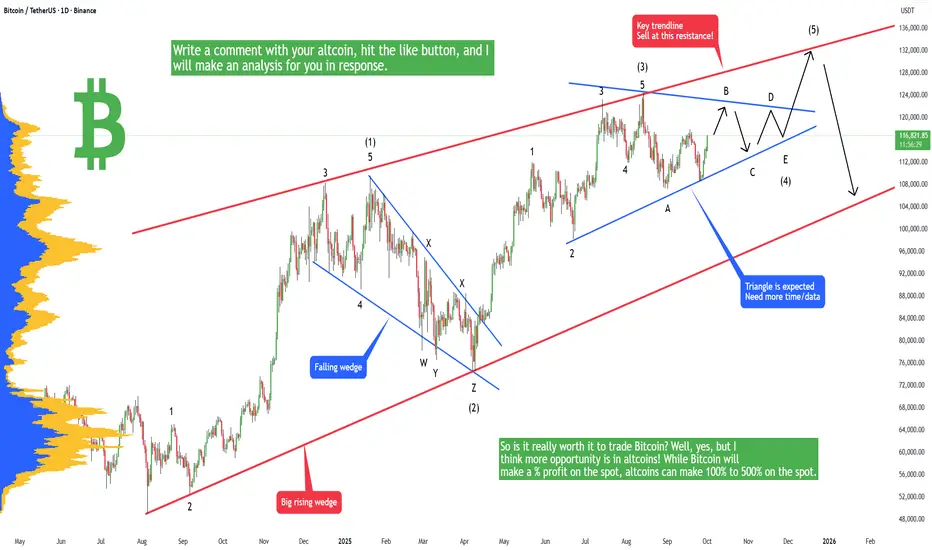
Bitcoin - LifeTime opportunity if you read this!Bitcoin is in the last stage of the current bull market (from 15k to 130k) and you definitely want to know where to sell otherwise you can experience a huge loss in 2026. You don't want to watch your portfolio dropping by 50% to 80%. You probably already know that the market is completely manipulated by banks and huge institutions, so you have to trade with big money. In the Elliott Wave theory there is a well-known fact that triangles usually occur in the last stage of the trend, so if you see a triangle, you should be aware of this fact and act accordingly. I think this is exactly what can happen on Bitcoin during the September-October-November-December time period.
So what is the plan? I think Bitcoin may go sideways in the next weeks, as you can see on the chart, to form a triangle, and then in December we may see a big breakout to the upside. 128k to 132k is something very real for the price at the end of this year. So is it really worth it to trade Bitcoin? Well, yes, but I think more opportunity is in altcoins! While Bitcoin will make a % profit on the spot, altcoins can make 100% to 500% on the spot. Choosing the right altcoins is not that easy, but I can tell you that DOGE looks promising, and we may see a new all-time high on this coin this year! Why is DOGE a good investment in the next weeks? First, because big players, they like this coin, and they want this coin to go up. There is really no second reason, because you want to trade with big money, not against it. No, there is another reason, and it's that you like dogs and you like this MEME.
But if you are not sure about your coin, please leave me a comment + hit the like button, and I will make an analysis in response to you! Trading is not hard if you have a good coach! This is not a trade setup, as there is no stop-loss or profit target. I share my trades privately. Thank you, and I wish you successful trades!
BTCUSDTHello Traders! 👋
What are your thoughts on BITCOIN?
Bitcoin is still moving inside an upward channel.
After its strong rally, the price has entered a corrective phase and is now positioned around the midline of the channel.
We expect the correction to extend toward the support zone and the lower boundary of the channel after some short-term fluctuations.
From that area, a potential rebound could trigger the next bullish wave.
If support holds, Bitcoin is likely to resume its upward movement toward the upper boundary of the channel.
As long as the price stays above the key support area, the medium-term outlook remains bullish.
What do you think? Will Bitcoin bounce from the channel bottom and head for the top again?
Don’t forget to like and share your thoughts in the comments! ❤️

BTCUSDT: Potential Reversal at Key Support👋Hello everyone, what do you think about the trend of BINANCE:BTCUSDT ?
Bitcoin is currently undergoing a short-term correction after forming a peak above $114,500. The price is now heading toward a key support zone around $110,000, which is also seen as an important confluence zone.
If Bitcoin stabilizes here and confirms the support level, we could see another potential bounce, pushing it back towards previous resistance levels. Pay attention to the possibility of a price reversal from this support zone, as it might create a buying opportunity.
What do you think about BTCUSDT? Let me know your thoughts in the comments below!
Good luck!

Bitcoin - Shortterm correction in the bullish trend!Introduction
The Bitcoin price action is currently moving within a structured range where both liquidity and fair value gaps (FVGs) are playing an important role in shaping potential market direction. By analyzing the chart, we can identify key areas of liquidity, resistance, and support that traders are likely to pay close attention to in the coming days. Understanding how price reacts around these zones will help anticipate whether bulls can maintain control or if bears will attempt to reclaim lost ground.
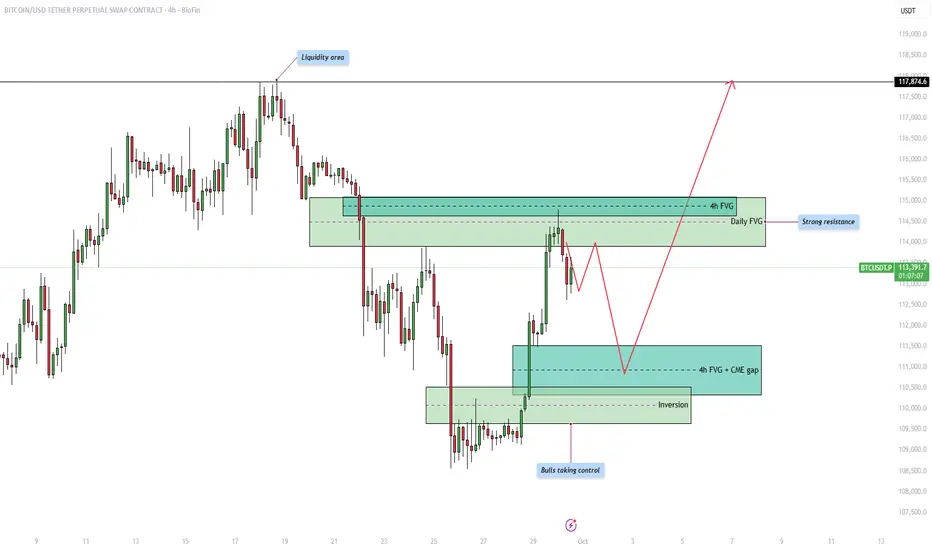
Upside liquidity
At the top of the range, we can see a clear liquidity area where price previously reversed. This liquidity pool represents buy-side liquidity, and the market could be drawn towards it as price seeks to sweep the highs. Liquidity is often targeted by the market before making a significant move in the opposite direction, which makes this area important to watch closely.
Resistance from the 4h and daily FVG
Before price can reach higher liquidity levels, it must contend with a strong resistance zone that overlaps with both the 4-hour and the daily fair value gap. This confluence strengthens the resistance, making it more likely that price will struggle to break through immediately. Traders will be watching for signs of rejection within this area, which could cause short-term pullbacks before any potential breakout.
4h FVG and CME gap support
On the downside, the 4-hour fair value gap aligns with the CME gap, providing a strong support level. This zone acts as an attractive area for price to retrace into before continuing higher. It is common for the market to return to such imbalances to fill inefficiencies, so a temporary dip into this support could serve as a healthy retracement before bulls attempt to push price further upward.
Bullish inversion
Another critical development is the inversion zone, where previous resistance has now flipped into support. This shift highlights that bulls are taking control of the market structure, strengthening the overall bullish outlook. As long as this inversion level holds, buyers are likely to defend it aggressively, reducing the probability of a deeper breakdown.
Final thoughts
Overall, the market remains in a bullish posture with upside liquidity acting as a magnet, but significant resistance awaits at the overlapping 4h and daily FVG. Short-term pullbacks into the 4h FVG and CME gap support are likely before the next major move upward. If the bullish inversion continues to hold, we could see a strong push towards the higher liquidity zones, potentially targeting levels beyond 117,000. The coming days will be crucial in determining whether bulls can maintain this control or if resistance proves too strong.
-------------------------
Thanks for your support. If you enjoyed this analysis, make sure to follow me so you don't miss the next one. And if you found it helpful, feel free to drop a like 👍 and leave a comment 💬, I’d love to hear your thoughts!
The Power of Confluence – Turning Chaos into Clarity!Most traders lose because they jump on the first signal they see. A trendline break, an RSI crossover, a candlestick pattern… But in isolation, these signals are weak and often misleading.
The market rewards patience and confluence; when multiple factors align at the same level, turning noise into clarity.
📈 Why Confluence Matters
Think of trading signals like witnesses in court. One alone may be unreliable. But when several confirm the same story, the probability of truth skyrockets. The same applies to trading setups.
🔑 Types of Confluence
- Structure + Trendline: A horizontal support aligning with a rising trendline.
- Fib + Zone: A 61.8% retracement overlapping with a demand area.
- Pattern + Level: A double bottom forming right on a key support.
- Multi-Timeframe: Weekly support intersecting with a daily trendline.
- The more elements lining up, the stronger the zone becomes.
📊 Example
Imagine Bitcoin approaching $107,500. On the weekly, it’s a major structure. On the daily, a falling wedge support. On the 4H, RSI is oversold. Alone, each signal is average. Together, they form a high-probability buy zone.
⏳ The Takeaway
Confluence isn’t about predicting the market; it’s about stacking probabilities in your favor. Instead of chasing every move, wait for the market to whisper the same message from different angles. That’s where consistency is built.
What’s your favorite type of confluence setup? 🤔
⚠️ Disclaimer: This is not financial advice. Always do your own research and manage risk properly.
📚 Stick to your trading plan regarding entries, risk, and management.
Good luck! 🍀
All Strategies Are Good; If Managed Properly!
~Richard Nasr

The range zone will break to the upside and heavy gain after We set our entry on 110K$ and stop loss is below the range zone support because the pattern of fall may happen again but i think soon that 110K will touch again and we would have a breakout to the upside and confirmation of that is 110500$ touch but we open earlier and near 110K because i want signal with 1:2 R:R(RiskReward) just like what you can see on chart so we risk a little bit and open this signal on 110K and below 113K we are out to save some profit.
DISCLAIMER: ((trade based on your own decision))
<<press like👍 if you enjoy💚

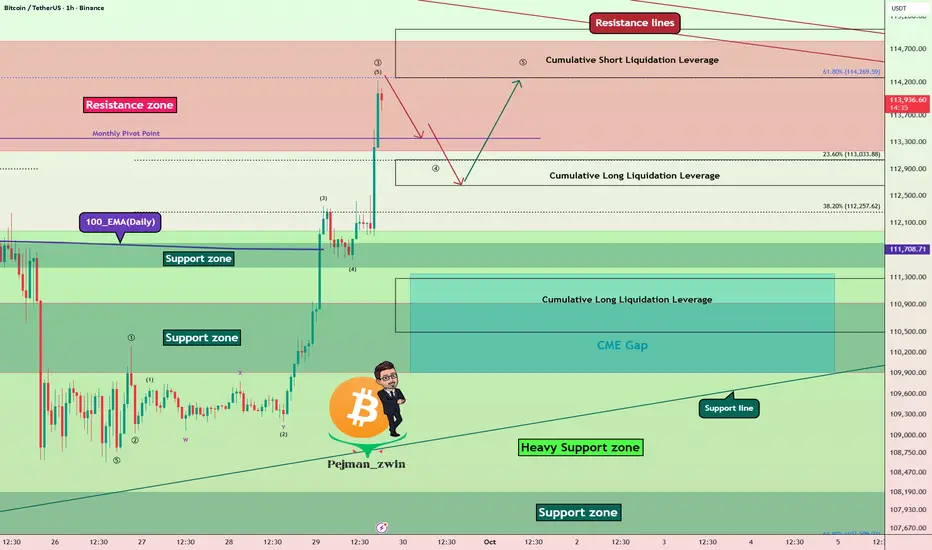
Bitcoin Resistance Zone Battle – ATH or Fakeout?Bitcoin ( BINANCE:BTCUSDT ) has shown strong momentum over the past 5 days , liquidating many traders in both Long and Short positions .
Bitcoin has now entered the Resistance zone($114,820-$113,170) and is moving near the Cumulative Short Liquidation Leverage($115,000-$114,272) and Resistance lines .
From an Elliott Wave Theory perspective, given Bitcoin’s strong bullish momentum over the past 24 hours, it appears to be completing Wave 3. This Wave 3 seems to be of the extended type.
I expect Bitcoin , after a correction , to make another attempt toward the Resistance zone($114,820-$113,170) and potentially test the Resistance lines .
Do you think this bullish move could lead to a new all-time high (ATH) for Bitcoin?
Cumulative Long Liquidation Leverage($113,037-$112,650) + Near Monthly Pivot Point($113,356): An area where Bitcoin could start rising again (if there is a correction, of course).
Cumulative Long Liquidation Leverage: $111,100-$110,500
CME Gap: $111,355-$109,915
Note: Also, Bitcoin approaching the 61.8% golden Fibonacci level could lead to a Bitcoin correction.
Please respect each other's ideas and express them politely if you agree or disagree.
Bitcoin Analysis (BTCUSDT), 1-hour time frame.
Be sure to follow the updated ideas.
Do not forget to put a Stop loss for your positions (For every position you want to open).
Please follow your strategy and updates; this is just my Idea, and I will gladly see your ideas in this post.
Please do not forget the ✅' like'✅ button 🙏😊 & Share it with your friends; thanks, and Trade safe.
#BTC/USDT THE ONLY BITCOIN CHART YOU NEED!BTC : Almost There!
BTC is currently following the trajectory shown in my last chart. It took some time, but it’s playing out exactly as expected. Sooner or later, a bounce is coming — there’s no reason to panic unless we break below $103.5K, which is the key support level.
You need to understand that only when money moves out of BTC and big-cap alts will THE MID AND THE SMALL CAPS will have their time to shine. And sooner or later, you'll realise all this happened for good if you played it right. Even if not, many opportunities are coming ahead.
You’ll see this happen soon.
MY MESSAGE TO YOU ALL:
If you've been in crypto for a few years, you know this moment: it’s when the market is on the brink of a big move.
Be patient, it won’t happen overnight, but sooner or later, it will.
If you're currently in the red, take it as a lesson. It happens to the best of us. I've had four positions stopped out, too. It could have been worse if I hadn’t had a STOP LOSS in place.
The silver lining? I can re-enter at a better price.
A lesson I’ve learned over the years: STOP LOSS is a life-saver.
Stay strong and don’t give up right before the big opportunity we’ve all been waiting for.
Opportunities are ahead, manage your risks and remember to take a break, touch some grass. I’m with you.
I'll drop more charts shortly.
Stay strong, folks.
WAGMI!
Do hit the like button, and if you have any doubts, questions, or chart requests, drop them in the comments.
Thank you
#PEACE

How to Turn Others Fear and Greed Into your ProfitHave you ever felt opportunities slip away when others sell in fear or buy in greed?
The crypto market is full of emotional moves that can create big profits.
In this analysis, we will learn how to read crowd behavior and benefit from it.
Hello✌️
Spend 2 minutes ⏰ reading this educational material.
🎯 Analytical Insight on Bitcoin:
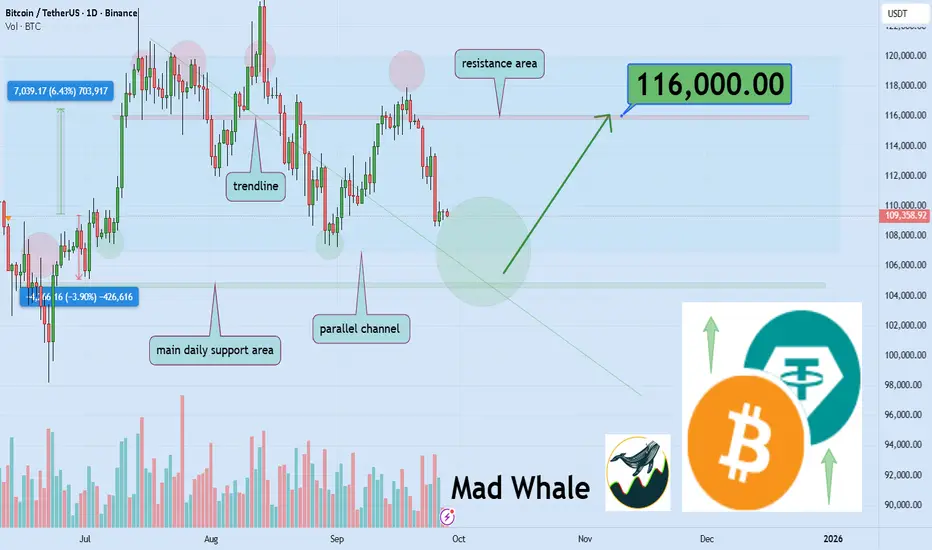
Bitcoin is approaching a key daily support and a reliable trendline within a parallel channel, holding which could set up a 6% rally toward 116,000$. Traders should watch this level closely for a potential bounce. 📈🔍
Now , let's dive into the educational section,
🔮 Market Psychology and Crowd Behavior
Crypto is heavily influenced by collective emotions.
FOMO leads to impulsive and irrational buying.
FUD and negative news create fear, pushing prices down.
Recognizing these behaviors reveals trading opportunities.
The goal is to use collective emotions to your advantage.
💡 Practical Tips to Profit from Fear and Greed
Always monitor volume and key indicators.
Use classic patterns like Double Bottom and Bullish Engulfing.
Wait for short-term emotions to settle and the market to stabilize.
Never forget risk management; reserve some capital for market swings.
Avoid making decisions based on crowd emotions alone.
🧠 Individual Psychology and Greed
Understanding your own emotional weaknesses improves decisions.
Success means aligning with crowd behavior without falling victim to emotion.
Others’ fear and greed can become powerful tools for smart profit.
Focused, logical decisions are essential in volatile conditions.
Learning emotional control is the key to long-term success.
📊 TradingView Tools and Indicator
Volume: High volume in a downtrend signals potential buying opportunity.
RSI (Relative Strength Index): Oversold range signals possible price reversal.
Order Book and Level 2 Data: Reveal market pressure from fear or greed.
Sentiment Indicators: Analyze market mood for smarter decision-making.
Moving Averages: Identify strong trends and entry/exit points.
Alerts: Set alerts on critical levels to never miss opportunities.
Drawing Tools: Mark support, resistance, and channels for clarity.
Custom Scripts: Use simple scripts to detect emotional patterns.
📈 Practical Application
When strong market emotions coincide with indicator signals,
Allocate part of your capital for smart profit opportunities.
Simultaneously, manage risk and control your own emotions.
📝 Summary
Others’ fear and greed create golden opportunities.
Analyzing indicators and managing emotions is the key to success.
🌟 3 Powerful Recommendations
Always confirm signals with multiple indicators before acting.
Base decisions on analysis of crowd behavior, not on emotions.
Reserve capital for volatile opportunities while managing risk.
Continuous practice of emotional control is your most important market skill.
✨ Need a little love!
We pour love into every post your support keeps us inspired! 💛 Don’t be shy, we’d love to hear from you on comments. Big thanks , Mad Whale 🐋
📜Please make sure to do your own research before investing, and review the disclaimer provided at the end of each post.
TradeCityPro | Bitcoin Daily Analysis #182👋 Welcome to TradeCity Pro!
Let’s move on to Bitcoin analysis. Today the weekly candle closes, and from tomorrow the market can start moving again.
⌛️ 4-Hour Timeframe
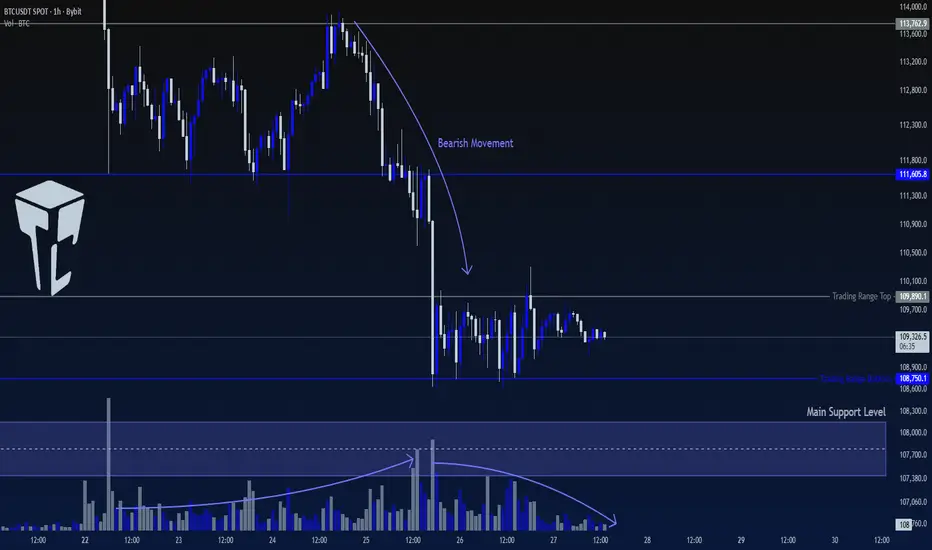
On the 4-hour chart, Bitcoin has started a downward move from the 117,570 high, dropping in two bearish legs down to the 108,750 zone.
✨ After reaching this area, volume began to decrease—both because the market is ranging and because it’s the weekend.
✔️ Yesterday, in my analysis, I highlighted a range box on the 1-hour chart. This same box is still visible now on the 1-hour timeframe, spanning 108,750 to 109,890.
🧩 Today’s New York session is very important, since this session often drives weekend market moves. So watch the market carefully,our triggers might get activated.
🔑 If strong volume enters today and 108,750 breaks, we can look to open a short position. However, keep in mind there’s an important support area just below this level that could prompt a reaction and halt further decline.
⭐ For a long position, the first trigger we have is a breakout of 109,890. But note that the short-term trend is still bearish, so it’s better to wait for bullish confirmation first. A clean break of 109,890, followed by a higher high and higher low above this level, would be a solid confirmation for a potential upward move.
❌ Disclaimer ❌
Trading futures is highly risky and dangerous. If you're not an expert, these triggers may not be suitable for you. You should first learn risk and capital management. You can also use the educational content from this channel.
Finally, these triggers reflect my personal opinions on price action, and the market may move completely against this analysis. So, do your own research before opening any position.

Lingrid | BTCUSDT Support Hold Bottom Bounce PlayBINANCE:BTCUSDT is stabilizing after setting a higher low near 110k, signaling demand at the support trendline. Price action shows a corrective phase following the prior range breakout, with structure now coiling just above 110,760 support level. A recovery above this zone could trigger momentum toward the 114,500 resistance area and higher levels. Broader context suggests consolidation within the upward structure, leaving room for a rebound attempt if buyers defend key levels.
⚠️ Risks:
Breakdown below 109,000 would reopen downside toward 107,000 support.
Strong dollar strength or macro headwinds could cap crypto momentum.
Failure to retake 112.5k may keep CRYPTOCAP:BTC stuck in a corrective range.
If this idea resonates with you or you have your own opinion, traders, hit the comments. I’m excited to read your thoughts!

Bitcoin Setup: Eyeing CME Gap at $113KBitcoin( BINANCE:BTCUSDT ) is currently trading in a Heavy Support zone($112,000-$105,800) and near the Support zone($110,920-$109,900), Support lines, Potential Reversal Zone(PRZ) , and Cumulative Long Liquidation Leverage($110,430-$109,660).
In terms of Elliott Wave theory, Bitcoin seems to have completed a microwave 5, the reason for today's drop was the correction in the SPX500 index( SP:SPX ) and the release of US indices(Final GDP q/q, Unemployment Claims).
Also, we can see the Regular Divergence(RD+) between Consecutive Valleys.
I expect Bitcoin to move back above 100_EMA(Daily) because the breakout volume was not enough, and attack the Resistance lines. If the Resistance lines are broken we can expect the CME Gap($113,380-$113,275) to fill.
First Target: $112,600
Second Target: $113,280
Stop Loss(SL): $109,280
Cumulative Short Liquidation Leverage: $114,866-$113,720
Please respect each other's ideas and express them politely if you agree or disagree.
Bitcoin Analysis (BTCUSDT), 1-hour time frame.
Be sure to follow the updated ideas.
Do not forget to put a Stop loss for your positions (For every position you want to open).
Please follow your strategy and updates; this is just my Idea, and I will gladly see your ideas in this post.
Please do not forget the ✅' like '✅ button 🙏😊 & Share it with your friends; thanks, and Trade safe.

Bitcoin Buy signalThis signal is a little risky and i would say it would be MED_RISK level.
also the RR is good and it is 1:3(Risk: Reward).
i put entry below the support of green trendline because we may have some stop loss hunting there.
Also if stop hit then market is also bearish for a while and more dump may lead like red arrows mentioned on the chart.
DISCLAIMER: ((trade based on your own decision))
<<press like👍 if you enjoy💚

Bitcoin Remains Well Positioned For a Deeper CorrectionBitcoin Remains Well Positioned For a Deeper Correction
Bitcoin is currently trading around 109,300 USDT after failing to continue higher. The chart shows signs of weakness, with a potential bearish move ahead.
It looks like we could be in for a bigger correction before the price drops further. That’s what the data so far suggests.
Whether BTC will extend into a normal correction or a bigger correction remains to be seen. We can not predict when the price might finish the correction most of the time.
If the bearish scenario continues, the next key support targets are:
100,000
88,300
79,000
Bitcoin is under pressure, and unless it recovers strongly above current highs, we may see a gradual move down toward the listed targets.
You may find more details in the chart!
Thank you and Good Luck!
❤️PS: Please support with a like or comment if you find this analysis useful for your trading day❤️

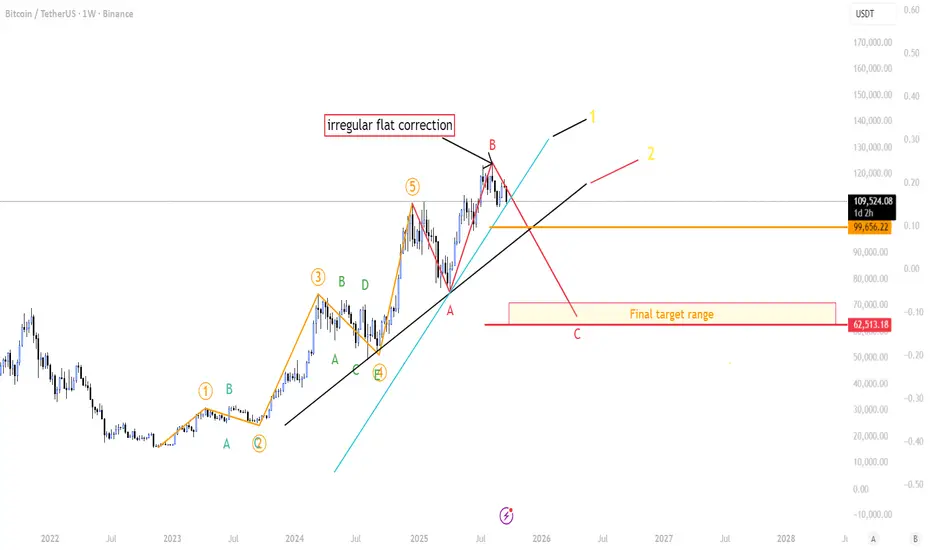
BTC at a Crossroad: Path to 62.5k Is Conditional-Pick Your PlayI’m sharing a possible irregular flat correction that could pull BTC toward ~62,513—only if two key trend supports break.
Note: This Elliott count differs from my main count. It’s my secondary scenario—lower conviction, but it deserves close attention because the structure is developing cleanly. This does not mean BTC is going down (it's just a watch out scenario)
The story so far
From the Nov 22, 2022 low, BTC ran a full 5-wave impulse.
Wave 3 was the extended one.
Wave 4 formed a triangle.
Wave 5 ran hotter than expected (roughly the size of Wave 3). That’s unusual, likely fueled by extreme Bollinger Band Width compression before the final push.
Why this matters: when Wave 3 extends, Wave 5 is usually shorter. It isn’t a hard rule—just a guideline—so this count stays on the board, but it’s not a high-conviction setup.
What I think is happening now
The drop and bounce look like an expanded (irregular) flat: (A) down, (B) up which was our All time high, C down.
If the pattern completes, C could target ~62,513.
Quick pattern note (irregular flat): It’s a 3–3–5 structure — A = 3 waves, B = 3 waves (often pokes above the prior high), and C = 5 waves. On this chart, A and B already printed as 3 + 3. The setup isn’t confirmed until we see C unfold as a clear 5-wave move (1-2-3-4-5). No five-wave C = no completed irregular flat.
What would confirm it (the “if/then”)
Lose the first rising trend support (≈ 109k).
Then lose the second, deeper trend support.
If both break, the path toward ~62.5k could be opening up.
Between those two lines: BTC can go sideways for a weeks—that “range box” is important.
Why the range box matters (Altseason meter)
Altcoins usually need steady BTC to fly:
BTC sideways (not spiking up or dumping).
TOTAL2 (alt mkt cap) breaks ATH.
BTC.D rolls over (dominance falls).
If these three line up, we’ve got a real altseason setup. If not, it’s noise.
Bottom line
This is a watchlist scenario, not gospel.
I’ll respect the levels: no break = no bear target.
If we range between supports, I’ll look for alt strength while BTC stays calm.
Bitcoin Roadmap: Can BTC Hold the $108K Before Next Big move!?Bitcoin( BINANCE:BTCUSDT ) managed to break the Support zone($110,920-$109,900) and Support lines yesterday with the help of a Bearish Marubozu Candle(the Marubozu candle volume was acceptable).
Bitcoin is still moving in the Heavy Support zone($112,000-$105,800) and near the important Support line, Potential Reversal Zone(PRZ) , Cumulative Long Liquidation Leverage($108,165-$107,000).
In terms of Elliott Wave theory, Bitcoin appears to be completing microwave 5 of the main wave 3. Microwave 4 of the main wave 3 is of the Contracting Triangle type, and the main wave 3 is of the extended type.
I expect Bitcoin to start rising and attack the Resistance lines after completing the main wave 3 from the Potential Reversal Zone(PRZ) , Support zone($108,200-$107,240), and Important Support line.
Cumulative Short Liquidation Leverage: $110,624-$109,836
Note: If Bitcoin touches $106,800, we can expect a break of the Heavy Support zone($112,000-$105,800).
Note: If Bitcoin goes above $111,000, we can expect a renewed rise in Bitcoin.
---------------------------------------------
One of the indices that helps the Roadmap of Bitcoin and other tokens is the USDT.D%.
USDT.D% currently seems to have managed to break the heavy resistance zone and this is NOT good news for Bitcoin and other tokens, and perhaps a further correction in the crypto market is on the way.
USDT.D%’s roadmap for me is that it is almost in line with today’s analysis of Bitcoin.
---------------------------------------------
Please respect each other's ideas and express them politely if you agree or disagree.
Bitcoin Analysis (BTCUSDT), 1-hour time frame.
Be sure to follow the updated ideas.
Do not forget to put a Stop loss for your positions (For every position you want to open).
Please follow your strategy and updates; this is just my Idea, and I will gladly see your ideas in this post.
Please do not forget the ✅' like '✅ button 🙏😊 & Share it with your friends; thanks, and Trade safe.

TradeCityPro | Bitcoin Daily Analysis #181👋 Welcome to TradeCity Pro!
Let's dive into Bitcoin analysis, today is Saturday, and it's part of the weekend, so the market is relatively quiet. Bitcoin has shown some bearish movement, and now is a critical moment for decision-making.
⏳ 1-Hour Timeframe
After breaking 111,605, Bitcoin dropped and reached 108,750.
✔️ During the downward move, volume increased, indicating strong selling pressure. However, as the price reached the 108,750 support and formed a range box, volume decreased, and with the start of the Saturday candle, the volume has dropped to its lowest level.
🎲 This box is formed above a very important support level, so breaking this box is crucial.
🔔 If the price breaks the box to the downside, the likelihood of breaking the support increases. However, one important thing to note is that shorting after breaking 108,750 is not an ideal trigger because the price might bounce from the support, causing a stop-loss.
📊 On the other hand, if the box breaks to the upside, we can assume that the price is correcting the downward move and could potentially retrace back to 111,605.
💥 If the price stabilizes above 111,605 or forms a higher high and low above 109,890, we can take this as the first sign of a bullish reversal.
🧩 Overall, neither shorting nor longing seems ideal at the moment, so I believe the best choice is to wait and see if the price either stabilizes below the support and moves downward or moves upward again, in which case we can consider entering a long position.
❌ Disclaimer ❌
Trading futures is highly risky and dangerous. If you're not an expert, these triggers may not be suitable for you. You should first learn risk and capital management. You can also use the educational content from this channel.
Finally, these triggers reflect my personal opinions on price action, and the market may move completely against this analysis. So, do your own research before opening any position.
Bitcoin Faces $120K Resistance – Bull Trap or Breakout?Bitcoin ( BINANCE:BTCUSDT ) continued its uptrend of the last 2-3 days as I expected in my previous idea . Today, the announcement of the ADP Non-Farm Employment Change index worked like a catalyst for Bitcoin .
Bitcoin is currently surrounded by Resistance zones and a Potential Reversal Zone (PRZ) , and is near the important price of $118,400(Volumetric importance) and the $120,000(Round Number) .
From the perspective of Elliott Wave theory , it seems that Bitcoin could be in corrective waves and that the increase of the last few days could only serve as a Bull Trap .
I expect Bitcoin to decline at least to the Support lines .
Cumulative Long Liquidation Leverage: $113,590-$111,900
Cumulative Long Liquidation Leverage: $115,823-$115,087
Cumulative Short Liquidation Leverage: $120,000-$118,000
Note: If Bitcoin falls below the Support zone($114,820-$113,180), we should expect further declines.
CME Gap: $111,355-$109,915
Stop Loss(SL): $120,103
Please respect each other's ideas and express them politely if you agree or disagree.
Bitcoin Analysis (BTCUSDT), 1-hour time frame.
Be sure to follow the updated ideas.
Do not forget to put a Stop loss for your positions (For every position you want to open).
Please follow your strategy and updates; this is just my Idea, and I will gladly see your ideas in this post.
Please do not forget the ✅' like '✅ button 🙏😊 & Share it with your friends; thanks, and Trade safe.

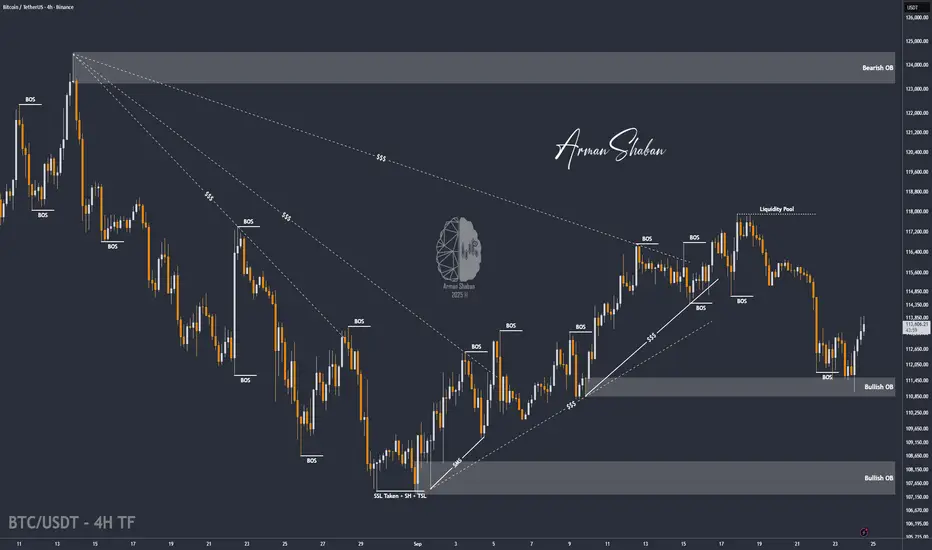
BTC/USDT | BTC Bounce After $111K Dip – Liquidity Gap in FocusBy analyzing the Bitcoin chart on the 4-hour timeframe, we can see that after a heavy correction down to $111,000, the price found demand again and is now trading around $113,600.
I expect Bitcoin to continue rising to fill the liquidity gap, with the first target at $114,150. Other targets and scenarios will be shared tomorrow!
Please support me with your likes and comments to motivate me to share more analysis with you and share your opinion about the possible trend of this chart with me !
Best Regards , Arman Shaban
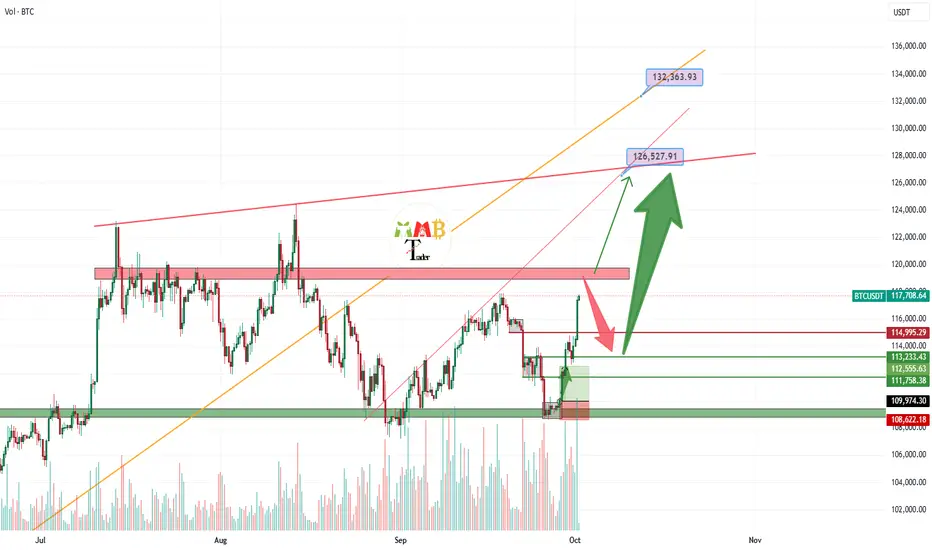
Bitcoin market is again bullish and target is 130K$ if 113K holdThe chart is easy to read the major resistance zone now is ahead and that is 119K$ resistance zone and price can rest there like previous time and we may have short-term fall near that resistance once again but if this time 113K$ to 115K$ hold strong as support then boom next phase pump will pump the price like green arrow to our target which is above 130K$.
also we may have breakout to the upside here without retesting 113K$ and then again we are looking for targets like 126K$ and more because as you can see market and bulls are getting strong once again.
DISCLAIMER: ((trade based on your own decision))
<<press like👍 if you enjoy💚