BTC bullish harmonicsHere we have 2 bullish harmonics for BTC (doesn't look bullish does it) but these are bullish. B area is always an area to watch for signs of a pulse, just keep in mind that MMs can just pump this anytime they want, if there's a crowded trade then we know how it goes.
NFA, do your own TA and stay safe
Trade ideas

Bitcoin long term view Almost 70million Bitcoin bought in just 5 months and that's why we saw a huge rally....now it's time to sell...it will reach below level

DeGRAM | BTCUSD is testing the $90k level📊 Technical Analysis
● BTC/USD is testing a major support cluster near 88–90K, where price aligns with the long-term dynamic support line formed from previous triangle and flag breakdowns.
● The new rejection wick at support and the descending channel structure suggest a potential medium-term rebound toward 95–97K if buyers defend this level.
💡 Fundamental Analysis
● Bitcoin sentiment stabilizes as ETF inflows resume and risk assets recover after easing US inflation expectations.
✨ Summary
Support: 88–90K. Rebound potential: 95–97K. Medium-term bullish scenario valid while holding the dynamic support.
-------------------
Share your opinion in the comments and support the idea with a like. Thanks for your support!

another victory added to the winstreekmtops-ai's forecast nailed it yet again
this one was a little harder than usual as the higher time frame is still towards the end of an already long transition
the lesson for me is to trust mtops-ai, as it knows the market better than any human ever could

BTCUSDT SELL WITH LIMIT ORDER!!!!BTCUSD completed my last recent analysis predictions today we have the making a strong pull back into my poi after my inducement am taking a sell from that limit order after my min charts confirmations......

TradeCityPro | Bitcoin Daily Analysis #223👋 Welcome to TradeCity Pro!
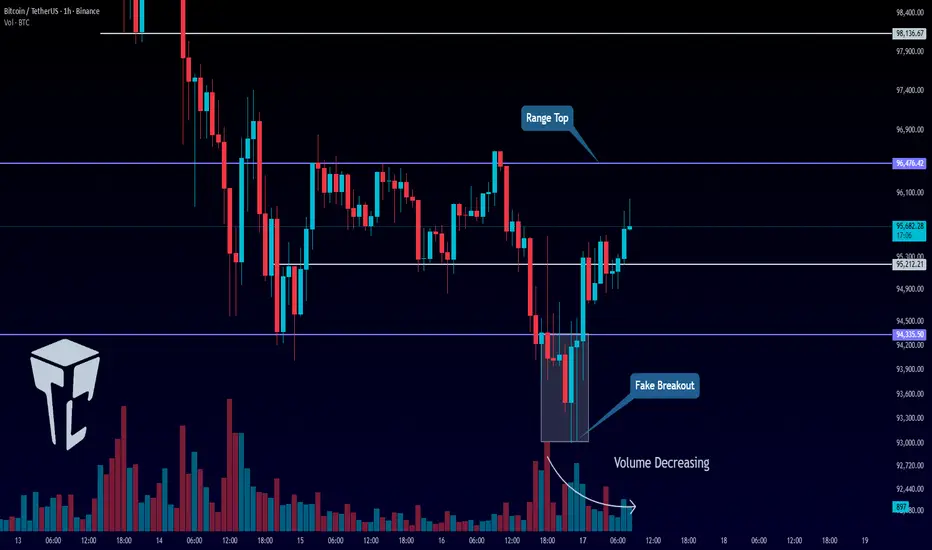
Let’s dive into the Bitcoin analysis. Yesterday, Bitcoin made a fake downward move and is now back in its range box.
⏳ 1-Hour Timeframe
Yesterday, the short triggers we had at 95,212 and 94,335 were activated, and the price moved slightly downward. However, this bearish move turned out to be a fakeout, and the price started moving upwards again.
✅ Currently, the price has moved above 95,212 and managed to stabilize above this level. The next resistance zone for Bitcoin is at 96,476.
⚡️ The 96,476 zone was faked yesterday, and after a candle closed above it, the price moved downward. Now, we need to wait for the price’s next reaction to this level to refine the exact breakout point.
✨ After this encounter, we can open a risky long position if the level breaks on the next attempt. The next target above this level is 98,136.
📊 For a short position, since the price faked the bottom of the range, the chart is a bit messy. I personally prefer to wait for the price to establish more structure and for a new trigger to form. We can then open a new position upon the breakout of the next trigger.
💼 For previously opened short positions, we can move the stop loss above the 96,476 level.
❌ Disclaimer ❌
Trading futures is highly risky and dangerous. If you're not an expert, these triggers may not be suitable for you. You should first learn risk and capital management. You can also use the educational content from this channel.
Finally, these triggers reflect my personal opinions on price action, and the market may move completely against this analysis. So, do your own research before opening any position.
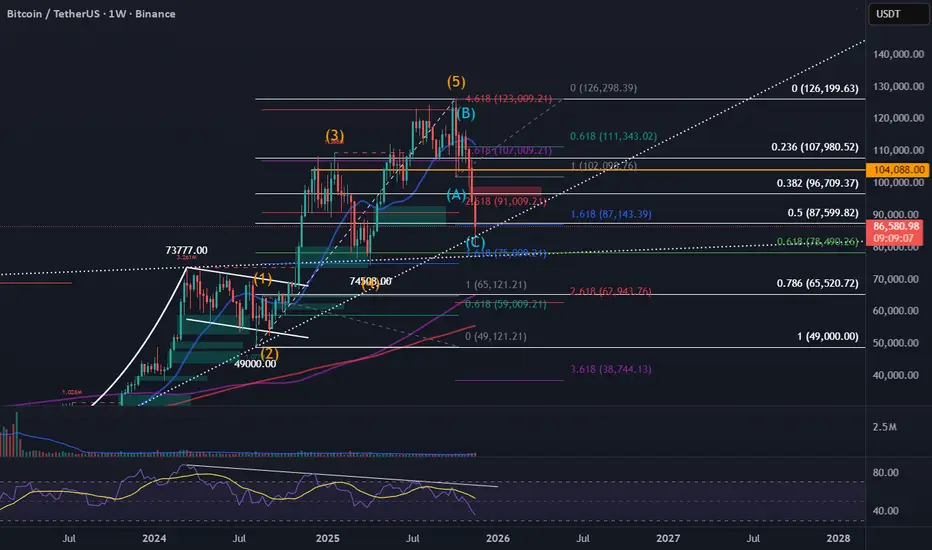
Bitcoin Macro Wave Count – Deep ABC Correction Into Key Fib SuppThis chart provides a long-term Elliott Wave and Fibonacci confluence analysis for Bitcoin on the weekly timeframe.
After completing a full 5-wave impulsive structure, BTC appears to have entered a corrective ABC pattern, with Wave (C) extending sharply into major support levels. Current price action is testing a powerful cluster of Fibonacci retracements and extensions, including the 1.618, 0.618, and a long-term ascending trendline.
Expection: weekly candle closing above 87,143 and go upwards.


Next Move Bitcoin Is 72.5K the Reversal Zone ?BTCUSD is still evolving inside a W-X-Y-X-Z complex corrective structure which is typical after a strong bullish leg this formation indicates that the market is still correcting but without showing any signs of a deeper bearish reversal
Based on my analysis Bitcoin seems to be targeting the $72,500 level which aligns with
A major liquidity zone
A relevant harmonic extension
The probable completion area for wave Z
A historically significant dynamic support zone
If price reaches this level and reacts with clean bullish signals rejection, divergence, momentum recovery this could mark the end of the corrective pattern and trigger a new bullish impulse
As long as BTC stays above major support levels the mid-term bullish structure remains intact.
I am closely watching the $72,500 zone as the key level where the correction might end and upside continuation could begin

BTC/USDT Building an Early Base, High Chance to Retest 93K-108+BTC/USDT — Building an Early Base, High Chance to Retest 93K → 108K+
Bitcoin is forming a stabilization zone between 80K and 93K, which could mark the start of a deeper recovery phase. The recent bounce off the lower boundary suggests that buyers may be re-entering, setting up a potential long-term trend shift.
Key Technical Points:
📉 Support Zone: The lower range around 80.6K has held, showing strong demand at these levels.
🔁 Current Structuring: BTC’s price action shows a gradual range build — this isn’t just a short-term bounce, but a possible formation of a base.
🎯 First Upside Target: A clean breakout above 93K would signal renewed strength and is likely to trigger further buying.
🚀 Extended Target Potential: If momentum confirms and volume supports the move, BTC could aim for the 100K+ region. This would align with a multi-wave recovery to reestablish higher long-term structure.
Trade Outlook:
Holders: This could be a key accumulation setup — building on strength around the base may pay off if the breakout runs.
Short-term traders: Watch for a breakout above 93K with volume as your trigger for re-entry or scaling in.
Risk: If BTC fails to reclaim 93K decisively, a retest of the 80K base is still possible.
Summary:
There’s a realistic and structurally sound scenario where BTC could recover from this base and push toward 93K, with a strong shot at going 100K+ if the breakout materializes. Conditions are setting up for a potential multi-wave uptrend, but confirmation will be critical.

BTC Bitcoin Bear Market If you haven`t bought BTC before the recent rally:
Historically, Bitcoin has shown a tendency to retrace in December before starting a recovery around March. This pattern could repeat this season, with BTC facing selling pressure as year-end portfolio rebalancing and macro uncertainties weigh on the market.
While a brief Santa Claus rally might provide temporary relief, the bearish trend is expected to dominate until March. By then, BTC could trade below $84K before regaining momentum, aligning with its historical recovery trend as market conditions stabilize in spring.

#BITCOIN #BULL MARKET # BEAR MARKET LONG TERM OUTLOOK PROJECTIONHere we have another BITCOIN view into the future, going from 2024 to late 2025 early 2026 check out my previous prediction of the BTC AMAZON chart I posted back in 2021, that played out perfectly until the talk of #BTC #ETF as that was never baked into the previous long term prediction. With that taken into account here we are with a brand new long term projection for Bitcoin, covering #bull and #bear market predictions with time frames running through to 2026.
Please share and comment we expect the usual NEVER, cant happen, wont happen, remarks, but play fair and lets see where this chart plays out first before taking a huge dump on it.
Thank you for taking the time to view my charts.
See the previous chart we published in May 7, 2024

What to expect from BTC?BTC took liquidity from April, tested the lower boundary of the ascending channel, and immediately bounced. Historically, such touchdowns have triggered growth cycles.
A head and shoulders formation is more likely. A triple top is less likely. These structures allow shorts to accumulate liquidity at the $100,000 and $110,000 levels.
Wave theory also fits: a rebound from the lower boundary could form an A-B wave into the right shoulder area, which coincides with the length of the bullish flag pole.

BITCOIN:LIVE TRADEHello friends
considering the decline we had, the sellers made a bottom and the buyers came in. The sellers again broke the previous bottom with strength and made a bottom, and the buyers came in and raised the price and succeeded in hitting a higher ceiling.
And in the pullback, the open price is supported and here we can enter a buy transaction considering the support of buyers and hitting a higher ceiling, of course with risk and capital management and be careful not to make emotional decisions.
*Trade safely with us*

Retracement To Original ConsolidationWe are Bearish in BTC but This Move We have Take Buy Stops Liquidity To Expand bearish
~Price Is Seeking SSL/1M/1W
~+OB Is Pd Area Entry

BTCCRYPTOCAP:BTC can easily pump from here. We are sitting right on a key support level and the last time price tapped this zone it was followed by a new ATH. Structure looks strong enough for another major upside move if this level holds.

BTCUSDTBitcoin could correct to $65,000 and then resume its upward trend, potentially rising to the $700,000 range.
Hassanhosseinzadeh

BTC Volatility Is Spiking — And 5/7 Times That Meant a Market DrBitcoin volatility ( DERIBIT:DVOL ) is rising sharply again — and historically, that’s rarely a neutral signal.
When we look back at recent market behavior, the pattern is clear:
🔹 5 of the last 7 volatility spikes happened during corrections
Each major volatility surge aligned with:
aggressive liquidations,
forced unwinding of leverage,
or the start of a broader market pullback.
Not every spike triggers a crash…
but most crashes start with a volatility spike.
🔹 Why this matters now
Volatility is picking up while price momentum weakens — the same dynamic that preceded previous drawdowns.
This usually reflects:
stressed long positions,
risk being repriced in options,
and rising uncertainty across the market.
🔹 What history suggests
When volatility returns aggressively, Bitcoin tends to enter:
a sharp flush lower, or
a sustained corrective phase.
Given that 5 out of the last 7 spikes led to significant declines, the probability that BTC is entering another corrective leg should not be ignored.

Potencional Long ReactionsBtc made the expected short after 3 hits in the deviation, usually after the upper deviation the opposite is made, that's the last zone according to me for short, around 60k, in between there will be a long reaction

BTC UPDATEIn the previous technical update, when everyone was talking about a rally, I had warned that a drop to 82,000 was likely not out of reach. But if I'm honest, I didn't expect such a drop without a correction.
All support areas are on the verge of being lost one after another.
Absolute fear has gripped the market.
What I expect is for the market to find support from these areas and find itself, otherwise it is not far from reaching lower numbers.

SELL NOW TO 83K ON BTCUSD!!!!BTCUSD completed my last recent post analysis with 10,000pips today we have price rejecting off the inside bar supply region with a bearish rectangular pattern formed am in on another sell here holding till 83k is completed......

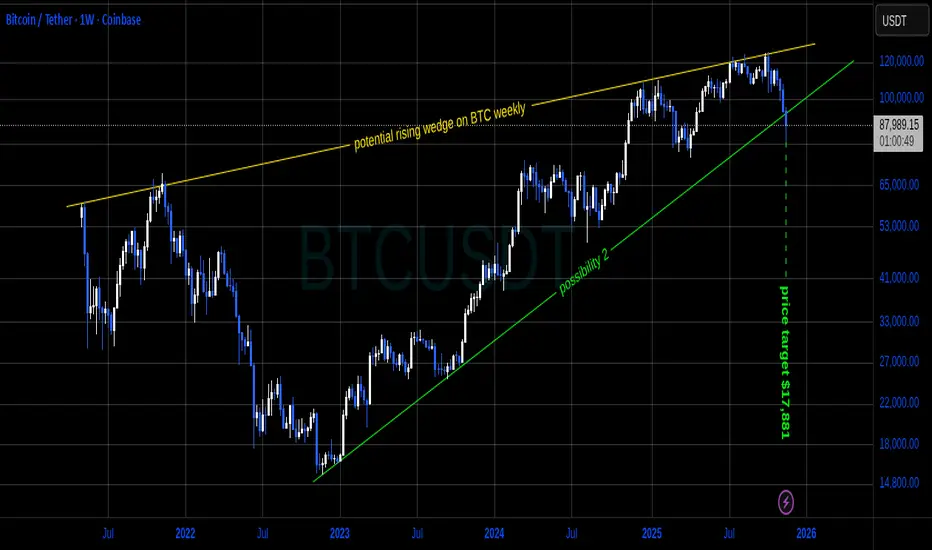
Update on a post I made Nov. 11thMy opinion on the matter still hasn't changed. This is only an idea. Do I believe this is going to play out this way? I have no idea. It for sure could though so still something to keep in the back of your mind. The weekly candle will be closing in roughly an hour. Closing at current price would indicate a clear breakout from the chart pattern and actually locking in a potential (sickening) price target of $17,881 USD per BTC. I'll be keeping this chart as is and post updates from time to time to see if this very large time frame chart pattern plays all the way out.
On a side note, I do not have any trades open based on this pattern breaking down. Nor do I plan to either. Just following this purely for educating myself and anyone else who might gain anything from it.