Potencional Long ReactionsBtc made the expected short after 3 hits in the deviation, usually after the upper deviation the opposite is made, that's the last zone according to me for short, around 60k, in between there will be a long reaction
Trade ideas

BTC UPDATEIn the previous technical update, when everyone was talking about a rally, I had warned that a drop to 82,000 was likely not out of reach. But if I'm honest, I didn't expect such a drop without a correction.
All support areas are on the verge of being lost one after another.
Absolute fear has gripped the market.
What I expect is for the market to find support from these areas and find itself, otherwise it is not far from reaching lower numbers.

SELL NOW TO 83K ON BTCUSD!!!!BTCUSD completed my last recent post analysis with 10,000pips today we have price rejecting off the inside bar supply region with a bearish rectangular pattern formed am in on another sell here holding till 83k is completed......

Bitcoin 30/31% drop then reversal We have seen this kind of drops from top to 30% drops which marks the bottom.
Hope then we can see reversal in crypto market.
New ath is programmed in Btc don't panic sell.

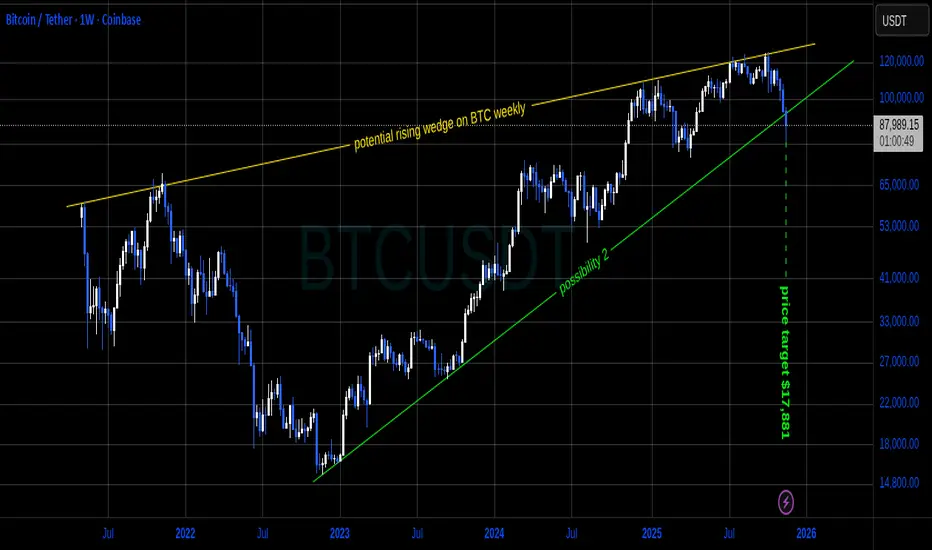
Update on a post I made Nov. 11thMy opinion on the matter still hasn't changed. This is only an idea. Do I believe this is going to play out this way? I have no idea. It for sure could though so still something to keep in the back of your mind. The weekly candle will be closing in roughly an hour. Closing at current price would indicate a clear breakout from the chart pattern and actually locking in a potential (sickening) price target of $17,881 USD per BTC. I'll be keeping this chart as is and post updates from time to time to see if this very large time frame chart pattern plays all the way out.
On a side note, I do not have any trades open based on this pattern breaking down. Nor do I plan to either. Just following this purely for educating myself and anyone else who might gain anything from it.
LongAccording to the analysis of the waves and the help of the Gann method, it can be expected that the price will return to the green zone again.
This is my personal opinion. Please don't use it as your trading criteria. Good luck

BTC market snapshotRight now we’re testing the 78–82k zone. The trend reversal is obvious — both MA and MACD signaled it earlier. At the moment, I don’t see a clear buy signal, but there’s no clean sell signal either.
The next strong support level is around 70k — we had a 60–70k range there, so if we retest it, there’s a chance for a bounce. For now, the current price level doesn’t look convincing for the bulls.
On the lower timeframes, we have strong oversold conditions, which increases the probability of a pause, some sideways movement. I’m not rushing into longs — I want to see more confident long signals first.

BTC - UPDATE - PERFECT!!! Every week I share my #Bitcoin outlook, & almost 9 times out of 10 it's literally a copy/paste of my view🔥
Here we are! $ 88,000 support ✅
Following my analysis, this is the biggest demand zone is in! 🎯
🟥Is the bear market starting?
🟩Or will a new ATH begin from this low?
Follow to not miss any weekly #BTC outlook!

BTC ShortBTC is making bear flag in 1H chart and I believe it will go up to 79500 in the coming days. It's not financial advice, it's just my own analysis.
Details are at the chart

Bitcoin trend analysis!Bitcoin remains in a pronounced daily downtrend with persistent lower highs and lower lows, reflecting strong bearish momentum. The price is now targeting major support zones near 78,250 and 60,300. There is currently no indication of reversal; a sustained move above support would be necessary to suggest any bullish recovery. Until then, momentum and trend bias remain decisively bearish.

The final stage for BTC Just what if....hard to adjust by timing! Because macro to much affect the sp500/ gold and crypto. But just an idea
Probably global plan about 139k like a top for Bitcoin still relevant in October / November BYBIT:BTCUSDT.P

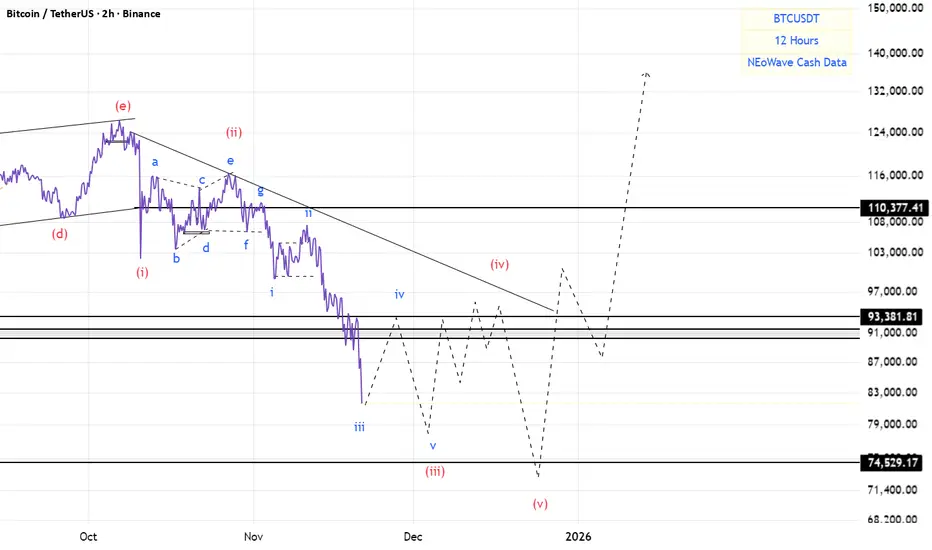
BTC(based on NEo wave)This branch has impulsive structure.
so why now there is an impulse wave here?
because this 5 waves are wave (c) of a flat.
when this 5 wave finished strong bullish wave will start.

Will this date come true?This is not fundamentally unbelievable, especially with the manipulation of governments in the crypto market
What is completely clear to us activists is the manipulation of absurd markets with great temptation by the yellow-haired doll and the child politicians and child killers around him.
Although I am not active in this market, I feel sorry for you, despite this cesspool soaked in the blood and hearts of the people of the world!
These numbers may not be realized, but the much blood that has been spilled on the ground will rise and the consequences will drown it.
The freedmen will definitely win.
And I must say, this analysis may expire after a while:
Good luck
MJ.REZAEI

Short-Term Sell Into Wave 4, Then Massive Long-Term BuyBTCUSD on the weekly timeframe is completing a major Elliott Wave 3 top, with price now correcting downward toward the projected Wave 4 demand zone around $58,000 – $62,000.
This aligns with the long-term ascending channel that has guided Bitcoin’s structure since the 2020 lows.
The chart shows a clean 5-wave structure forming, with Wave 4 expected to be the final deep correction before the next major bullish cycle.
SHORT-TERM TRADE IDEA: Sell Into Wave 4 Correction
Bias: Short
Reason: Breakdown from Wave 3 high + correction toward Wave 4 demand
Entry Zone:
$84,000 – $88,000 (current corrective bounce zone)
Targets:
TP1: $72,000
TP2: $62,000
Final Target (Wave 4 Low): $58,000
Stop Loss:
Above $92,000 (protect against bullish continuation)
Short-Term Notes:
Structure shows lower-timeframe bearish imbalances.
Expecting ABC correction to complete Wave 4 inside the purple demand zone.
LONG-TERM TRADE IDEA: Buy Wave 4 for Wave 5 Mega Rally
Bias: Long (swing/position trade)
Reason: Wave 4 completion + re-entry into the major ascending channel
BUY Zone (High-Probability):
$57,000 – $63,000 (golden pocket demand + channel support)
Long-Term Targets (Wave 5 Projection):
TP1: $100,000
TP2: $120,000
Final Wave 5 Target: $150,000 – $160,000
Stop Loss:
Below $45,400 (invalidates Wave 4 structure)
Long-Term Notes:
Weekly structure remains extremely bullish.
Wave 5 historically produces BTC’s strongest parabolic expansion.
Risk-to-reward ratio is exceptional (10R+).

BTC Dips Below Key Zone — Is $73K the Next Stop?$BTC/USDT has broken below the support trendline and the key support zone.
The next major support to watch is around the $73K level.
DYOR, NFA

Bitcoin - Will it take the liquidity at $98.000?Bitcoin (BTC) has shown a clear downward price structure in recent days.
After a period of sideways movement and attempts at recovery, selling pressure has once again become dominant, resulting in a sharp decline toward key liquidity zones.
4h Bullish FVG Inversion
BTC has just failed to hold the 4-hour bullish FVG and has closed below it, which now acts as resistance (inversion). This opens the path toward lower levels, and the likelihood of a continued decline remains high. The bulls are currently struggling to regain ground.
Liquidity Sweep
During the most recent session, a liquidity sweep occurred, with the price dipping below previous lows and triggering many stop-losses and sell orders. Although such a move often leads to a technical bounce, overall sentiment remains bearish. The remaining liquidity below the major low around $98,000 continues to create selling pressure and could lead to further downside.
Conclusion
Despite the recent liquidity sweep, there is still no convincing bottom in sight, and downside risk continues to dominate. As long as BTC trades below the 4h FVG inversion and bearish momentum persists, a move toward $98,000 remains the most likely scenario within the current technical outlook.
-------------------------
Thanks for your support. If you enjoyed this analysis, make sure to follow me so you don't miss the next one. And if you found it helpful, feel free to drop a like 👍 and leave a comment 💬, I’d love to hear your thoughts!

#BTCUSD #Bitcoin Buy Setup🔼#BTCUSD #Bitcoin #Crypto Buy Setup
Currently Trading At 88564 , Buy On Dip Around 85916 And More Only At 83571 If Comes for The Target 95380—-104400

BTC 30% Pullback: Local Floor is inBTC now at "Golden Pocket" Retracement Level:
The fact that a 30% pullback is coinciding with a Golden Pocket Fib Retracement paired with the current Macro conditions makes Long BTC at this level an asymmetrical bet.
Math / structure of the move
0.618 is the golden ratio, and 0.786 is roughly its square root – both come directly from the Fibonacci sequence. A pullback into 61.8–78.6% is deep enough to shake out weak hands and run liquidity, but not so deep that it fully invalidates the prior impulse. That makes it a natural “last chance” zone for trend continuation.
Orderflow & crowd psychology
A lot of traders, bots, and educational content focus on 0.618 / 0.786 as “golden pocket / OTE” style zones, so limit orders, stop orders and algorithms cluster there. In crypto, where retail TA is everywhere, this becomes self-fulfilling: price often spikes into 0.618–0.786, sweeps stops, then reverses.
Sneak Peak of the HTF Indicator I am developing for the upcoming launch of Glitch Capital . A multi-timeframe breakout- and trend-following Indicator Suite I will be launching soon.
Here you can see the Glitch Sniper Algo firing the first Buy Signals since this latest pullback. This is a sneak peak of another Indicator from the Glitch Suite I will launch soon:
30% drawdowns are normal in Bitcoin bull markets, not rare “black swans.”
A near perfect 30% pullback from ATH during a Bull Market is a known Phenomena during Crypto Bull Markets
Here’s how it looks historically:
2013 bull market: At least two 30–40% corrections on the way up.
2015–2017 bull market: Study of this cycle shows “at least nine large drawdowns” with an average correction of about 37% from peak to trough. Community analysis of the 2017 leg alone often highlights ~6 separate ~30% dips between 2016–2017 before the final top.
2011–2021 overall: About 13 drawdowns of more than 30% across that decade (bull + bear), underlining how routine deep pullbacks are in BTC.
Glassnode / market analysts: Repeatedly describe 30–40% corrections as “typical” in BTC bull markets, i.e. part of a healthy uptrend rather than a trend-break by default.
If you compress that into a rule of thumb:
In a strong Bitcoin bull cycle you can easily see several pullbacks of ~30%+, roughly every few months. So when you see a ~30% dip in a confirmed bull market, historically it’s been common and often buyable, not an automatic end-of-cycle signal.

Bitcoin - New falling wedge! (no one talks about, must see)Bitcoin is forming a brand new falling wedge pattern no one really talks about! This falling wedge pattern is not complete, and it will take another week to see the whole pattern, but what we see now is the first skeleton of the pattern. Of course this is great because we can enter a short position on futures and speculate on the price decrease!
What is very interesting is that inside the falling wedge pattern we have a symmetrical triangle. This triangle recently broke down, and we saw a massive drop, but now the price is recovering, and soon we may see a retest of the triangle. That's also a great opportunity to short Bitcoin!
Currently Bitcoin is going up, but to me this is just a temporary pullback. I am pretty bearish, and I think we are going to go down! There is still an untested 2024-2025 trendline, so I expect Bitcoin to hit this trendline this or next week. I think this could be a good idea to open a long position if this happens.
What is the plan for November? I think Bitcoin is bearish, and we are going to hit 98k later this month. A lot of people may start to think that the bottom is in and that Bitcoin will go to a new all-time high; I disagree with this idea. I think there is more downside for Bitcoin.
Write a comment with your altcoin + hit the like button, and I will make an analysis for you in response. Trading is not hard if you have a good coach! This is not a trade setup, as there is no stop-loss or profit target. I share my trades privately. Thank you, and I wish you successful trades!

BTC DECODED ANALYSIS REMINDER UPDATES BTC decoded analysis next support, Monthly support is noted at $68,021.7 before BTC tests the quarterly support at $62,772.02.
These supports were updated on Binance on May 27th, 2025, with a brief detailed reminder updated again on October 29th, 2025.
These decoded analysis details are also mentioned in my pinned post.
All my analysis is based on actual fact based skip supports with no predictions.
This message is for educational purposes only, Always DYOR.

BTC in a bear marketBTC Price Outlook: Potential Decline Toward 85K
Bitcoin (BTC) is currently showing signs of potential weakness, with technical indicators suggesting a possible retracement toward the 85,000 level. This zone may act as a key support area if bearish momentum continues. Several factors contribute to this outlook:
- 📉 Momentum Shift: Recent price action indicates slowing bullish momentum, with lower highs forming on shorter timeframes.
- 📊 Volume Analysis: Declining volume during upward moves suggests a lack of strong buying interest, increasing the probability of a pullback.
- 🧠 Market Psychology: Traders could be locking in profits after the recent rally, leading to increased selling pressure.
If BTC approaches the 85K level, it will be crucial to monitor how price reacts—whether it finds support and consolidates, or breaks lower toward deeper retracement zones. Risk management and confirmation signals remain essential in navigating this setup.

BTC: Bearish Breakdown From ChannelHi!
Bitcoin has broken decisively below the rising channel that has guided price for months, marking a significant shift in market structure. This breakdown aligns with a completed Head & Shoulders pattern, where price failed to hold the right shoulder area and continued lower, confirming bearish momentum.
With the channel support lost and no meaningful bullish reaction on the retest, sellers remain firmly in control. BTC is now heading toward the next major horizontal support around $88,900, which is the key level highlighted in the chart.
Unless buyers reclaim the broken channel support with strong conviction, the path of least resistance remains to the downside.
