BTC in a bear marketBTC Price Outlook: Potential Decline Toward 85K
Bitcoin (BTC) is currently showing signs of potential weakness, with technical indicators suggesting a possible retracement toward the 85,000 level. This zone may act as a key support area if bearish momentum continues. Several factors contribute to this outlook:
- 📉 Momentum Shift: Recent price action indicates slowing bullish momentum, with lower highs forming on shorter timeframes.
- 📊 Volume Analysis: Declining volume during upward moves suggests a lack of strong buying interest, increasing the probability of a pullback.
- 🧠 Market Psychology: Traders could be locking in profits after the recent rally, leading to increased selling pressure.
If BTC approaches the 85K level, it will be crucial to monitor how price reacts—whether it finds support and consolidates, or breaks lower toward deeper retracement zones. Risk management and confirmation signals remain essential in navigating this setup.
Trade ideas

TradeCityPro | Bitcoin Daily Analysis #222👋 Welcome to TradeCity Pro!
Let’s dive into the Bitcoin analysis. Today is Sunday, the last day of the week. Let’s go over the triggers and scenarios for the upcoming week.
⏳ 1-Hour Timeframe
On the 1-hour timeframe, after a bearish leg, Bitcoin has now reached the 94,335 level and formed a range box between 94,335 and 96,476.
📊 Volume has naturally decreased over the past few days due to the weekend and the price correction.
🔭 Today, the market could make a move during the New York session, and we can better assess this by looking at volume trends.
🧮 If, near the New York session or during it, volume starts to increase, we can expect the market to make a move.
📉 For a short position:
The first trigger is at 95,212. The main trigger for the start of a new bearish wave is 94,335.
⚖️ If you already have an open position and your account is in profit, it might be worth taking the risk and entering earlier with the break of 95,212. However, if your account is at a loss, I recommend waiting for the 94,335 trigger to activate.
🚀 For a long position:
It’s better to wait for the current bearish momentum to subside and for the market to become bullish. But, if you want to make an early entry, the 96,476 trigger might be a decent option.
💡 Personally, I will wait for the price to form a higher high and higher low above 96,476 before pursuing a long position.
❌ Disclaimer ❌
Trading futures is highly risky and dangerous. If you're not an expert, these triggers may not be suitable for you. You should first learn risk and capital management. You can also use the educational content from this channel.
Finally, these triggers reflect my personal opinions on price action, and the market may move completely against this analysis. So, do your own research before opening any position.

Bitcoin Downtrend Continues: Bearish Target at $93,500Bitcoin is trading in a clear downtrend channel, repeatedly rejecting the trendline after liquidity sweeps. Support zones above have already been broken and retested as resistance, signaling bearish momentum. Price is currently consolidating near the lower channel, with a potential drop toward the target zone around $93,500.

Bitcoin Analysis – November 21 | We Ride the Winner!Good morning everyone! Let’s jump straight into today’s BTC analysis.
But first… a quick lesson I’ve learned recently:
📌 We don’t predict the market — we prepare for scenarios and react.
Trying to guess the future only puts us behind. Our job isn’t to fight buyers or sellers…
We simply wait for them to finish their battle — then ride with the winner. 🚀⚔️
With that mindset, let’s break down the main possible scenarios:
🟥 Scenario 1: Market Continues Under Sellers’ Control
On the daily and 4h timeframe, the trend is clearly bearish:
Lower highs & lower lows
Increasing selling volume
As long as the structure keeps printing lower highs/lows, the logical play is to follow sellers — waiting only for a clean trigger.
We’ve recently tapped into the $85K zone, but my line is outdated (drawn months ago).
I need a fresh reaction from this support area to validate it.
⏳ So I’m not shorting yet.
I’m waiting for a reaction — likely sometime this weekend when global markets are quiet — and then I’ll look for a short trigger.
⚠️ Right now is NOT a short entry for me.
Patience first. Trigger next.
🟩 Scenario 2: What if BTC jumps straight to $93,500?
Nothing changes for me.
As long as sellers dominate, I’m not opening any long on Btc.
Before considering a long position, I need:
At least one equal high + equal low (neutral structure)
And ideally a break into higher highs and higher lows
Until that happens — no longs for me.
🟦 Scenario 3: Range Formation
If the market ranges inside this zone, my short may get stopped out.
But honestly… that’s fine.
A range often builds a strong structural base — and once the direction becomes clear, I’ll simply follow the confirmed trend.
📌 Final Note
Please don’t underestimate risk management and capital preservation.
These scenarios help us stay objective — but discipline is what keeps us alive in the long run.
Thanks for reading my analysis!
Wish you all a great and profitable day. 🚀✨
I came back stronger and more powerful than ever.
Prepare yourself for big drops as the uptrend is weaker and the weakness in the trend is quite evident.

BITCOIN: A TALE OF EXHAUSTED BULLSmart money tends to accumulate heavily when sentiment is at extreme fear, signaling belief in a rebound. It is often correct, though not consistently.
Much of the pessimism appears to be fully priced in at this point. Thus, a bullish scenario remains technically possible, although broader conditions still align with a bear-market environment.
Let's see.

BTC longIn the long zone, I am taking a BTC long. The long zone is the weekly support zone. The long position is valid for me as long as we don't fall and close a weekly candle below the weekly zone.
Entry: $83,175
TP: $91,200
SL: $79,760
RRR: 2.34"

Bitcoin Hit $126,199 I Warned It Was the Top While Others Call..When Bitcoin surged to $126,199, nearly every major voice on social media was calling for the next leg up toward $200,000. I wasn’t one of them. While the hype machine kept pushing bullish narratives, I publicly warned that the move looked exhausted and that we were likely witnessing the cycle top.
Now, the chart is proving that call right.
Key Levels Are Breaking
Since topping out, Bitcoin has fallen below several major support levels — including the critical $95,000 zone. The technical structure has shifted decisively:
Trend has turned downward
Momentum has weakened
Sellers are dominating volume
Price continues to make lower lows
This is not what a path to $200K looks like — this is what a post-top correction looks like.
How Low I Believe Bitcoin Can Drop
Based on the current trend, market structure, and historical behavior after previous peaks, these are the realistic targets I’m watching:
$89,000 – initial support already under pressure
$83,000 – a major demand zone
$76,000 – deeper correction range
$58,000 – full cycle flush if panic accelerates
These levels aren’t guesses. They’re grounded in technical analysis and the same signals that helped me call the top at $126K.
I Went Against the Crowd — And It Paid Off
While most influencers kept telling their followers to buy, I warned that the upside was limited and that a sharp reversal was coming. The market is now validating that call.
My Outlook
Bitcoin is still the dominant asset in the crypto market, but the current pattern suggests more downward pressure before any meaningful recovery. For the trend to flip bullish again, price would need to reclaim key levels and break out of the descending structure.
Until then, the chart continues to follow exactly what I warned about:
The top was in at $126,199 — and Bitcoin was never going straight to $200K.
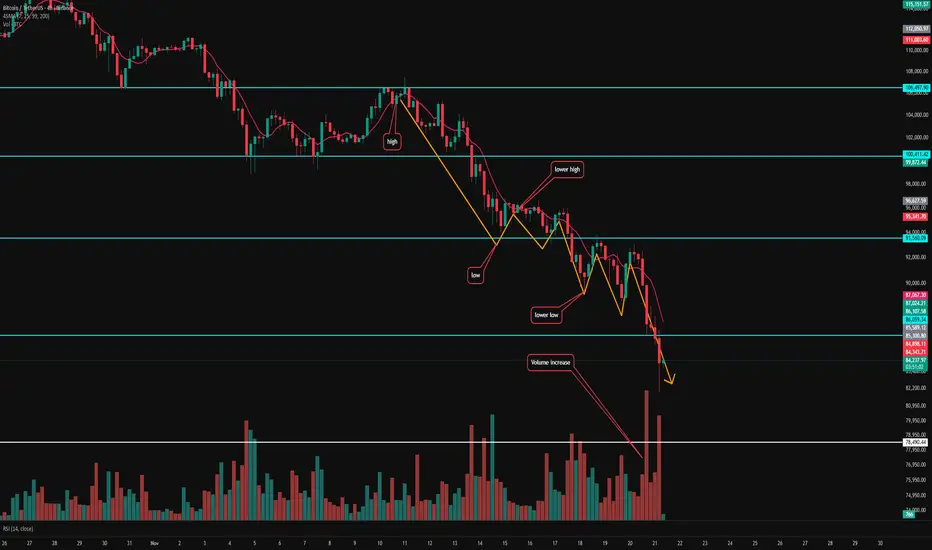
BTCUSDT.P - November 20, 2025The chart shows a clear downtrend marked by descending highs and lows, with price currently heading near a key horizontal support around the 88,000 level. A descending trendline acts as overhead resistance, while the shaded area near 92,000 represents a notable resistance zone. Price action suggests two possible outcomes: a bearish breakdown below support could extend the decline toward 85,000, while a successful breakout above the trendline may trigger a reversal toward 92,000 resistance. Momentum currently favors the bears as the market retests support after sustained selling pressure.

Bitcoin - trend is down. New trade is afterBitcoin - trend is down. New trade is after
clear consilidation or coming back into new local value

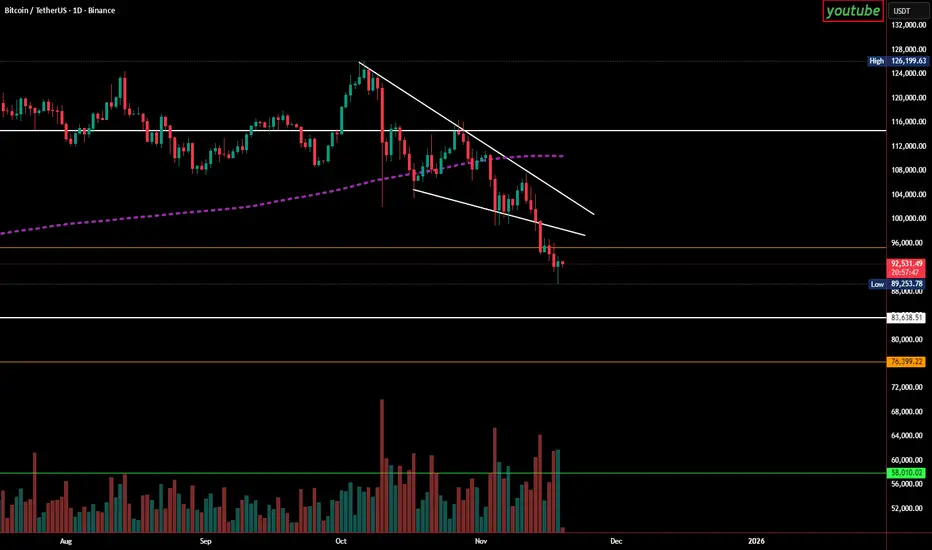
$BTC - Market UpdateBINANCE:BTCUSDT | 1D
In our November 12 outlook, we noted that if price formed another lower high and failed again below the 107k resistance, momentum could fade quickly. That scenario played out: Bitcoin broke below the 102k support and slid into the 89k zone.
From here, if the current low holds, the next area that must be reclaimed is 92–93k. Buyers need to step in, a move back below this level increases the risk of a breakdown toward the 84k–82k region.
If price can stabilize and build a base here, upside hurdles to watch are 96–97k, followed by 100k and 107k (swing point)

BTCUSDT Market Analysis UpdateHi everyone, I hope you are doing well and I have put my opinion in Bitcoin price on the chart for you. and hope this helps you! Simple, concise, useful
BTC is still trading within a clear bullish market structure, supported by strong HL formations and trendline confluence. At the moment, my main focus is on the Fair Value Gap (FVG) below current price. I expect BTC to revisit this imbalance before continuing the move upward.
The liquidity pool around 82,490 is also important. Personally, I don’t expect price to sweep that level immediately. However, if it does get taken, in my view it would likely serve as the final liquidity grab before resuming the broader uptrend. This makes 82,490 a key level to watch — either it remains untouched while we push higher, or if price sweeps it, the move could act as fuel for the next bullish leg.
From a higher timeframe perspective, the market remains bullish. The structure is intact, RSI is holding mid-range without major bearish divergence, and trendline support has not been broken. Volume also supports this idea — it’s decreasing and showing divergence, but this doesn’t signal a reversal, only a healthy consolidation while holding the bullish trend.
In summary:
Main target: fill the nearby FVG before continuation.
Key liquidity zone: 82,490 (less likely to be taken now, but if it happens, I consider it the last liquidity grab).
Bias: still bullish, expecting higher levels once short-term imbalances are resolved.
Weekly:
As long as BTC holds its HLs and respect the FVG zone, I continue to look for upside continuation — potentially well beyond current levels.
That’s my current view on BTC. Let me know your opinion below 👇
Best regards

Bitcoin Technical Analysis and Price forecast. Bitcoin has formed a falling wedge chart pattern that is a bullish reversal chart pattern, Following this down trend since November 9 and has retest the support price level yesterday at $800,600.
The weekend pump is really expected due to the highly over sold indication on trading indicators.
The daily Relative strength Index (RSI) is at 22 in oversold zone. Moving Average Moving Average Convergence Divergence on 4hr timeframe indicating a short rally is ahead.
Bitcoin can retest the resistance price level $880,000 today. however a decline from R1 can result in again fall of price near $840,000.


Bitcoin’s Drop From $125K: A Healthy Correction?The recent decline is largely a correction after BTC’s massive rally from $17K (Oct 2023).
Based on Fibonacci levels, the next key supports sit at $85K, $70K, and $60K — with $70K looking especially strong to me.
And yes… Bitcoin is officially 4-digit again.
#Bitcoin #BTC #CryptoAnalysis #Fibonacci #CryptoMarket

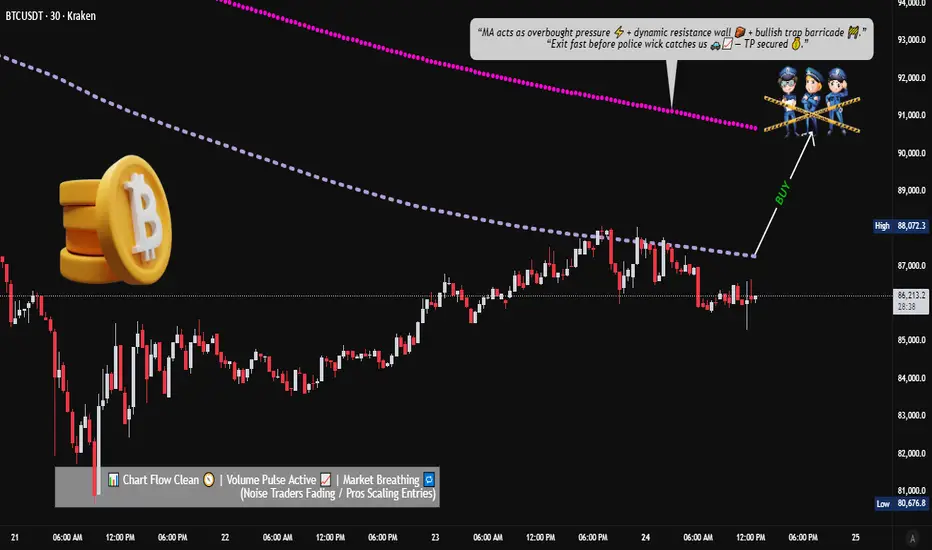
Bitcoin MA Breakout Setup: What Traders Should Watch Now📈 BTC/USDT – “BITCOIN VS TETHER” | Crypto Market Opportunity Blueprint (Day Trade)
🔥 Bullish Breakout Roadmap for Active Day Traders
🧭 PLAN:
Price is attempting a bullish breakout above key moving averages. Once price clears $88,000, momentum buyers may step in and drive a continuation leg upward.
🎯 ENTRY (Breakout Confirmation):
▶ Enter at any price level AFTER a clean moving-average breakout above $88,000.
Look for strong candle closes + volume expansion.
🛑 STOP–LOSS (Risk Management First):
⚠️ This is MY thief-style SL: $84,000
Dear Ladies & Gentlemen (Thief OG’s) — manage your own risk according to your playbook.
This is only my SL, not a rule. You’re free to adjust based on your own risk appetite.
💰 TARGET:
Moving averages align as a dynamic resistance zone, combined with overbought conditions and potential bull-trap signals.
Secure profits responsibly.
▶ Target: $90,800
Again — Dear Ladies & Gentlemen (Thief OG’s), this TP is MY personal level.
Book profits your own way, at your own risk.
🔍 Related Crypto Pairs to Watch (Correlation + Key Notes)
1️⃣ ETH/USDT (Ethereum)
Highly correlated with BTC in bullish phases
Strong ETH movement often front-runs or confirms BTC breakouts
Watch for ETH strength → may add confidence to BTC breakout trades
2️⃣ BTC.D (Bitcoin Dominance)
Rising BTC dominance = Capital flowing into Bitcoin → Supports bullish continuation
Falling dominance = Altcoins gaining share → BTC breakouts may weaken or turn choppy
3️⃣ TOTAL / TOTAL2 (Crypto Market Cap Charts)
Confirms whether capital is entering the entire crypto market
TOTAL rising with BTC strength = broad market confidence
TOTAL flat/dropping during BTC’s rise = possible bull trap
4️⃣ SOL/USDT (Solana)
Solana often moves aggressively when BTC breaks out
Sharp SOL rallies can signal strong risk-on momentum across majors
5️⃣ USDT.D (USDT Dominance)
When USDT dominance drops → Traders moving out of stablecoins → Bullish risk appetite
When it spikes → Smart money hedging → BTC breakout may fail
6️⃣ BTC/USDT Perp Funding Rate
Positive & increasing funding = heavy long side → Potential squeeze
Neutral funding = healthy breakout
Negative funding = breakout might be fueled by short covering
📊 Market Tone:
BTC continues to show strong buyer interest, but resistance pockets remain.
Trade mechanically. Don’t chase candles. Let structure confirm itself.
BITCOIN:LIVE TRADEHello friends
considering the decline we had, the sellers made a bottom and the buyers came in. The sellers again broke the previous bottom with strength and made a bottom, and the buyers came in and raised the price and succeeded in hitting a higher ceiling.
And in the pullback, the open price is supported and here we can enter a buy transaction considering the support of buyers and hitting a higher ceiling, of course with risk and capital management and be careful not to make emotional decisions.
*Trade safely with us*

Prepare BTC Long
Btc broke important Daily trendline which means market turns into bearish trend
but swing HL still remain and i think this is last chance for long
im waiting sell volume decrease and at least dogi or engulfing candle show up in support zone
Dont make mistake go under 4H timeframe, just stay watch at least daily or higher tf candle

BTCUSDT.P - November 25, 2025Bitcoin is in a corrective phase within a longer-term downtrend, with price recently rejected from the 89,500 resistance area and now trending lower. The chart highlights a short trading range between a defined stop level near 89,500 and a profit level at 85,721, aligning closely to horizontal support and resistance. Current price action and momentum favor sellers, as the market presses toward lower support with weak upward retracement. A break below support could accelerate selling toward the next downside target, while reclaiming resistance might shift bias to a short-term reversal.

Long in short Given the structure of the last 24 hours and the presence of a reversal in the range of 82200 and 85800 to create resistance against this reversal, the price could rise to the area drawn in the image. If you have a short position according to the previous analysis, you can exit and re-enter within the mentioned range.

BTC: Is it possible we are forming HEAD & SHOULDERS on D1 ??If we zoom back a bit on Daily BTC chart we can see it might be possible that we will have another leg formation as a right shoulder for Head and Shoulders pattern.

$BTC Update – Quick & HonestStill bearish on Weekly & Daily.
Only 30-min & Monthly are holding green.
I know trading against higher TF trend is dangerous but here’s why I stayed calm & even bought the dip for members.
1- Weekly bounce zone + Monthly higher low
2- Weekly untested bullish Order Block + dynamic trendline support
Daily close below 83.4–85.6k = real trouble.
Till then → low volume, sideways, waiting for a trigger.
30-min flipped bullish yesterday → I posted free update here instantly.
Exact buy entries, SL & TPs → given in exclusive group.
That’s it. No hype, no bullshit, just levels & logic.

BTC MID TERM LONGWe can still wick to around 70k-ish levels on the weekly but no problem should close the month always above the middle green VIDYA line which currently sits at around 82k, any close below that would invalidate this and almost guarantee the 70k.
I don't believe the "cycle ended 1 year bear markat" narrative that everyone's talking about (yet?). Lots of bullish catalysts are upcoming such as further rate cuts, QT ending, QE starting, stimmy checks from Japan, China and U.S potentially. Global M2 supply increasing, potential gold profit taking and many others.
