BTC – SMC Suite Follow-Up: Liquidity Grab at 116K and the Drop!!BTC – SMC Suite Follow-Up: Liquidity Grab at 116K and the Drop That Followed
This is a follow-up to my earlier idea “ BTC – Liquidity Grab at $116K Before Deep Correction? ” where I highlighted the danger of price trading into stacked SMC levels on the 1D chart.
1️⃣ Quick recap of the original idea
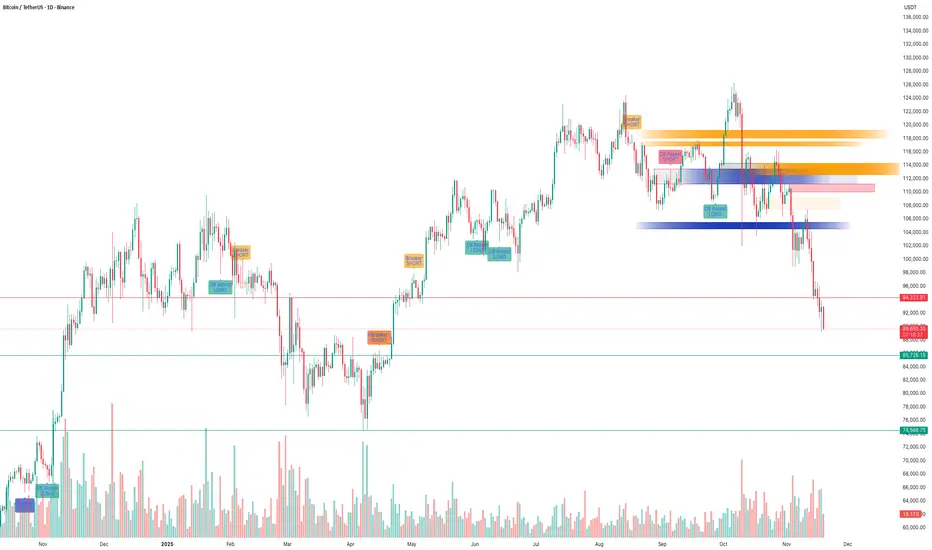
In the previous post, price was trading around the $112K–$116K zone.
Using the SMC Suite on the 1D chart, I highlighted:
• A high-timeframe supply / OB cluster around 116K.
• A liquidity grab above prior highs – price spiked into fresh liquidity sitting above the range.
• A confluence of Breaker + OB Re-test + FVG acting as a “danger zone” for fresh longs.
• The idea that this move could be a distribution / liquidity grab before a deeper correction.
The key message was: this is not a safe place to be aggressive long; watch for rejection and potential downside.
2️⃣ How price reacted afterwards
Since that post:
• Price respected the 116K zone as supply – every attempt to hold above it failed.
• The highlighted OB + Breaker block acted as a ceiling; price consolidated there and then rolled over.
• After losing the mid-range structure, BTC started a trend of lower highs and lower lows , confirming distribution.
• We have now traded all the way down into the d emand / support zones below 92K and then lower , which were also plotted in advance by the same SMC levels.
In simple terms, the area we marked as a “ danger zone for longs ” turned out to be the top of the move before this large downside leg.
3️⃣ What the SMC levels showed well
This move is a nice case study of how the SMC concepts aligned:
• Liquidity Sweep : Price ran above previous highs into fresh liquidity, then failed to hold.
• Breaker + OB Re-test : Former demand became supply; retest of this breaker block rejected price.
• FVG + Imbalance Zones : Upside imbalances got filled and then flipped into resistance.
• Structure Shift : After the rejection, market structure shifted bearish with clean breaks of prior swing lows.
None of this is about “perfect prediction”, but about reading where smart money might be offloading risk and where retail is most vulnerable.
4️⃣ Takeaways & what I’m watching next
• HTF SMC levels matter. When multiple concepts cluster (Breaker, OB, FVG, previous highs), treat that zone with respect.
• Liquidity grabs at highs are great warning signals – especially when followed by a clear structure shift.
• For now, I’m watching how price behaves around the current demand zones and whether we see:
• Strong rejection + reclaim of broken levels (potential swing-long areas), or
• Continuation of lower highs pointing to further downside.
This post is for educational purposes only, not financial advice.
Trade ideas
Bitcoin longEntering long again . I think btc is going to climb higher .Chart is looking good for a potential bounce.

Expecting BTC to grab above liquidity.As the BTC bounce back to the liquidity zones, we are expecting it to take the previous days liquidity. Let see

BTCUSD - 3months : Is a 50% Correction toward 50K on the table?Bitcoin faces a potential three-month corrective phase after tapping 91K. Untested liquidity below 70K and 60K keeps the downside open, making a deeper move toward the 45K demand zone increasingly likely.

BTCUSDT Price Action Bitcoin experienced a sharp decline last week, falling to the $80,000 level before rebounding to close the week around $86,850. The price is currently encountering strong support near $84,000, with bulls aiming to defend this area in the days ahead. If this support fails, subsequent zones to watch include $75,000 and the high-volume region between $72,000 and $69,000. On the upside, the key resistance levels are $91,400 and $94,000, which will need to be reclaimed for bullish momentum to resume.
Technically, several indicators such as RSI are exhibiting oversold conditions, suggesting a potential for a short-term bounce, but overall market sentiment remains bearish following the downside break of a broadening wedge pattern. The medium-term target from this breakdown points toward a possible retest of the $70,000 zone, even if temporary rallies occur above $84,000. High volatility persists, with significant volume and price swings expected as traders react to macroeconomic and regulatory factors influencing the entire cryptocurrency market. The directional index (ADX), stochastic, and moving average metrics all reinforce the presence of a strong downtrend, with any sustained recovery requiring a notable shift in buyer demand above resistance

BTC: Start Going LongAfter experiencing a sharp decline, BTC has now begun to show signs of stopping the fall. It will not see another continuous downward trend in the short term and is gathering momentum waiting for a rise. This is currently an excellent opportunity to buy.
BTC Trading Strategy for Today:
BTCUSDT Buy @ 81000 - 83000
TP: 90000 - 92000
With 15 years of focus on trading, I will provide accurate signals and strategies every day to help you achieve stable profits in the market. Don’t miss the daily analysis.

Bitcoin Report — Is the sell-off over?Short answer: Not proven yet. Price is at a critical support area (≈ 85k–90k) after heavy selling; a bounce is possible but downside risks remain wide if that support fails.
Key technical facts
Current support zone: ~85,000–90,000 — price has bounced here recently and printed notable wicks around 80k during the weekend, showing buying interest. If this holds we may see consolidation in the 80–90k band.
Downside liquidity gap: There’s little on-chain / order-book support between 83k and 75k, so a break of 83k could accelerate a drop toward ~75k quickly.
Brave New Coin
+1
Momentum & structure: Market shows lower highs / lower lows and strong bearish candles—classic continuation structure until proven otherwise. Short-term oversold readings increase probability of a bounce or range, not a clean reversal.
CoinDesk
Fundamental drivers (why traders should care)
ETF flows: U.S. spot Bitcoin ETFs have seen record outflows this month, a big headwind to price (reduces institutional bid). This means less structural support and more sensitivity to risk-off moves.
CoinDesk
+1
Macro (Fed / USD): Market pricing around Fed rate cuts is moving; if expectations for no December cut stick, the USD stays strong and risk assets (incl. BTC) remain pressured. Recent news shows cut probabilities have weakened.
Reuters
+1
Miners / supply dynamics: Recent on-chain signals show miners moving from heavy selling toward more accumulation, which could reduce sell pressure over time — but this is early and not yet decisive.
The Coin Republic
+1
Practical trading plan (two scenarios)
Bullish (probability: conditional):
Condition: Clear double-bottom / strong bullish reversal candle in 85–90k zone + improving ETF flow or weaker USD.
Entry: Scaled longs on confirmed bounce (e.g., reclaim of local resistance).
Targets: 95k → 100k+.
Stop: below the weekend wick low (protect vs fast gap down).
Bearish (higher-probability while structure is bearish):
Condition: Close below 83k or failed bounce (strong bearish candle).
Entry: Short on break and retest or on conviction close below 83k.
Target: ~75k (fast path, low liquidity).
Stop: back above retest level / broken support.
Risks & timing
Weekend liquidity and ETF flow volatility can cause violent moves; use smaller size and wider stops.
Macro surprises (Fed commentary, US data) can quickly flip USD/risk dynamics — always check the economic calendar.
Bottom line: A bounce around 85–90k is plausible and would likely produce a choppy consolidation. But until 83k holds and macro/ETF flows stabilise, the door to 75k remains open. Trade small, wait for confirmation (retests / clean reversal candles), and manage risk tightly.

BTC Retracement - Is it a FAKEOUT? Uh...YES!!!Following up on my analysis of BTC after this weekend and going into this Thanksgiving Week. Please take a look at my previous analyses of BTC after we hit the All Time High to see how I've mapped out this progression to where we are now. We have seen BTC drop down to exactly where we projected....the Weekly Demand Source. And as targeted for our more precise level, it came right down to the top of the Daily Zone of the Weekly Source (~80.6K). Wow! You can't make this stuff up, guys. This is solid thorough Technical Analysis that you too can learn!!!
Well, where do we go from here:
This review is a closer dive down into the Hourly time frame, where I think we have to monitor the prices for the short-term. We have seen a pullback this weekend that pushed us back up to the top of this Weekly Demand Source. That level is going to have strong resistance again, and I expect a rejection back down into this large Weekly zone.
It's important to note this weekend push up, we had an H1 BOS - H1 candle close above 86.4K. I expect that to be retested and see the price possibly bounce between this 86.4 - 88.4K range for a little bit. A close of an H1 candle back below 85.7K will be the sign that it is falling back to the source of this H1 break and back to the Daily Zone of the Weekly Source (80.6K).
Remember, we touched the top of the Daily Zone (80.6K), but I don't think that touch was significant enough. There are a LOT of buyers inside of that Daily Zone, and touching it with a wick is not sufficient from my experience. We need to see at least a 4 Hour Candle go deeper into that zone and see a strong bullish rejection.
When will we go bullish again:
The real sign of the fall being over is going to show up first on the H1, with an H1 BOS outside of that Daily Zone (77K - 80.6K). IF we see that, expect a return to the source of that BOS. From there, the bullish momentum needs to be confirmed on the H4 for the REAL BULL BUY.
For now, the higher time frames are still ruling. The Weekly MUST be satisfied with enough volume and activity within this weekly Source. Until then, again, don't get tricked into buying BTC unless you are short-term trading it.

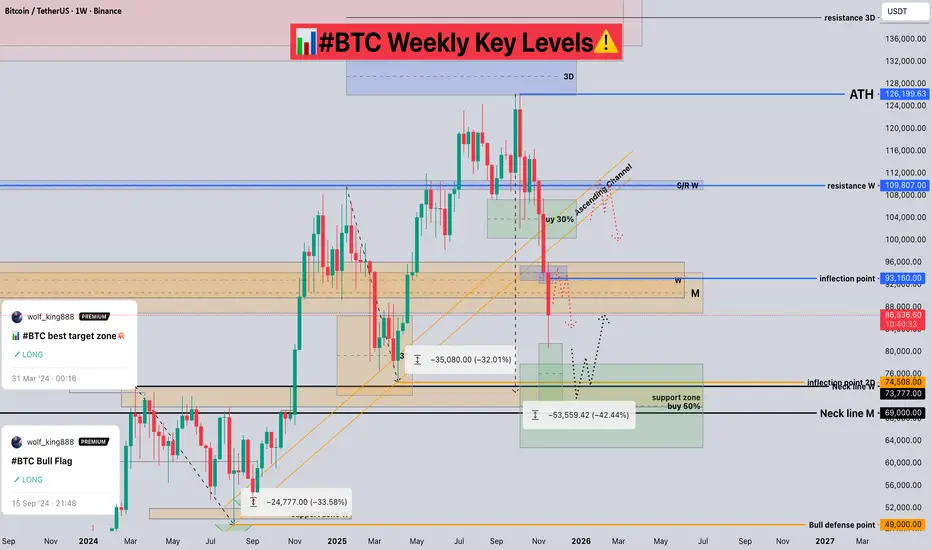
#BTC Weekly Key Levels📊#BTC Weekly Key Levels⚠️
🧠From a structural perspective, we are approaching the key weekly support level around 74508, which is also an ideal target area for a bearish structure. Therefore, if the price reaches this level directly, we can confidently enter the market.
➡️The recent resistance level is around 93000. If we break through the turning point of 93160 first, we might look for long trading opportunities after a pullback.
⚠️It's nearing the end of the month, so let's be patient. ☕️
🤜If you like my analysis, please like💖 and share💬
BINANCE:BTCUSDT
BTC Trade Plan 23/11/2025(Daily Time Frame)Dear Traders,
Bitcoin on the daily chart has recently broken down from a long consolidation range between $90,000 and $106,000, entering a mid-term correction. Price is now approaching a major technical support area where horizontal demand, long-term trendline support, and a historical accumulation zone overlap.
This level acts as a critical decision point for the coming months.
Technical Analysis
1. Corrective Structure
BTC is pulling back toward the strong support zone at $76,000–$82,000, which has historically produced strong bullish reactions.
2. Major Trendline Support
Price is heading directly into the primary ascending trendline drawn from last year’s key lows.
This confluence significantly increases the probability of a bullish reversal.
3. Bullish Scenario (Primary Outlook)
If bullish reversal candles form within 76–82k, BTC could launch a new rally.
Key targets:
First resistance: $95,000
Higher targets: $106,000 – $113,000
4. Bearish Scenario
If price breaks below both the horizontal support and the trendline, a drop toward $67,000–$70,000 becomes likely.
This scenario is weaker but cannot be ignored.
Fundamental Analysis
1. Post-Halving Supply Reduction
The 2024 halving reduced new BTC issuance, historically leading to higher mid-term prices.
Recent data confirms a decline in sell-side pressure—supportive for long-term growth.
2. Institutional Inflows & Bitcoin ETFs
Bitcoin ETFs continue to attract fresh capital throughout 2025.
Institutional adoption remains one of the strongest long-term bullish catalysts.
3. Global Macro Conditions
Bitcoin is heavily influenced by:
Interest rate policy
Inflation trends
U.S. Treasury yields
Any shift toward monetary easing could push more liquidity into BTC.
4. Long-Term Holder Behavior
On-chain metrics show continuous accumulation by LTHs.
This decreases circulating supply and builds the foundation for large future rallies.
5. Regulatory Risks
New regulations or political pressure can introduce temporary volatility.
Still, the global regulatory trajectory appears increasingly favorable toward digital assets.
Conclusion
Bitcoin is currently sitting at a pivotal zone where technical and fundamental forces meet.
The confluence of:
Major support
Trendline structure
Halving-driven supply reduction
Growing institutional demand
creates a strong bullish bias — unless the 76–82k range breaks decisively.
A reversal from this level could mark the beginning of a major upward cycle.

If I hadn’t second-guessed the forecast, my risk-to-reward 1:5As mentioned before, the y-axis of the AI output is fixed. If the price action goes beyond the forecast image, it simply means the forecast can’t cover the full range. In those cases, we rely on market shape and timing instead.
This is a great reminder to trust in the new era of AI accuracy and really let it guide us!
If I hadn’t second-guessed the forecast, my risk-to-reward (R:R) would have been 1:5 🤩

Bitcoin - reversal?BTC has moved into "Oversold" territory on the daily RSI - clue no. 1
The RSI is also nearing "oversold" on the Weekly TF - clue no. 2
Price is approaching the previous high of 73.7K - this price level which acted as resistance could well flip into support as it did in April.
Clues I would be looking for to go long (that haven't happened yet):
Bullish div. on the Daily RSI
A touch on the thick white line (projection from Dec 2022)
Price not falling sub-74K
Anticipate an explosive move into December at the start of the month - possibly 4th Dec.
Entry @ 77K
TP @ 240K
SL @ 63K


Bitcoin's Potential Head & Shoulders: Critical $75K Support# Bitcoin's Potential Head & Shoulders: Critical $75K Support Could Trigger Drop to $30K
## 📊 Current Market Structure
### The Setup
- **Current Price**: ~$84,000
- **Left Shoulder**: ~$109,000 (previous peak)
- **Head**: ~$126,000 (all-time high)
- **Critical Neckline**: $75,000
- **Potential Target on Breakdown**: $30,000
## 🎯 The Head & Shoulders Pattern Explained
### Pattern Components
**Left Shoulder (Completed)**:
- Peak at ~$109,000
- First major top in the cycle
- Followed by correction to neckline
**Head (Completed)**:
- Peak at ~$126,000 (ATH)
- Highest point of the pattern
- Currently correcting from this level
**Right Shoulder (Potential)**:
- **IF** we bounce from $75,000 support
- Could form another peak around $100K-$115K
- Would complete the bearish pattern
- Lower than the head, creating the classic formation
**Neckline (Critical Level)**:
- **$75,000** is the make-or-break level
- Acts as support for both the head and potential right shoulder
- **This level CANNOT be lost** for the pattern to remain valid
## ⚠️ Why $75K Is Absolutely Critical
### This Level Represents:
1. **Pattern Validity**:
- The foundation of the entire H&S structure
- Breaking it invalidates the bullish case
- Confirms distribution phase
2. **Technical Significance**:
- Previous resistance turned support
- High volume node from consolidation
- Psychological round number
3. **Market Structure**:
- Separates bull market from bear market
- Defines the range for right shoulder formation
- Last line of defense for bulls
## 📉 Two Scenarios From Here
### Scenario A: Bounce at $75K → Right Shoulder Formation (50% Probability)
**What Happens:**
- Price holds $75,000 support
- Rally begins toward $100K-$115K
- Forms the right shoulder (lower than $126K head)
- Creates selling opportunity for smart money
- **Then**: Breakdown occurs
**Timeline**:
- Bounce: Q1 2025
- Right shoulder formation: Q2-Q3 2025
- Breakdown: Late 2025/Early 2026
**Trading Implications**:
- Short-term bullish (75K to 100K+ = 33% gain)
- Medium-term bearish (setup for major drop)
- **Exit strategy needed** at right shoulder peak
### Scenario B: Direct Breakdown Below $75K (50% Probability)
**What Happens:**
- No bounce, direct break of $75,000
- Pattern completes immediately (no right shoulder needed)
- Accelerated selling pressure
- Target: $30,000
**Why This Could Happen:**
- Weak market structure
- Lack of buying support
- Macro headwinds (Fed policy, liquidity)
- Panic selling cascade
## 🎲 The $30K Target Explained
### How We Get There:
**Measured Move Calculation**:
- Head to Neckline distance: $126K - $75K = $51K
- Projected from breakdown point: $75K - $51K = **$24K**
- Conservative target considering support: **$30K-$35K**
**Why $30K Makes Sense:**
1. **Technical Confluence**:
- 200-week moving average (~$30K-$35K)
- Previous cycle high (2021 pre-ATH level)
- 76.4% retracement from ATH
- Typical Bitcoin bear market correction
2. **Historical Precedent**:
- 2018: 84% drop from ATH ($20K → $3K)
- 2022: 77% drop from ATH ($69K → $16K)
- 2025/26: 76% drop from ATH ($126K → $30K) would be consistent
3. **Market Cycle Logic**:
- Euphoria at $126K → Panic at $30K
- Washes out leverage and weak hands
- Creates foundation for next cycle
- Resets sentiment completely
## 📊 What Makes This Pattern Dangerous
### Red Flags to Watch:
**Distribution Signs at Right Shoulder:**
- 📉 Declining volume on rallies
- 📉 RSI bearish divergence (lower highs)
- 📉 Whale wallets distributing
- 📉 Funding rates extremely positive (over-leveraged longs)
- 📉 Retail FOMO peaks
- 📉 Media euphoria ("Bitcoin to $1M" headlines)
**Breakdown Confirmation Signals:**
- ❌ Daily close below $75K
- ❌ High volume on breakdown
- ❌ Failed retest of $75K (becomes resistance)
- ❌ Break of ascending trendline
- ❌ Death cross (50 MA crosses below 200 MA)
## 🔮 Probability Assessment
### My Analysis:
| Scenario | Probability | Timeline | Key Levels |
|----------|------------|----------|------------|
| **Bounce → Right Shoulder → Drop** | 40% | 6-12 months | $75K hold, rally to $100K-$115K, then drop to $30K |
| **Direct Breakdown to $30K** | 30% | 3-6 months | Break $75K, accelerate to $30K |
| **Pattern Fails → New ATH** | 20% | 3-6 months | Break above $126K, continue to $150K+ |
| **Extended Consolidation** | 10% | 12+ months | Range between $70K-$100K |
## 💡 Strategic Implications
### For Traders:
**Current Position ($84K)**:
- ⚠️ **High risk zone** - caught between hope and fear
- Wait for clarity at $75K level
- Don't chase moves in either direction
**If $75K Holds**:
- ✅ Long opportunity with tight stop below $75K
- Target: $100K-$115K (right shoulder)
- **Exit before right shoulder completes**
- Risk/Reward: Excellent (12-37% upside, tight stop)
**If $75K Breaks**:
- 🔴 Short opportunity or exit all longs
- First target: $60K
- Second target: $45K
- Final target: $30K-$35K
- Trail stops as it drops
### For Long-Term Investors:
**Current Strategy**:
- 🎯 **Do NOT buy here** ($84K) - wait for clarity
- 🎯 **If bounce to $100K+**: Take profits, reduce exposure
- 🎯 **If drop to $75K**: Small position (10-20% of capital)
- 🎯 **If drop to $50K-$60K**: Medium position (30-40%)
- 🎯 **If drop to $30K-$35K**: Aggressive accumulation (remaining capital)
**Dollar-Cost Averaging Zones**:
- ❌ $84K-$100K: **NO BUYING** (distribution zone)
- ⚠️ $70K-$80K: **Minimal** (5-10% of capital)
- ✅ $50K-$70K: **Moderate** (20-30% of capital)
- ✅✅ $30K-$50K: **Aggressive** (50-70% of capital)
## 🎯 Key Levels to Monitor
### Critical Support Levels (In Order):
1. **$75,000** - THE LINE IN THE SAND
- Pattern neckline
- Must hold for any bullish case
- Break = bearish confirmation
2. **$60,000-$65,000**
- Secondary support
- 50% retracement zone
- Potential dead cat bounce area
3. **$48,000-$52,000**
- Previous cycle resistance
- Strong psychological level
- Potential accumulation zone
4. **$30,000-$35,000**
- 200-week MA
- Pattern target
- Maximum pain level
- **Best buying opportunity**
### Resistance Levels (For Right Shoulder Scenario):
1. **$90,000-$95,000** - Initial resistance
2. **$100,000-$105,000** - Psychological barrier
3. **$110,000-$115,000** - Right shoulder peak zone
4. **$126,000** - Head level (unlikely to break)
## ⚡ What Could Invalidate This Bearish Setup?
### Pattern Failure Scenarios:
**Bullish Invalidation**:
- ✅ Break and close above $126K (new ATH)
- ✅ Strong volume accumulation at $75K
- ✅ Fundamental catalyst (major adoption news)
- ✅ Macro shift (Fed pivot, liquidity injection)
**Signs Pattern Won't Complete**:
- Institutional buying increases significantly
- ETF inflows accelerate
- On-chain metrics show strong accumulation
- Whale addresses growing, not distributing
- Long-term holder supply increasing
## 📰 Current Market Context
Based on your chart's news feed:
- "Bitcoin plunges below $86,000 as US jobs data dampens rate cut hopes"
- Strong jobs data = Fed stays hawkish
- Less liquidity = bearish for risk assets
- This supports the H&S breakdown thesis
## ✅ Bottom Line
### The Critical Message:
**$75,000 is the most important level in Bitcoin right now.**
- ✅ **Hold $75K** = Potential bounce to $100K-$115K (right shoulder)
- ❌ **Break $75K** = High probability of drop to $30K-$35K
- ⚠️ **Current price $84K** = No man's land, wait for clarity
### Action Plan:
**Short Term (Next 2-4 weeks)**:
- Watch $75K like a hawk
- Reduce risk exposure
- Prepare for volatility in either direction
**Medium Term (3-6 months)**:
- If bounce: Trade the right shoulder, but EXIT before completion
- If breakdown: Wait for $30K-$50K to accumulate
- Don't fight the trend
**Long Term (1-2 years)**:
- This pattern, if it completes, sets up the NEXT bull cycle
- $30K would be generational buying opportunity
- Bitcoin's long-term thesis remains intact
- Think in cycles, not in days
---
**Final Thought**: This is a textbook Head & Shoulders pattern forming on a macro scale. The $75K neckline is the key. Lose it, and we're heading much lower. Hold it, and we get one more rally before the inevitable correction. Either way, **patience and discipline will be rewarded** more than trying to catch falling knives or FOMO into pumps. 🎯

BTC - UPDATESorry to say I was right again...
CRYPTOCAP:BTC - Bearish correction weekly ongoing & very bearish bias as I explained 📉
Large cap / Medium Mcap #alts money outlflow 📉
I showed you live that it was likely a bearish trend shifting & trend reversal on the weekly outlook, and here we are!
Supports are now weak.
Key levels to watch:
$100,000 - 101,000❌
$95,800❌
$92,000 ❌
$87,000- 88,000 🎯 ⏳
$84,000🎯
$79,000 🎯
$74,000 - 75,000🎯
🟩Following my bias,Monthly momentum remain bullish, and that could just be a bearish correction before to see a new ATH.
Bull setup valid if it hold above SSB (W) at 79,000 or at least 74,000$ low.
🟥On the other hand; If bulls ar unable to hold above 74,000$ support, then #BTC price could dip much lower & momentum could stay bearish for many month.
Worst scenario -- > 63k --> 50k --> 45k - 42k 😱
At the moment, my strategy is to focus on #alts market with solid PA against #BTC such as CRYPTOCAP:ICP or CRYPTOCAP:FARTCOIN , because there are great chances to see big move when #BTC price will stabilize! 📈
Not a financial advice, cautious in this volatile market.

Bitcoin waiting a waterfall?Bitcoin Analysis – Key Levels in Play
Bitcoin continues to follow yesterday’s outlook. Price moved up to test the resistance aligned with the 0.618 Fibonacci level, and from there extended downward toward the 85,927 support zone. Now we wait to see whether BTC will respect this level and consolidate, or if bearish pressure will continue and push the market even lower.

BTC/USDT : Long Into 96.6K RebalanceLiquidity taken below the prior low, displacement confirmed, and price delivered into a clean discount array.
Entry refined at 93.3K, drawing toward the 96.6K imbalance created by the previous sell-side leg.
The move is framed as a simple liquidity → displacement → rebalance delivery.
Stops sit below the internal low (92.8K).
Targeting the full inefficiency fill at 96.6K before reassessing structure.

BTC longI think the bulls should gradually gain strength.
It's time to back... I guess🤷
Easy and simple.

BTC ShortNice short opportunity in BTC. Targets on the charts. As there is no volume, we hope this can happen. DYOR

BTC 1 week analysisbtc will take support from this area and 70% chance are the reversal going to happen from this area. we need to see how the BTC will react from this area.

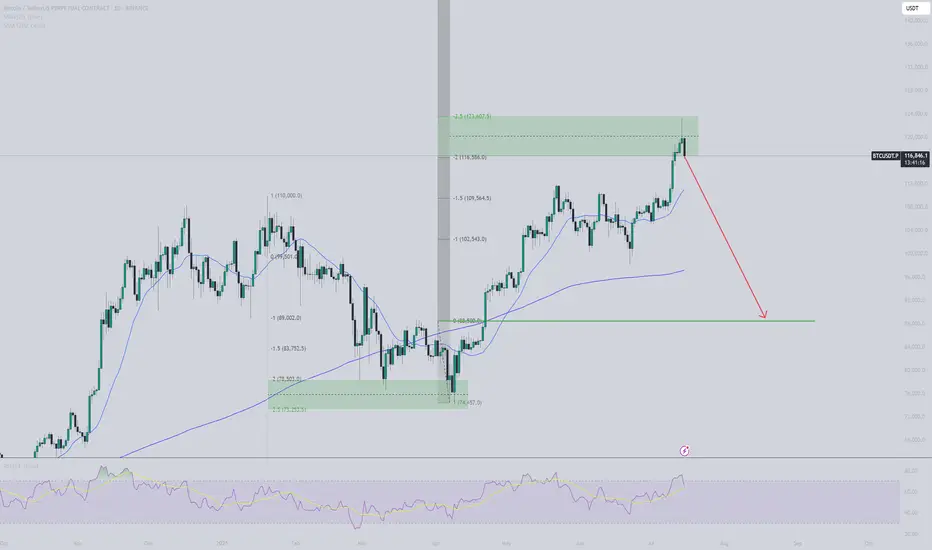
BTC retracement comingBTC seems to follow the 2-2,5 stdv price structure. Based on simply stdv from last manipulation leg down it suggests we are now at reversal zone, and I expect price to retrace down. First reaction seems to support this plan. Aiming at $88,5K.
BTCUSDT DAILY VOLUME ANALYSISLet’s get straight to discussing BTCUSDT, which is once again being talked about a lot — where is BTCUSDT heading?
My assumption: it’s still BULLISH.
Why? It’s still above the green trendline I drew, and buyers are still dominating.
Also, I’ve drawn many green and red circles — Green = Bullish Volume, Red = Bearish Volume.
Take a look!
That’s all for my explanation. Right now, BTCUSDT seems to be getting ready to reach a new ATH (All-Time High).
By the way, only 2 months left in 2025!! Keep up the spirit!
Remember: crypto — do your own research
and money management first

BTC Weekly – Wave 4 Correction Into Demand ZoneBitcoin is currently completing a Wave 4 correction on the weekly timeframe after forming a strong Wave 3 top. The decline is aligning perfectly with major Fibonacci retracement levels (0.5 – 0.618 – 0.786) along with a well-defined weekly demand zone, suggesting that downside may be limited and a long-term bullish continuation is likely.
🔍 Elliott Wave Structure
Wave (1) formed in mid-2021
Wave (2) bottomed in 2022
Wave (3) extended strongly into 2024/2025
Price is currently moving through Wave (4), a corrective phase
The projected next move is Wave (5) targeting a new ATH zone in the coming years
Wave 4 typically retraces into the 0.382 – 0.618 Fibonacci region, and Bitcoin is already approaching the golden pocket, matching historical BTC behavior in previous cycles.
🟩 Key Demand Zone
The chart shows a high-volume demand area between:
0.618 Fib (~$60,000 zone)
0.786 Fib (~$45,000 zone)
This entire region has:
Historical accumulation
Heavy buying response in past corrections
Confluence with long-term trend structure
This makes it a high-probability reversal zone for the start of Wave 5.
📈 Expected Move (Projection)
If BTC respects this demand zone:
Consolidation / accumulation inside the zone
Breakout above $85k resistance
Next leg into Wave 5, with upside targets around:
$110k
$130k
$140k+ (potential new ATH)
This matches both Elliott Wave theory and long-term cycle momentum.
Bitcoin is in a healthy macro correction, approaching a powerful confluence zone that historically triggers strong trend resumption. The structure favors a major Wave 5 rally over the coming months/years, offering long-term investors a potential high-reward setup.
Disclaimer: The information presented here reflects my personal market analysis and opinions. It should not be considered financial, investment, or trading advice. Cryptocurrency markets are highly volatile. Please evaluate your own risk tolerance and consult with a licensed financial advisor before making any investment decisions.
