BTCSince my first forecast regarding the BINANCE:BTCUSDT.P decline 2 months ago, the asset has dropped by 27%.
As of today, my global outlook on the market remains bearish. The first significant target is 78,200.2. Once reached, it will be necessary to assess the character of the price movement there.
While we move toward this target, the entire market will also likely head down. This creates excellent opportunities to profit, as the market is moving rather than standing still.
Subscribe to not miss updates.
Trade ideas

BTC Adam & Eve PatternLooks like on the 12 hour BTC has an Adam & Eve pattern. The height of the arch is the potential downside. So if it plays out, it looks like 74k is possible.

BTC/USDT (MACRO OUTLOOK) Price speculation Bitcoin is in a macro bull trend but currently experiencing a necessary and healthy retracement toward key support levels.
As long as BTC holds above $64,800 on the monthly timeframe, the bullish structure remains intact.
A strong bounce from this zone could reopen a move back toward $97,000 and later $120,000+.
If $64,800 breaks on a monthly close, expect a deeper correction to $48,000–$40,000 before the next leg of the bull cycle.
📌 Macro Bias: Bullish, with short-term correction.
📌 Strategy: Wait for monthly confirmation around $64,800 support.

What if...?A rising wedge pattern in the final stages makes sense to me. We've been trading up only since 2023 and past cycles always end before everyone keep waiting for the "last leg up" to sell. Why this time should be any different?

Bitcoin levels and overlay of previous bear market. This is a long-term Bitcoin price chart (BTC/USDT) on a monthly timeframe from TradingView, spanning from mid-2021 to early 2028 (with the current date being November 21, 2025).
Key elements:
Price action:
Bitcoin peaked around November 2021 at roughly ~$69,000 (all-time high at the time).
It then entered a prolonged bear market throughout 2022, bottoming near ~$15,500–$16,000 in November 2022.
From 2023 onward it has been in a slow, steady recovery and new bull market.
As of November 2025, the price is trading around $88,000–$92,000 and has just broken above the previous all-time high from 2021.
Horizontal lines and Fibonacci retracement/ extension levels:
The chart is overlaid with multiple Fibonacci tools (likely drawn from the 2021 ATH to the 2022 low) showing classic retracement and extension levels:
0.382 (green)
0.5 (orange)
0.618 (golden ratio, blue) – heavily emphasized
0.65, 0.786, 1.0, etc.
Higher extensions: 1.618, 2.0, etc.
The price has repeatedly respected these levels over the years:
Found support near the 0.618 (~$30k–$35k area) multiple times in 2022–2023.
Broke above the previous ATH (1.0 level) in 2024–2025.
Currently trading around the 1.618 extension (~$90k–$100k zone), with some levels drawn slightly differently by the author (e.g., 0.65 instead of standard 0.65/0.786).
Overall structure:
The chart shows a classic post-bear-market expansion where Bitcoin is now targeting common Fibonacci extension levels that many analysts use for bull-market price targets (1.618 × the prior bear-move often gives ~$100k–$140k depending on exact swing points used).

BTC - Next Bottom in October 2026?This is my second scenario: as long as the previous weekly higher low holds, I remain bullish. However, if any candle closes below 74,500, it signals further downside ahead.”
“This represents my secondary scenario. Bullish bias remains valid while the previous weekly higher low is intact. A candle close below 74,500 would invalidate this structure and suggest additional downside.”
“Bullish while the weekly higher low holds. A close below 74,500 indicates more downside.”

New BTC planWe lost an important support level of $100,000, as a result BTC is in a clear downtrend, now I thinkg it's going to grab all the liquidity below of $85,000 level, anyway, I think we are in the end of one of the biggest corrections because if we take a look at previous downfalls, BTC usually falls around 30-40% after new peaks, and the same situation is hapenning here again, moreover, on 1-week chart BTC always bouncs back from EMA-100 level which meant continuation of a bullish trend


BTC Weekly RSIBTC Weekly RSI Just Hit 37.5 — First Time Since Jan 2022
The last time Bitcoin’s weekly RSI fell back into this zone was January 2022, right before a 45% relief rally that carried the market from January → March, even within a macro downtrend.
After that rally, RSI eventually bottomed at 27 in July.
Today, BTC’s weekly RSI has returned to the same 37–38 region, historically signaling exhaustion in downside momentum.
If BTC mirrors the 2022 relief structure, a similar ~45% bounce from the current ~$89K zone would align with previous cycle behaviour.
Not a guarantee — but the setup rhymes with past market structure.

BTC Bearish TargetThe 1064 bar theory has played out perfectly assuming thast the BTC was in on 6 Oct 2025. Significant damage has been done to the macro structure since then. If we assume the Top was in on 6 Oct 2025 the 4 year cycle remains in tact and we can just the date range trend to predect the nect bottom date being 5 October 2026 (364 days from Top to Bottom) We use the FIB and other support/resistance to determine a possible price range of where the bottom could be. Based on 0.618 - 0.786 Fib retrancement it gives us a possible price range of 58329 - 39274 where the price of BTC will potentially bottom out. Looking at prior support/resitance we want to narrow this price range down to 58329-51043. Once we reach the predicted date the possible bottom price will be re-evaluated.
BTC is also currently breaking down from a accending wedge on the weekly with the measured move taking us to 47681.

Btc big short , will it print again ?Price just took the low, exactly as anticipated. My bearish bias remains firm. Hope everyone stayed safe out there.
Still looking for more downside. Now, I'm just waiting patiently for a retest of my marked zone to find another short setup.

$BTC gave an exact bounce right after tapping our demand areaCRYPTOCAP:BTC bounced perfectly after tapping our demand area “Hamza The Insider” demand zone reaction. Now let’s see if it pushes up to take highs next. 📈🚀

BTCUSDT: Elliott Wave 5 Completed – Road to $60k-$70k Support?Technical Breakdown: Analyzing the daily chart structure, Bitcoin appears to have completed a major 5-wave impulsive cycle within a long-term ascending channel. The recent peak marks the termination of Wave (5), coinciding precisely with the upper channel boundary. The RSI indicator also suggests overextended conditions, signaling a potential trend exhaustion.
Projected Path (The Blue Line): Following the completion of the motive phase, a corrective structure (A-B-C) is anticipated:
Relief Rally / B-Wave: We may see a short-term bounce or a "Bull Trap" retesting the $95,000 - $106,000 zone. This area serves as a critical supply zone.
Corrective Leg Down: Rejection from the highs should trigger a deeper correction towards the dynamic support of the channel.
Key Levels to Watch:
Resistance Zone: $95,000 - $106,000
Target / Support Zone: $60,000 - $70,000. This zone represents the confluence of the lower channel trendline and previous structural support, offering a high-probability area for a long-term bounce.
Conclusion: While the macro trend remains bullish, the risk/reward ratio at current levels is unfavorable. Traders should exercise caution and look for the completion of the corrective phase near the $60k-$70k region for optimal re-entry opportunities.
Disclaimer: This analysis is for educational purposes only and does not constitute financial advice. Always manage your risk.

BTC 1 week analysisbtc will take support from this area and 70% chance are the reversal going to happen from this area. we need to see how the BTC will react from this area.

Bitcoin pump will come soonBitcoin is standing at multiple support areas like the 0.702 Fibonacci, trendline, and weekly 100MA, and a pump is very likely to come soon pushing the price to 110k.

The Global Trade Market Is ShiftingDynamics, Drivers, and the Future of International Commerce
The global trade market is undergoing one of the most significant transitions in modern economic history. For decades, globalisation shaped the world’s economic landscape—reducing trade barriers, integrating economies, and enabling companies to expand across borders with unprecedented ease. However, the world is now witnessing a shift marked by geopolitical tensions, supply chain disruptions, rising protectionism, technological transformation, and new regional economic alliances. This shift does not signal the end of global trade; rather, it marks the evolution of a more complex, diversified, and strategically fragmented global trade system.
This transformation is influencing industries, governments, businesses, investors, and consumers, creating both risks and opportunities. Understanding these shifts is crucial for anyone engaged in global business, financial markets, policymaking, or strategic planning.
1. From Hyper-Globalisation to Strategic Globalisation
Between the 1990s and early 2010s, globalisation accelerated rapidly. Countries pursued free trade agreements, multinational corporations expanded production worldwide, and emerging economies—especially China—became major manufacturing hubs.
However, the model of “hyper-globalisation” began to slow after 2015 due to:
geopolitical conflicts
rising economic nationalism
trade wars (notably U.S.–China)
global pandemic disruptions
technological competition
As a result, economies are shifting from traditional globalisation to strategic globalisation—a system where trade decisions focus on resilience, security, and long-term stability rather than just cost efficiencies.
2. Geopolitical Tensions and the Rise of Fragmented Trade Blocs
One of the most significant forces shaping global trade is geopolitics. Rivalries between major powers—especially the U.S., China, and the EU—are influencing global supply chains and trade flows.
Key geopolitical drivers:
U.S.–China strategic decoupling
Both countries are reducing their dependence on each other in technology, manufacturing, and investment sectors.
Russia–Ukraine conflict
Resulted in major disruptions in energy, grains, and fertilizers, forcing Europe and Asia to diversify suppliers.
Middle East tensions
Affect global oil trade routes and shipping costs.
New alliances and mini-lateral agreements
Nations are forming smaller, strategic partnerships rather than large global agreements.
This geopolitical fragmentation is creating regionalization, where countries prefer trade within trusted or nearby partners.
3. The Reconfiguration of Global Supply Chains
The pandemic revealed the vulnerability of long, complex supply chains. Lockdowns, transport delays, and shortages of critical materials pushed companies to rethink their strategies.
New supply chain trends include:
Near-shoring – Moving production closer to end markets (e.g., U.S. companies shifting from China to Mexico).
Friend-shoring – Outsourcing to politically aligned nations (e.g., India gaining attention due to its stable relations with the West).
China+1 strategy – Businesses diversifying manufacturing to India, Vietnam, Thailand, and Indonesia.
Automation and digital supply chains – Enhanced efficiency using AI, robotics, and data.
This restructuring aims to build resilience, reduce risk, and increase production agility.
4. Technological Power Shifts in Global Trade
Technology has always influenced trade, but today its role is transformational. Countries that dominate critical technologies gain economic and strategic advantage.
Key technological drivers:
Artificial Intelligence (AI)
AI-driven optimisation in logistics, trade forecasting, port automation, and smart manufacturing is reshaping global competitiveness.
Semiconductor industry shifts
To reduce dependency on Asia, the U.S. and Europe are heavily investing in local chip production.
Digital trade and e-commerce
Cross-border digital services trade is growing faster than goods trade.
Blockchain and fintech
Transforming trade finance, supply chain verification, and international payments.
These technologies change not only how goods move but how value is created in the global economy.
5. Growth of Regional Economic Powerhouses
Regional groups are becoming stronger as economies diversify trade partners and reduce reliance on global structures.
Major regional blocs gaining momentum:
RCEP (Regional Comprehensive Economic Partnership)
Now the world’s largest trade bloc, covering East Asia and the Pacific.
EU integration strengthening after supply chain disruptions
USMCA replacing NAFTA, boosting North American regional manufacturing.
African Continental Free Trade Area (AfCFTA)
Creating a unified African market.
These regional arrangements highlight how trade is shifting from global dependence to regional consolidation.
6. Sustainable Trade and Green Globalisation
Climate change regulations are influencing global trade structures. Many economies are adapting by adopting sustainability-focused strategies.
Examples include:
Carbon border taxes (EU’s CBAM) increasing trade costs for carbon-intensive imports.
Demand for clean energy equipment (solar panels, lithium batteries, green hydrogen) reshaping global export flows.
Greener logistics such as electric freight vehicles, sustainable shipping fuels, and greener ports.
Countries that lead in green technologies are becoming new trade leaders.
7. Impact on Emerging Markets and Developing Economies
The shift in global trade is especially important for emerging markets. Nations like India, Vietnam, Indonesia, and Mexico are benefiting from diversification away from China.
Advantages:
Increased FDI in manufacturing
Job creation
Integration into global supply chains
Expansion in exports of electronics, pharmaceuticals, textiles, and automobiles
However, other developing economies may face challenges due to stricter sustainability standards, rising protectionism, and limited access to advanced technologies.
8. Implications for Businesses and Investors
The shifting trade landscape affects corporate strategy, market expansion, production costs, and investment decisions.
Key implications:
Companies must diversify supply chains to reduce geopolitical risks.
Investors are shifting capital into markets benefiting from trade realignments.
Trade-dependent industries like automotive, electronics, chemicals, and energy are re-evaluating global operations.
Currency volatility and commodity price fluctuations will influence global trade profitability.
Businesses that adapt to these changes will gain competitive advantage.
9. The Future of the Global Trade Market
The global trade market is not shrinking—it is being reshaped. The future will involve:
More regional trade partnerships
Strategic, secure, and technology-driven supply chains
Increased role of AI and automation
Competition in green and digital technologies
More balanced trade flows across Asia, Europe, and the Americas
A shift toward economic security over low cost
Instead of a single global market led by one dominant nation, the future may feature multiple global trade hubs, interconnected but competitive.
Conclusion
The shifting global trade market reflects a world adjusting to new realities—geopolitical tensions, technological advances, environmental demands, and the need for resilient supply chains. This transition marks the evolution from old-style globalisation to a smarter, more secure, and strategically diversified trading system. Countries and businesses that adapt proactively to this new trade order will be best positioned to benefit from future opportunities.

Bitcoin run is over BTC chart shortly . The season probably has been over
This pattern is not accepted yet , but looks promising
Just personal opinion
Not financial advice

40 consecutive days of accurate BTC forecastingSome people get lucky once or twice, but 40 consecutive days of accurate BTC forecasting is what happens when artificial intelligence meets MTOPS intelligence .
Started documenting these calls just to prove it to myself—40 days later and still undefeated on Bitcoin price action.

Bitcoin Can reach 93000 Bitcoin could reach the price level of $93,000 in the coming weeks.
There is a possibility that after breaking the midline of its long-term weekly channel, it may move up to the indicated FVG level to fill the remaining unfilled orders.
After that, it could start a new bullish rally aiming for the upper boundary of the channel.
This is purely an analysis and should not be considered as financial advice.
Buying or selling is at the trader’s own risk.

Retest Confirmed - Bitcoin Analysis (2D)Hello everyone.
I must say that it's not very easy to say it loud but for a short period of time, the Bulls have lost the fight.
According to several factors, the next two months will be blood-colored in the entire market.
Get ready to bleed. Because your portfolio will. So will you.
Okay, but why?
Let's see;
Fundamental Factors:
-The USA is still creating more tension around the globe. Only last week, the USA has operated a huge campaign over the Caribbean Sea. And yes, if you ARE a trader, you'll follow these kinds of events because this market is not a playground for kids.
-The USA has finished its recession today but for the first time in history it took a lot of time for them to solve the problems. During the "solving" phase, the market has already calculated the fair prices for so-called "bullish news". By “bullish”, I mean reopening the USA, which is not actually bullish at all because it was never meant to be happening in the first place anyway.
-Today the USA senate has talked about another export restriction for China. This actually is the trigger for today’s red candles.
-The FED is still telling people the same story about inflation. Their utopian targets for inflation are not realistic and they know it as well. Powell has marked that there might be no rate cuts in December after all. Personal thoughts: There will be. In the short term? BEARISH.
-Another thing to consider is the ETFs. Remember what happened in the market when BTC and ETH ETFs were listed? This is what's happening at the moment. History just repeats itself again and again. Many altcoin ETFs will be approved during this month. This will trigger another event called "accumulation". Hedge funds and other customers will seek to buy the dip. Therefore, they will push the prices of ETF-listed altcoins to the bottom so they can buy at lower prices while your portfolio melts. CEXs will also help them do so by letting them manipulate the order book via fake resistance orders. Sorry, but this is how it works.
Now the fun part. Let's talk about the Technical Factors:
-For this time I'll start with USDT dominance.
There is not much to talk about but I'll leave a link so you can examine. The entire market will remain bearish as long as this parameter stays above 5.2%.
-Another thing to keep an eye on is the S&P index, which is looking very bearish due to uncertainty around the globe and for the most part the US.
-Let's get back to BTC.
In previous analysis, I already explained to you what might be coming soon and we might actually have been at the end of wave 5. Well, sadly that analysis worked. Yes, sadly because I want this market to grow.
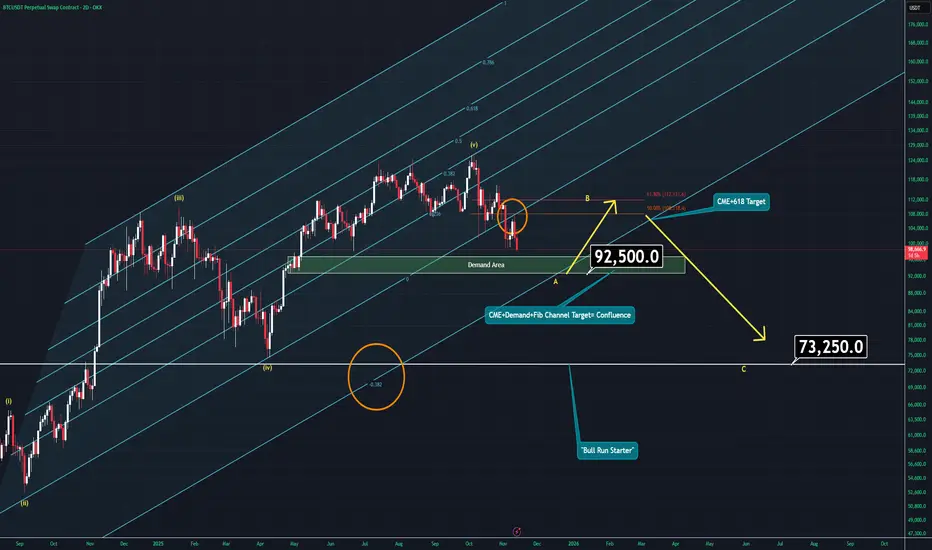
At the moment we are going to see an A-B-C correction pattern and it will take a few weeks to complete. During this era, you need to be careful about two things:
Don’t even think that getting a swing long position to hold for 2 years will work.
You will see a correction through 110K soon but it will only be wave B. So, if you're carrying long-term hedge positions, you'll need to watch for an ENGULFING daily candle in Bitcoin around 92K. That's where the CME gap was left — also a demand area and moreover, there is Fib channel confluence. Before that “engulf” happens, I'd not suggest lowering breakeven in losing positions.
The wave 5 also will be a perfect trap for newcomers and for people who don't know much about the market. Many will jump into altcoins when they're cheap, but most likely they will be cheaper around March 2026.
Bitcoin has already completed its retest after breaking the lower boundary of this Fib channel. No need to overthink it. As long as Bitcoin stays below 110K, don't look for any “BULL RUN.”
And if somehow Bitcoin reaches around 110K, wait for a weekly candle close. That will both confirm and trigger bullish momentum. Don't worry, you won't miss the move — you'll just confirm it.
Thanks for reading,
Get ready.
Target aquired! Another beautiful win over hereIn this setup, we identified a strong entry signal, executed perfectly, and captured profit as the predicted move played out. The 30-min interval revealed a high-probability trade. Key levels were respected, and our targets were met with discipline. Stop loss and risk management kept us safe through volatility. Great momentum in BTCUSDT—watch for further setups in upcoming sessions!

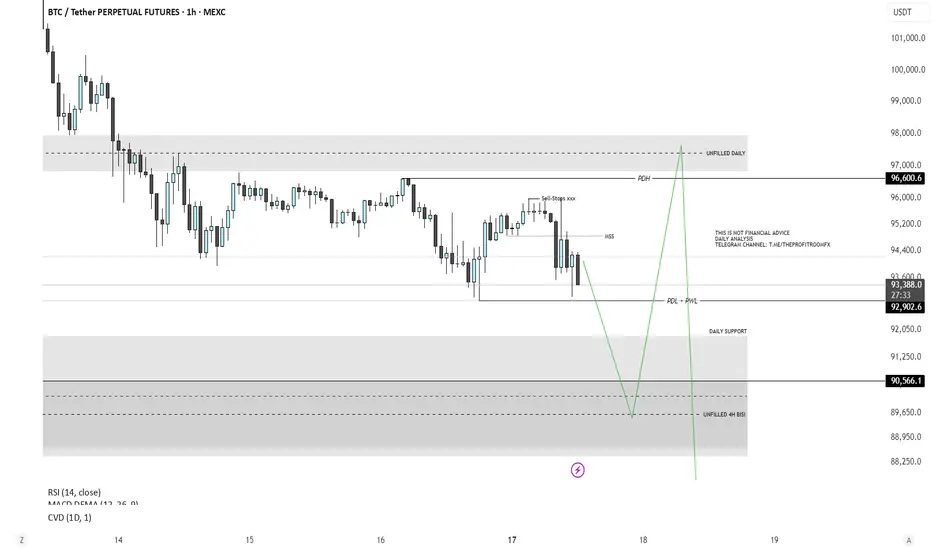
Bitcoin Analysis - Short & LongPrice is anticipated to sweep the previous day’s low (PDL) and previous week’s low (PWL), while also mitigating the unfilled H4 imbalance.
This aligns with a potential retest of the daily FVG support zone before initiating a move to the upside.
There is a clear draw on liquidity toward the buy-side, with both the previous day’s high (PDH) and an unfilled daily FVG serving as objective targets.
After filling this daily FVG imbalance, price is expected to continue delivering lower to address remaining inefficiencies on the sell-side, specifically around the 87,000 level, where another unfilled daily FVG is present.
2.0 BTC/USD Short I say bitcoin is very profitable in the long run, I had a similar idea for 2022, where we are going. I closed it short then. Look at my profile, the cold is also shaking.
