BTC/USDT 1H Short-Term (maintaining support)📉 MARKET STRUCTURE
1. Trend
The chart shows a clear falling wedge, which statistically is a pro-growth pattern—breakouts most often occur upwards.
Upper wedge line: ~96,400 USDT
Lower wedge line: ~93,750 USDT
The price has just rebounded from the lower edge—this is a key demand level.
📊 SUPPORT AND RESISTANCE LEVELS
Support (demand):
93,750 – lower wedge line
93,300 – strong chart level
92,650 – lower support, strong volume reaction
Resistance (supply):
95,000 – 95,450 – local resistance (supply often returns here)
96,400 – resistance key + upper wedge line
📈 INDICATORS
Stoch RSI (1h)
We have rebounded from the oversold level.
The %K line is breaking the %D line upwards → a signal of a potential short-term rebound.
MACD
The histogram is decreasing, but the first signs of flattening are visible.
The MACD line is still below the signal line, but is approaching → momentum for a reversal is beginning.
Volume
Volume increased on bearish candles, but near the bottom, two demand candles with increased volume appeared → buyers reacted at support.
📌 CONCLUSIONS
✔️ Bullish short-term scenario (more likely at this point):
Bounce from 93,750 + rising indicators = local upward correction.
Targets:
94,800 – 95,000
95,450
96,400 (upper band of the wedge — an important decision point)
❌ Bearish scenario (if support breaks):
A drop below 93,750 on strong volume opens the door to:
93,300
92,650 (a large defensive level — aggressive demand could enter here)
Trade ideas

TradeCityPro | Bitcoin Daily Analysis #219👋 Welcome to TradeCityPro!
Let’s dive into the Bitcoin analysis. A bearish structure has formed in the market, so let’s review today’s key triggers together.
⏳ 1-Hour Timeframe
Yesterday, Bitcoin made another bearish leg after being rejected from the 10,5043 level, dropping all the way down to 10,1302.
🔔 The corrections during this downtrend that started from 10,6644 have been quite deep, and yesterday, after reaching the 10,1302 zone, the price made a short-term correction up to 10,3855.
✔️ Today, after reaching that level again, Bitcoin has started forming red candles and is now moving back toward the 10,1302 support.
💡 If the 10,1302 level breaks, we can open a short position.The main confirmation of a continued bearish trend will come with the break of 10,0308.
📊 For a long position, the first trigger is at 10,3855, and the main long trigger is at 10,5043.The main confirmation of a bullish reversal will come with a break above 10,6644.
❌ Disclaimer ❌
Trading futures is highly risky and dangerous. If you're not an expert, these triggers may not be suitable for you. You should first learn risk and capital management. You can also use the educational content from this channel.
Finally, these triggers reflect my personal opinions on price action, and the market may move completely against this analysis. So, do your own research before opening any position.

TradeCityPro | Bitcoin Daily Analysis #221👋 Welcome to TradeCity Pro!
Yesterday, Bitcoin’s bearish movement continued once again, and the price has now reached a very important support level.
⏳ 4-Hour Timeframe
On the 4-hour timeframe, Bitcoin is in its second bearish wave. After correcting up to 10,6644, it started a fresh downward move.
✔️ Yesterday, the price interacted with the 99,827 zone, which overlaps with the 0.5 Fibonacci level. After this zone was broken, the bearish move extended down to 94,355.
⚡️ The 94,355 level overlaps with the 0.786 Fibonacci retracement, and so far, the price has shown a reaction to it and is currently ranging near this support.
💫 If the 94,355 level breaks, we will have confirmation of a continued downtrend, and we can open a short position on the breakout.
💡 For previously opened short positions, you can move your stop-loss above 97,021, and if the price stabilizes above that level, you can take profit and secure your gains.
📊 For long positions, it’s better to wait until bullish momentum returns to the market.
❌ Disclaimer ❌
Trading futures is highly risky and dangerous. If you're not an expert, these triggers may not be suitable for you. You should first learn risk and capital management. You can also use the educational content from this channel.
Finally, these triggers reflect my personal opinions on price action, and the market may move completely against this analysis. So, do your own research before opening any position.

btc finds 200 ema support, whats next?As I have been posting in these "Ideas" for the past few weeks about market direction and where the price for BTC will go. It now has come to pass where the 200 EMA has been tested and support has been found, It however has not generated any relief among buyer sentiment unable to push price above the previous days close leaving the digital asset to continue to bleed out and cause positions from all the 93k Bulls to liquidate.
Its a shame people cannot make the connection that the only way price can go higher is to go lower in a market. That Is why I am going to warn people about where we may go , I believe the 200 EMA will be tested again and if support is broken it will send is into the low 70k area where there are open orders and It is possible this may happen. The Bull market support band is the 200EMA however there may be institutional money that may drive us down to cause massive liquidations and fear and panic among those holding bags while greed causes big players to push more into the fringe of where we can maintain a recovery.
Watch for a retest of the 200EMA . which is a bit of a fuzzy zone , use the high and low to denote the area for support as well as keep an eye on the RSI and CCI , we are also watching on balance volume drop off which is not a great sign that there is market confidence however this will play out over the weekly and the weekly candle will start to materialize in the next few days.

Trading Alert (BTC)Well, the price is expected to drop to $88k due to the candle closing below the $100k level

BTC Bitcoin & Crypto Selloff Alert: Is a Second Wave Imminent?If you haven`t bought BTC before the rally:
The cryptocurrency market is still reeling from the brutal sell-off on Friday, October 10, 2025, triggered by U.S. President Donald Trump's announcement of 100% tariffs on Chinese imports. Bitcoin plummeted below $105,000, Ethereum dropped over 16% to under $3,700, and the broader market saw liquidations exceeding $19 billion—the largest single-day wipeout in crypto history, nine times bigger than February 2025's crash.
While Monday and Tuesday brought some recovery, with Bitcoin climbing back above $115,000 and the total market cap topping $4 trillion, underlying issues like inflated trading volumes, massive altcoin losses, and a prominent whale re-entering a short position suggest this might just be a dead-cat bounce. This article explores why a second leg down could be imminent, incorporating technical analysis for TradingView users eyeing volatility plays.
The Friday Flash Crash: A Perfect Storm Amplified by Fake Volumes
The October 10 crash unfolded rapidly, with Bitcoin shedding nearly 10% in hours and over $200 billion erased from the market cap. But what made the drop so severe, especially for altcoins?
A key culprit: fake trading volumes driven by wash trading. Wash trading, where traders buy and sell the same asset to themselves to inflate volumes, creates the illusion of liquidity and interest without real economic activity. Estimates suggest that up to 87-88% of crypto volumes are fake, often used in pump-and-dump schemes or to lure retail investors.
In thin markets like crypto, these artificial volumes mask true liquidity. When real selling pressure hit—amplified by leveraged positions and the tariff news—exchanges like Binance saw cascading liquidations due to flawed margin systems. This "flash crash" wiped out $600–900 million in longs alone, but the fake volumes meant the market couldn't absorb the shock, leading to exaggerated drops.
Analysts note that such illusions persist in 2025, with AI tools now exposing them, but regulators lag behind. If volumes remain overstated, any renewed catalyst could trigger another liquidity vacuum, setting up a second leg down.
Altcoin Bloodbath: 50–90% Drops Expose Vulnerabilities
While Bitcoin and Ethereum recovered somewhat, altcoins bore the brunt of the carnage. An index tracking altcoins (excluding BTC, ETH, and stablecoins) cratered about 33% in just 25 minutes, with some tokens plunging 50–90%. Tokens like Solana, XRP, and Dogecoin lost 20–60%, but lesser-known altcoins saw even steeper declines, highlighting the sector's over-leveraged and illiquid nature.
This disproportionate pain stems from altcoins' reliance on hype and speculative inflows, often propped up by those same fake volumes. In a risk-off environment, capital flees to safer assets like Bitcoin, whose dominance spiked during the crash.
Altseason indicators are now cooling (76–78 previously).
Bitcoin dominance dropped below 59% post-crash.
If earnings season in traditional markets reveals economic weakness, spilling over to crypto, altcoins could lead the next sell-off wave, potentially dropping another 20–50% if support levels break.
The Whale Factor: $192M Profit, Then Re-Entry Signals Bearish Conviction
Adding fuel to the fire is a mysterious crypto whale who timed the crash impeccably. Just 30 minutes before Trump's tariff announcement, this entity opened a massive short position on Bitcoin, pocketing $192 million in profits as the market tanked.
Speculation abounds: Was it insider knowledge, or just savvy trading? Either way, the whale didn't stop there—they've re-entered with another short, increasing their position to $340 million, and even opened a fresh $163 million bearish bet.
Other whales have followed suit, including:
A Satoshi-era entity shorting $1.1 billion before the news
An OG whale opening a $392 million short
These moves suggest high conviction in further declines, possibly tied to ongoing trade tensions or macroeconomic risks. In a market where whales can move prices, this re-entry could catalyze the second leg, especially if it triggers more liquidations.
My price target for Bitcoin is $95K

Bitcoin Downtrend Continues: Bearish Target at $93,500Bitcoin is trading in a clear downtrend channel, repeatedly rejecting the trendline after liquidity sweeps. Support zones above have already been broken and retested as resistance, signaling bearish momentum. Price is currently consolidating near the lower channel, with a potential drop toward the target zone around $93,500.

BITCOIN – LEVELS TO WATCHTraders,
We dumped. Now we are in a controlled recovery. The question is not only “are we going up” but “where will the market make its real decision.” Right now the chart is giving us two very clean checkpoints.
1. What happened
We lost the weekly open and sold off.
Spot was selling too, so the dump was real.
After the low, spot started buying again and price reclaimed above the big wick. That looks like a failed attempt lower.
Markets left a really weak low behind at ~99k. I am convinced we will sweep this low somewhere in the coming weeks.
Funding is negative while price is moving up. Shorts are still in the market. This is how squeezes start.
2. First decision zone: 107.300 to 108.000
This area is important because several things come together.
107.300 is a weak high. It stopped at a clean level without strong rejection. That often means liquidity is still sitting above it.
The AVWAP anchored from 7 April is there. Price is below it for the first time since that move. When price comes back into an AVWAP from below the market often reacts because old buyers meet new sellers.
We also have an LVN just below. That tells us the market did not trade much there before. Price likes to test that kind of gap.
So 107k to 108k is our first place to watch the data. If spot keeps pushing and perps do not start selling we can break it. If CVD stalls there it can be a take profit zone.
3. Accumulation and Distribution
On both the 1 hour and 4 hour spot charts the Accumulation/Distribution line tells an important story.
Price made a clear new low after the dump.
The A/D line did not make a new low. It actually started to turn up.
That is what traders call a bullish divergence. Price is still falling but the money flow is already improving.
In simple words. While candles were going down someone was quietly buying.
That means the bounce we see now is not just short covering or a random spike. It was prepared by real spot demand.
Futures can show a similar thing but spot is the cleaner signal because it is not influenced by funding, leverage or hedges.
When real buyers step in while shorts are still in the market it often creates the right conditions for a squeeze.
4. OBV check
On the 4h OBV you can see it popping up from the base after the dump. OBV going up while price is moving up means volume is supporting the move. This agrees with the spot A/D story. It is better when price and OBV move together than when price moves alone.
5. Scenario 1
Price pushes into 107k to 108k.
That sweep takes the weak high and tags the AVWAP.
If at that point spot CVD slows down or perps start to sell we can reject.
A rejection there can send price back into the mid zone and even lower towards 101k to 102k and in extension back to the HTF LVN near 98k.
This is the simple “first resistance holds” idea.
6. Scenario 2
This is the one I am leaning toward.
Price breaks and holds above 108k.
Shorts do not get their reaction.
Spot keeps supporting and funding stays negative to flat.
Then the market has room to go for the next real liquidity pool which is 117k to 118k.
7. Why 117k to 118k matters
On the liquidity heatmap there is clear resting liquidity higher up. Price often travels to those areas because that is where orders are.
The golden pocket of the previous move sits in this same zone. Many traders watch this fib area so reactions there are common.
Several AVWAP bands from earlier dates are meeting around 117k to 118k. When AVWAPs from different anchors cluster together it creates a stronger level because different groups of traders all care about that price.
Between the current price and that zone there are imbalances and LVNs. That means the market moved quickly there before and did not build volume. These thin areas often get filled on the next push.
8. How to read it in real time
Above 108k and spot CVD still rising means squeeze is on.
Above 108k and funding still negative means shorts are paying to stay wrong.
Lose 108k again after a sweep and see CVD roll over means scenario 1 is playing.
Price can just dump down without getting more liquidity. But looking unlikely based on the data right now.
So if Bitcoin can break and hold above 108k there is not much in the way until 117k to 118k.
Final view
We dumped on real flow.
We are recovering with spot support.
We have a clear first test at 107k to 108k.
Break and hold and the magnet becomes 117k to 118k because of liquidity, golden pocket, AVWAP confluence and imbalance.
TLDR;
Bitcoin sold off hard, but the data says the low was bought. Spot A/D started rising while price was still making new lows, funding turned negative and price reclaimed above the wick, which tells us real buyers stepped in while shorts stayed in their positions. Now price is climbing back toward 107k to 108k where a weak high and the April AVWAP are waiting, so that is the first place the market can decide if this recovery is just a bounce or the start of a squeeze. If buyers keep showing up there and we push through, the path above is thin and the next real pocket of liquidity, AVWAP confluence, imbalance and even the golden pocket of the earlier move all sit together around 117k to 118k. That is why this recovery matters. It is not just candles going up. It is positioning, spot flow and liquidity all lining up.
If you enjoy this type of analysis or find it helpful, leave a like or drop a comment. I don’t ask for anything in return — I share this to help traders understand what’s really happening behind the charts. It also helps me see if people actually read and value these breakdowns, so if it helped you, let me know below.

Final 2025 Forecast for BTCUSDT 18th November 2025 (Updated)Short term pump to ~$94k (this week), dump in or around New Moon (20th November) down to ~$84k for a bottom in or around Black Friday (28th November) for one of two scenarios to play out;
1. Dead Cat Bounce Pump (Red Line)
Pump to ~$108k only for it to dump to confirm bear market
2. Final Pump to ATH (Green Line)
Target #1 $140k-$145k,
Target #2 $170k-$175k
Target #3 $200k-$205k

BITCOIN BTCUSDTBITCOIN ,the supply roof is around 101.7k-102k-103k.on daily time frame we had a strong daily break of demand floor and on technical ,we are calling for retest and the expected retest zone is likely to be around 101k-103k and bearish confirmation on 15min will be needed for sell order.
the direction of BITCOIN price action has changed from our trading pattern.
the next support could be around 74k-70k zone based on the structure .
BITCOIN FUNDAMENTAL.
Bitcoin is the world's first decentralized cryptocurrency, launched in 2009 by an unknown person or group using the pseudonym Satoshi Nakamoto. It allows peer-to-peer transactions without relying on banks or central authorities. Bitcoin transactions are recorded on a public ledger called the blockchain, which is maintained by a network of computers (miners) that validate and secure transactions through cryptographic proofs.
What is Bitcoin?
Bitcoin is a digital currency that enables secure and transparent transfers over the internet.
Not owned or controlled by any single entity—it operates on a decentralized network.
Uses blockchain technology to maintain a permanent, public transaction record.
Supply is capped at 21 million coins, making it a scarce, deflationary asset.
Network Security and Hash Rate: The computing power devoted to mining, indicating network strength and resilience.
Transaction Volume and Adoption: Growth in users, wallets, and real-world usage reflect demand.
Supply Schedule: Bitcoin’s issuance halves roughly every four years, reducing new supply and potentially driving scarcity.
Institutional Interest: Investment flows from funds, corporations, and ETFs show confidence and liquidity.
Regulatory Environment: Legal clarity or restrictions impact market sentiment.
Macro Factors: Inflation trends, fiat currency strength, and geopolitical uncertainties influence Bitcoin as a store of value or risk asset.
Summary
Bitcoin is a decentralized digital currency secured by cryptography and maintained on a blockchain network. Its fundamentals include the network’s security, supply scarcity, adoption rates, institutional interest, and macroeconomic influences, all of which shape its price and long-term value proposition.
GOODLUCK.

$BTC Daily Structure Update!CRYPTOCAP:BTC Daily Structure Update – Trendline Lost, Eyes on 92–93K Support!
Bitcoin has officially broken below the daily trendline support, confirming a shift toward further weakness in the current market structure. This breakdown increases the probability of deeper retracement levels being tapped before any meaningful bounce.
🔹 Key Levels to Watch
▪️ 92K–93K Support Zone
Price is currently heading toward this first major support area. This zone aligns with previous demand and could offer a short-term reaction.
▪️ 0.5 Fibonacci Level (≈87.5K)
If 92K–93K fails to hold, the next magnet is the 0.5 FIB retracement zone. Historically, BTC respects the 0.5 retracement during mid-cycle corrections, so this area is significant.
▪️ Fair Value Gap (FVG) – Targeting 85K
There’s a visible FVG left below, and structure now suggests a possible return to fill it. A long wick into 85K is absolutely on the table if momentum continues downward.
Comment your views and follow for more updates.


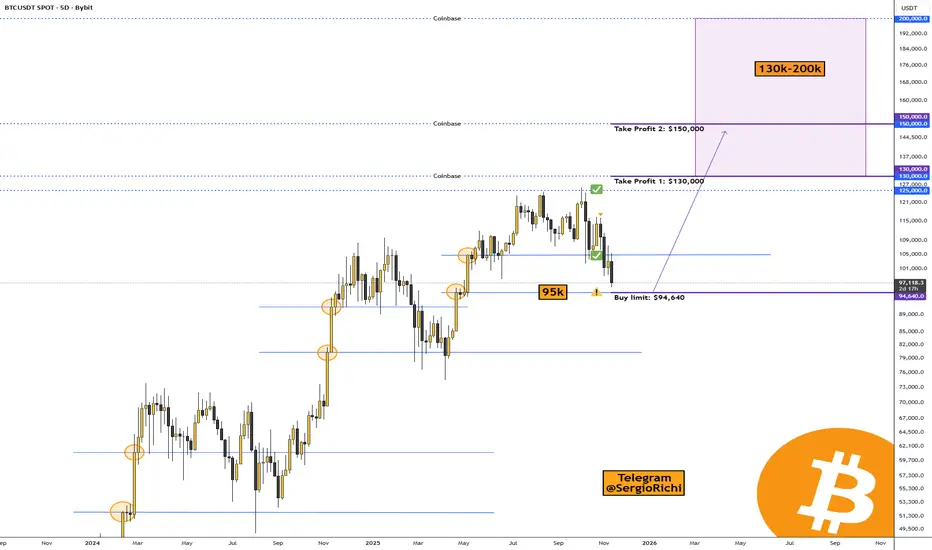
Bitcoin is approaching a key level at $94,640CRYPTOCAP:BTC #Bitcoin — Bitcoin is approaching a key level at $94,640.
The correction in the crypto market continues, and it's now starting in the US stock market.
Bitcoin is nearing an important level on the 5-day timeframe—specifically $94,640.
That's where market makers and big players have placed limit buy orders, and I think we'll see some major trader liquidations there too. For those who trade Bitcoin exclusively, I've marked a buy level.
• Buy limit: $94,640.
• Take Profit 1: $130,000
• Take Profit 2: $150,000
The range for wrapping up Bitcoin's cycle is pretty wide, since there are large orders set up there for taking profits. It's tough to pinpoint exactly where the price peak will be—we can only go by the data we can see.
• Coinbase: $130,000, $150,000, and possibly $200,000.
• Binance: $130,000, $150,000, and likewise, it's unlikely but possible to climb to $200,000.
Based on Elliott waves, we're finishing the 5th upward wave, and I figure the peak will hit in 2026, followed by a straight drop.
Indicator for Bitcoin miners:
The cycle indicator on Bitcoin shows the peak hasn't been reached yet:
Samuel Benner's Cycle and the 2026 Peak
The "200-year farmer chart," often referred to as Samuel Benner's Cycle Chart, is a historical economic forecasting tool created in 1875 by Ohio farmer and self-taught economist Samuel Benner.
It's credited with a "90% success rate" in broad sentiment prediction, and modern applications extend to stocks, crypto, and even solar cycles correlating with recessions.
It's best used as a sentiment gauge, not a precise timer.
Implications for 2026
The chart marks 2026 as a "B" year—a cycle peak in "Good Times," signaling high prices and a time to sell before transitioning to panic and hard times from 2026-2032.
This suggests a potential bull run peak, followed by downturn risks amid global debt, inflation, and geopolitics. As of late 2025, we're in a growth phase approaching this apex, per the model's extensions.
Dear friends, it looks like 2026 will mark the end of the growth cycle for Bitcoin and altcoins, so we'll need to find exit points, bail out of the crypto market, stock up on supplies for 3-5 years, and get busy building bunkers 😀🔥.
BTCUSDT: short 98888.8If we exclude random pumps and dumps, the market is currently suspended in uncertainty.
BINANCE:BTCUSDT.P neither breaks below the 100,678.0 support level nor bounces back from it — it simply grinds sideways.
A clear local level has formed at 98,888.0, from which BTC has bounced twice in the past two days.
Now, the price is gradually moving toward it again, indicating a short-biased sentiment.
This lack of clarity in BTC’s behavior keeps the entire crypto market frozen.
The only movements come from baseless pumps and dumps, emerging and ending at random points.
However, I believe clarity is approaching — BTC cannot stay in this tension forever.
It will either break upward or fall lower.
My analysis suggests the next move will be down, and that’s when we’ll see the real market move.
For now — we wait.
___
System first:
Every non-systematic profit is bad.
Every non-systematic loss is bad.
Every systematic profit is good.
Every systematic loss is part of the work.
Was this analysis helpful? Leave your thoughts in the comments and follow to see more.

The Power of One Setup: Variety Kills ConsistencyMost traders chase new strategies, indicators, and secret signals. Progress rarely comes from adding more. It comes from mastering one thing deeply.
The fastest path to consistency is one setup traded a thousand times, until execution becomes automatic.
Every setup has a rhythm. Market conditions, timing, management. When you rotate through styles, you reset the learning curve repeatedly.
Specialization compresses uncertainty. You see the same context, the same triggers, the same mistakes, which tightens execution and accelerates feedback.
Switching setups leads to inconsistent entries, inconsistent risk, and mixed data. You cannot tell what actually works because the sample is polluted.
Professionals remove variables. They keep the market changing while the method stays constant.
Turn the setup into a rulebook.
• Market conditions: trend, range, volatility threshold, session.
• Structure: levels, pattern shape, invalidation logic.
• Entry: trigger candle, confirmation, timing window.
• Risk: stop location, size per trade, max daily loss.
• Management: partials, move to break even, trail or fixed target.
Mastery does not come from more information. It comes from repetition and refinement.
You do not need more strategies. You need fewer distractions.

BTCUSDT - The manipulation Festival!Bitcoin has already formed a rising wedge pattern, broke it downward after retesting it, and continued falling, even breaking below 100K just like you wanted? There’s also a death cross forming on the chart… and from here I’ll just sit back and watch the manipulation festival.
Bitcoin never forms a bearish pattern and hits its targets the way people expect — not until it wipes out every type of trader first. And look at the candlestick formation I predicted; Bitcoin followed it exactly, to the millimeter, on the 3-day chart.
The idea that Bitcoin is actually bearish and will drop more than this is a joke to me — something absurd. What about the people who have been holding short positions for the past 10 days? Nobody’s going to ask about them?
It’s their turn now, of course… You’ve taken your profit and now you’re greedy for more downside?
Come on, let’s liquidate all of you the same way we liquidated the long positions earlier, and the same way spot traders got shaken out. Let’s make everyone lose hope and exit the market.
The market is built on manipulation, and technical analysis is just a tool to understand where that manipulation happens — nothing more.
Study my candlestick projection carefully, because that’s exactly what’s going to happen in the coming days. And remember what I said.
Best Regards:
Ceciliones🎯

Bitcoin Breaks Below $100,000 – The Downtrend Isn’t Over Yet!Bitcoin is entering one of its most vulnerable phases of the quarter, as both fundamentals and technicals strongly point toward a continued downside. The break below the psychological $100,000 level has triggered a wave of widespread fear , pushing the market firmly into defensive mode.
Recently, ETF outflows have accelerated , with institutional funds pulling out more than $3.4 billion since October. At the same time, expectations for a Fed rate cut in December have weakened , while the U.S. Dollar rebounds , adding more selling pressure across the crypto market. The Fear & Greed Index plunging into “Extreme Fear” highlights how fragile and cautious overall sentiment has become.
On the chart, the downtrend is now unmistakable. Price continues to move within a descending channel , repeatedly getting rejected at the upper trendline. The $100,000 level has flipped into strong resistance . Without substantial buying pressure, BTC is likely to rebound only slightly into the $100,000–$102,000 zone before sellers step in again.
The most probable short-term scenario: BTC trades weakly, makes a small bounce into resistance, then continues sliding toward the $90,000 support zone. If this level breaks, the next destination sits near $87,600, where major support aligns with the bottom of the channel.
Given the negative news flow, weak liquidity , and bearish technical structure , the dominant trend remains to the downside. This is not an ideal moment to attempt bottom-picking—at least not until the market shows genuine signs of recovery or institutional capital begins flowing back in.

BITCOIN SIGNAL: IS THIS THE END OF BITCOIN CYCLE??!!!(get ready)Yello Paradisers! Enjoy the video!!!!!
And Paradisers! Keep in mind to trade only with a proper professional trading strategy. Wait for confirmations. Play with tactics. This is the only way you can be long-term profitable.
Remember, don’t trade without confirmations. Wait for them before creating a trade. Be disciplined, patient, and emotionally controlled. Only trade the highest probability setups with the greatest risk to reward ratio. This will ensure that you become a long-term profitable professional trader.
Don't be a gambler. Don't try to get rich quick. Make sure that your trading is professionally based on proper strategies and trade tactics.

THE TOP: Bitcoin is at its top. Enjoy.The fibs line up with the waves. We might be up for a fakeout then a massive dump.
Be careful and goodluck trading. Take profit and sit back. Dont lose everything back.

TradeCityPro | Bitcoin Daily Analysis #220👋 Welcome to TradeCity Pro!
Let’s move on to the Bitcoin analysis. The market continues its downward movement, and yesterday it recorded another bearish leg.
⏳ 1-Hour Timeframe
If you remember, yesterday we drew a bearish structure for Bitcoin with a bottom at 10,1302, which we could use as a trigger for a short position.
⭐ After that level was broken, a new downward move began, and the RSI entering the oversold zone added even more bearish momentum to the market.
✔️ As a result, the price managed to drop below the 9,9631 level in its first move. After a pullback to this zone, Bitcoin has now started another downward leg.
📊 Volume has been increasing throughout this bearish movement, and the RSI is once again approaching the oversold area, meaning that if it enters this zone, the current leg is likely to continue.
⚡️ We can also draw a curved trendline on Bitcoin’s chart, from which the price was rejected yesterday. The price is currently far from that line, but if a correction occurs, this trendline could act as a dynamic resistance. The static resistance zone is at 9,9631.
🎲 For today’s trading setup, the short trigger is at 9,7117, though it’s quite risky and has a high chance of being a fakeout. However, if market momentum remains bearish, this trigger can still be suitable for a short entry.
💡 If you already have open short positions, there’s no need to open new ones using this trigger — your entry is already at a good point. For profit-taking, you can use Dow Theory’s trend reversal signals to guide your exits.
❌ Disclaimer ❌
Trading futures is highly risky and dangerous. If you're not an expert, these triggers may not be suitable for you. You should first learn risk and capital management. You can also use the educational content from this channel.
Finally, these triggers reflect my personal opinions on price action, and the market may move completely against this analysis. So, do your own research before opening any position.

Accurate for 36 days straight!This is what it looks like to be accurate for 36 days!
Whilst X(twitter) cries about the sellers and bears,
Yup, I called this downtrend 5 weeks ago

Check for support near the M-Signal indicator on the 1M chart
Hello, fellow traders!
Follow me to get the latest information quickly.
Have a great day.
-------------------------------------
(USDT 1D Chart)
(USDC 1D Chart)
USDT is the major currency that influences the coin market.
The USDT and USDC charts are moving in opposite directions.
This decline appears to be driven by funds flowing out of USDC.
Once the USDC gap decline stops, funds flowing in through USDT are expected to drive the coin market higher.
-
(USDT.D 1M Chart)
For the coin market to show an upward trend, USDT dominance must remain below 4.91 or show a downward trend.
We need to see if the price can face resistance around the Fibonacci level of 0.618 and turn downward.
If not, we should consider a response plan, as a rally toward 7.13 is expected.
-
(BTC.D 1M chart)
For an altcoin bull market to begin, it must either remain below 55.01 or show a downward trend.
Therefore, for the bull market we're waiting for to occur, both USDT dominance and BTC dominance must decline.
If USDT dominance declines while BTC dominance rises, a bull market will emerge, with only BTC rising.
--------------------------------------------------
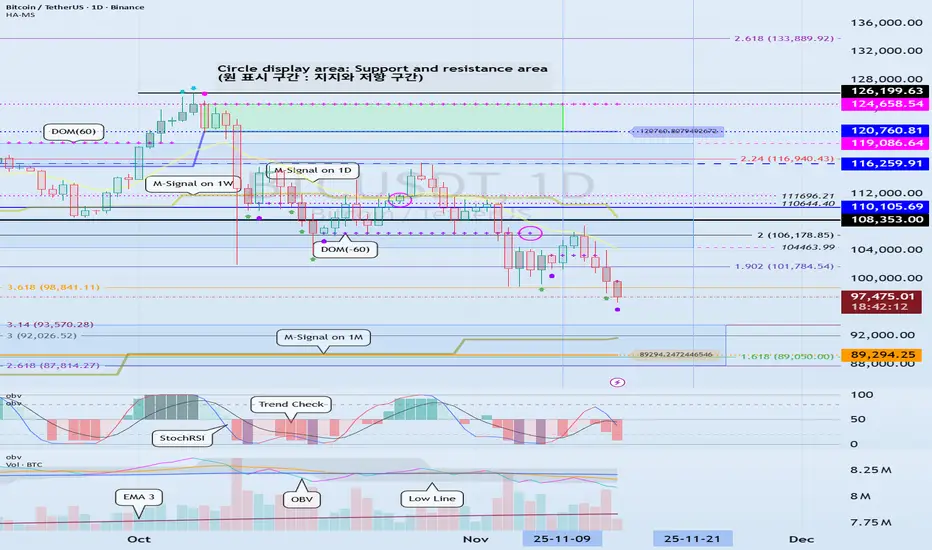
(BTCUSDT 1D Chart)
The key is whether the price can touch the M-Signal indicator on the 1M chart and turn bullish.
At this point, it's crucial to maintain the price above 89294.25.
If not, a step-down trend is likely.
To turn bullish, the price must remain above the M-Signal indicator on the 1W chart.
At this point, it's crucial to maintain the price above the newly created HA-High indicator point of 110105.69 on the 1M chart.
If not, the price may pretend to rise but then fall again, so you need to consider countermeasures.
This is a basic trading strategy within the box range: buy between DOM(-60) and HA-Low and sell between HA-High and DOM(60).
If the price rises in the HA-High ~ DOM(60) range or falls in the DOM(-60) ~ HA-Low range, you should switch to trend trading.
To do this, we should consider the movements of the StochRSI, TC (Trend Check), and OBV indicators.
To sustain the uptrend after breaking above a key point or range, the StochRSI, TC, and OBV indicators must show upward trends.
At this point,
1. The StochRSI indicator should not have entered an overbought zone.
2. The TC indicator should remain above zero.
3. The OBV indicator should remain above the High Line.
Therefore, check the movements of the StochRSI, TC, and OBV indicators at the support and resistance levels depicted on the 1M, 1W, and 1D charts and consider whether you can trade accordingly.
Based on the current price range, the key points or ranges are:
- 87814.27-93570.28
- 110105.69
- 120760.81-124658.54
I believe the three ranges above are important points or ranges.
Therefore, when the price is near these ranges, you should check the movements of the StochRSI, TC, and OBV indicators to determine a response plan.
-
Thank you for reading to the end.
I wish you successful trading.
--------------------------------------------------
- This is an explanation of the big picture.
(3-year bull market, 1-year bear market pattern)
I will explain in more detail when the bear market begins.
------------------------------------------------------
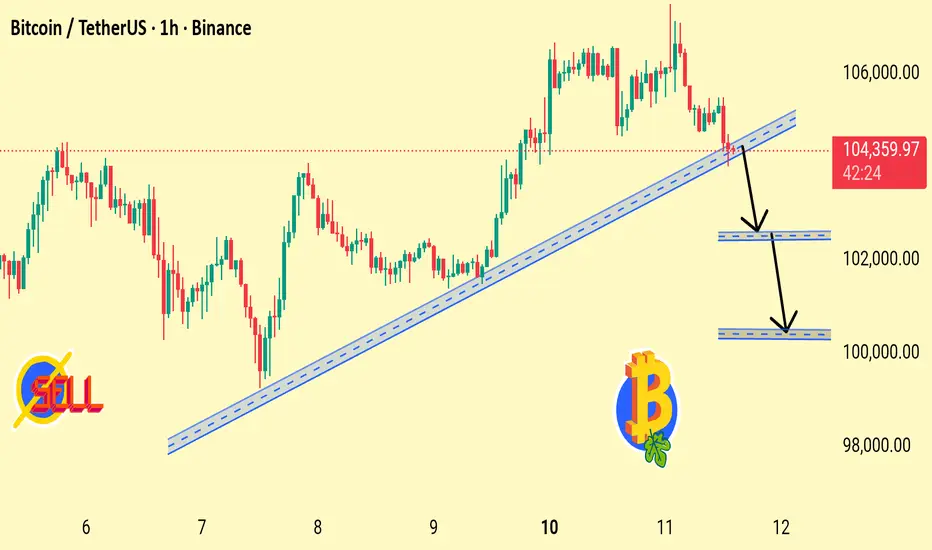
Bitcoin Losing Trendline Support Possible Drop Toward Key DemandBTC has broken below the rising trendline, signaling weakening bullish momentum. Price may retest $102,500 and potentially dip toward the $100,000 support zone if sellers continue to dominate.
1. Trendline Break Detected
BTC has fallen below the rising trendline that supported the uptrend from Nov 7–11. This signals weakening bullish structure.
2. Momentum Turning Bearish
The rejection near 105,000 and sharp drop indicate sellers are stepping in aggressively.
3. First Support Zone: $102,500
Chart shows the first demand zone here. If BTC stabilizes above this level, a bounce is possible — but weakness still remains.
4. Second Support Zone: $100,000
A deeper drop could test the psychological round number. Strong liquidity is expected at this level.
5. Trend Structure Changing
Breaking the trendline + lower highs = possible shift from bullish to short-term bearish trend.