Bitcoin $BTC price analysis we need your vote !💥 Final “dip” of November?
💰 Will CRYPTOCAP:BTC drop to $91,600
to close that old GAP on the chart? 🤔
🟢 Bullish case: $100K holds → next rally begins.
🔴 Bearish case: gap fills near $91,600 → possible reversal after.
What do you think — final washout or just a pause before the next move?, vote at comments
______________
◆ Follow us ❤️ for daily crypto insights & updates!
🚀 Don’t miss out on important market moves
🧠 DYOR | This is not financial advice, just thinking out loud.
Trade ideas

TradeCityPro | Bitcoin Daily Analysis #218👋 Welcome to TradeCity Pro!
Let’s dive into the Bitcoin analysis. Today, the market has started another upward move.
⏱ 1-Hour Timeframe
Yesterday, after breaking the support zone, Bitcoin made a downward move to the 10,2489 level. Now, it has started another upward movement.
The price is currently facing resistance at the 10,5020 level, and as you can see, it has experienced a strong rejection from this level, which has caused the bullish momentum to fade from the market.
This rejection at the 10,5020 level makes it a very important zone. If this level is broken, it will act as a strong trigger for a long position.
The first trigger for a long position:
The first trigger for a long position is the 10,5020 level. The next main trigger, which is our primary long trigger, is at 10,6644.
For a short position:
If the downward momentum continues, we can open a short position when the 10,2489 level is broken.
However, as long as the price is ranging between 10,2489 and 10,5020, I prefer not to open any new positions.

RELOAD AT $85,100!?!?!?This looks like a beautiful place to reload from. Perfect laddering spot on the daily, 4hr and hourly TF. This is precisely where I'm going to max out at. Literally, come check this in a couple weeks and see what happens ;) EASY MONEY.


Weekly Bitcoin Analysis – Critical Decision Point Ahead!
Hey traders! Hope you're all enjoying your weekend! 🌞
Today I’m here with a fresh weekly timeframe analysis on Bitcoin. Let’s dive in! 📉📈
Over the past few weeks, sellers have shown massive strength, pushing Bitcoin down so aggressively that we even lost the $100K level 😮. Price is now testing the $94K zone, which aligns with the 0.618 retracement of the previous wave — a super important level for the market! 🔥
⚠️ What Happens Next?
This zone is where the market will make a major decision:
🔻 If the 0.618 level breaks:
-Expect continued panic selling
-Sharp drops toward $85K and potentially $78K
-Sellers will remain fully in control
🔹 But if buyers defend this zone:
-They’ll have one final chance to show strength
-We could see a relief move back to $100K–105K
-BUT… if price gets rejected there and forms a lower high on the weekly, the trend officially shifts bearish 📉
That’s where even major holders may start offloading their positions
🧠 My Advice
The market doesn’t have a clear trend right now, so:
👉 Risk management is EVERYTHING
👉 Avoid high-risk plays
👉 Wait for confirmation before jumping in
Let me know what YOU think about this setup! 💬
And if you enjoyed the analysis, don’t forget to hit that 🚀 rocket next to the chart and send it to the moon!
Stay profitable and stay smart! 💛📊
Are We All Bart Simpson Traders Now? (BTC Analysis)Ladies and gentlemen — Bitcoin has formed the Bart Simpson pattern three times in just two days! Nearly $300 million in liquidations later, and I bet a bunch of Simpson traders just paid their tuition.
But let’s look deeper.
On the 4H timeframe, after the first impulse and correction, it looks like another bearish leg has started — lower highs, lower lows, and weak volume on each pump. That’s a strong sign of bearish continuation.
The 101,381 support held nicely, but unless Bitcoin breaks above 104,751, I’ll personally stay focused on short setups.
Same trigger logic as before:
→ After a pump, wait for a range → watch for red candles with increasing volume → short it.
If there’s no volume on the drop, stay patient until support breaks with confirmation.
And remember: this isn’t the time to go all in. Lower your risk, take partial profits only if structure confirms, and let the market show its real direction.
Now get outta here

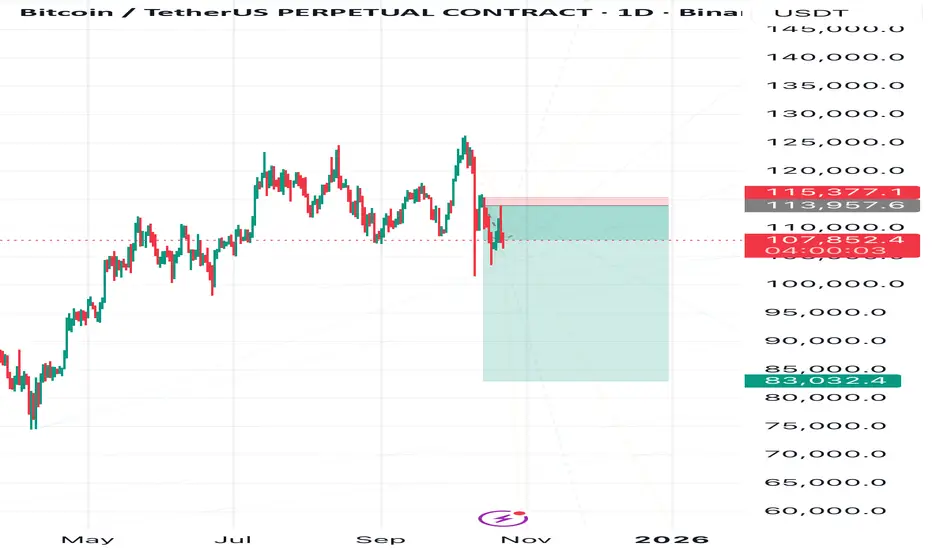
$BTC - Market UpdateBINANCE:BTCUSDT | 1D
In our November 12 outlook, we noted that if price formed another lower high and failed again below the 107k resistance, momentum could fade quickly. That scenario played out: Bitcoin broke below the 102k support and slid into the 89k zone.
From here, if the current low holds, the next area that must be reclaimed is 92–93k. Buyers need to step in, a move back below this level increases the risk of a breakdown toward the 84k–82k region.
If price can stabilize and build a base here, upside hurdles to watch are 96–97k, followed by 100k and 107k (swing point)

Bitcoin (BTC): Staying Below $100K | Looks Like Golden Buy Zone?Extreme fear is in the markets; people are losing hope and buyers are being taken out. Yet what we see is a similar pattern forming here, where the 100 EMA is a key zone for us currently.
Each time Oruce has had a dip, it was trading below the Bollinger Bands' middle line, where the bottom was marked near the 100 EMA, and as the price has reached very close to it, we are expecting to see some kind of reversal anytime soon.
If sellers take over the 100 EMA, then we will be officially in a bearish market, in my personal opinion, but as of now, we still have some time and a bullish sense.
Swallow Academy

BTC CURRENT DECODED ANALYSIS DECODED CURRENT ANALYSIS
Below $93,576 it has entered the danger zone ⚠️
An uptrend is only possible above $112,000 for the current year.
It is too early to test its quarterly support.
Quarterly support is noted to be tested in Q4 2026 at $62,772.02. If it tests this quarterly support before time, it will return to test it again in Q4 2026. If it declines further, then $48,000.
All above supports at 85K and 78K are weekly supports.
This message is for educational purposes only.
Always DYOR.


Winter Has Arrived — Bitcoin’s Chill DiveBitcoin’s chart looks frosty — I expect a decline toward 83,000.
The red zone on the chart marks the invalidation area, where my plan will be canceled if price reaches it.
I believe Bitcoin is entering a corrective phase, and the market might need a “cool down” before any new rally can start
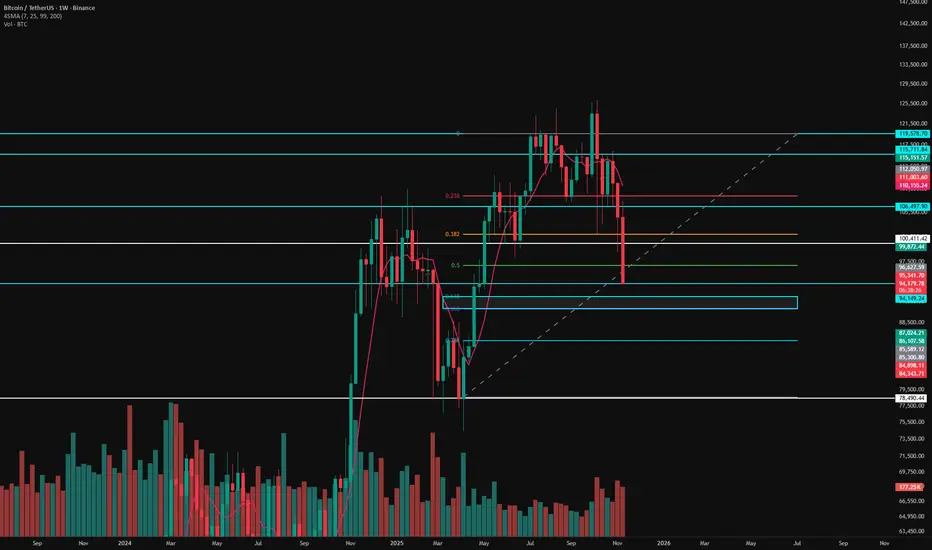
Don't miss this article !📊 Bitcoin (BTC/USDT) – Long-Term Technical Analysis (Weekly Chart)
This weekly chart presents a macro view of Bitcoin’s long-term bullish channel, spanning from 2016 to 2030. The price action is contained within a well-respected ascending parallel channel, showing consistent higher highs and higher lows over multiple cycles.
1️⃣ Macro Structure
Bitcoin has remained inside a major ascending channel for nearly a decade.
The midline (dashed) has acted as dynamic support/resistance across multiple bull and bear cycles.
The upper boundary of the channel has repeatedly capped bull-market blow-off tops.
The lower boundary has been a reliable bottoming zone during bear markets.
This channel continues to define Bitcoin's long-term bull trend.
2️⃣ Current Market Position (Nov 2025)
BTC recently reached the upper channel resistance (~124k) and faced rejection.
Price has now pulled back sharply by over 8% this week, trading around $95,966.
This correction places Bitcoin back near the 0.5 Fibonacci retracement (≈ $96,060) drawn from the recent swing low to the recent peak.
The market is currently testing this important mid-level support.
3️⃣ Key Support Levels
This Fib Ret starts from the beginning of uptrend after completing the cup and handle pattern .
✔ 0.5 Fib – $96,000 area
This area is currently acting as immediate support.
Historically, BTC often stabilizes around the 0.5 Fib during bull-cycle corrections.
✔ 0.618 Fib – $89,400
A deeper but healthy retracement within a bullish structure.
Confluence with a previous consolidation zone.
High-probability re-accumulation level.
✔ Major Channel Support – $68,000–70,000
This is the cycle-saving support zone.
If the market experiences a severe correction, this level would be a historically strong bottoming area.
4️⃣ Key Resistance Levels
✔ Local Resistance – $98,000–100,000
Previous structure support now turned into resistance.
Bulls must reclaim this level to resume upward momentum.
✔ Major Resistance – $124,000
Cycle top region based on the channel.
BTC was rejected strongly here recently.
5️⃣ Market Outlook
Bullish Scenario
If BTC holds the $96k support or stabilizes above the $89k 0.618 level, the structure remains strongly bullish. A rebound here could lead to:
Retesting $100k
Breakout attempt toward $124k
New macro highs if channel top breaks
The long-term channel suggests an eventual move toward $150k+ if momentum continues.
Bearish Scenario
If BTC loses $89k, especially on weekly closes:
Price likely gravitates toward the mid-channel zone around $70k.
This would be a deeper but still healthy correction inside the multi-year bull trend.
No major structural damage occurs unless Bitcoin loses the lower channel (~$60k).
6️⃣ Summary
Bitcoin remains in a macro uptrend supported by a decade-long ascending channel. The current correction is consistent with previous bull-cycle retracements. Key support levels at $96k and $89k will determine whether BTC resumes its upward swing or enters a deeper consolidation phase.
The long-term outlook remains strongly bullish, provided the channel structure holds.

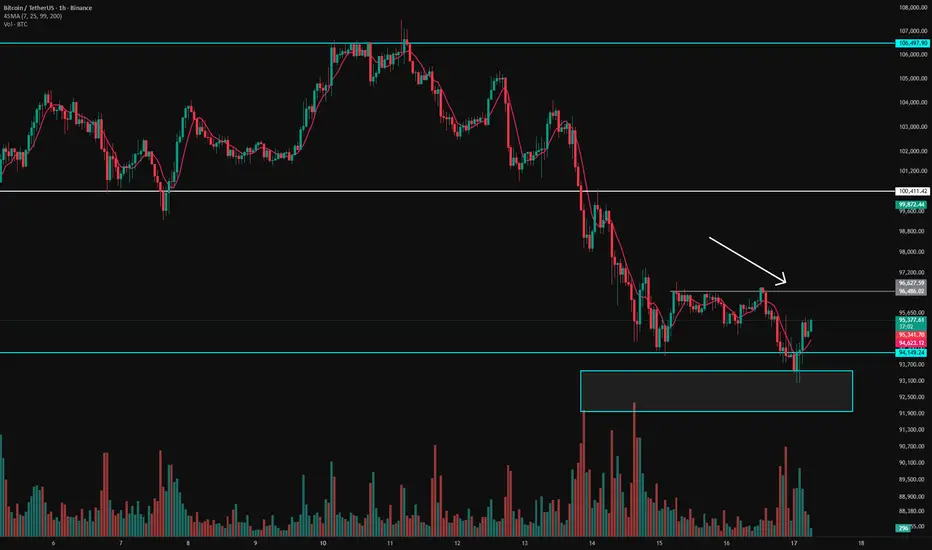
Bitcoin Daily Analysis – 1H Timeframe Breakout Watch!
Hello dear traders! Hope you’re having a great week so far and starting it strong! 🌟
Let’s break down today’s 1-hour Bitcoin analysis.
As you can see on the chart, BTC made a fakeout below the $94K level, and just like I mentioned in the previous analysis, this level is unbelievably important. If you haven’t checked that one yet, I strongly recommend taking a look — the conclusion was based on weekly support, resistance, and Fibonacci confluence. 📊✨
🔥 What Happened Today?
Even though sellers showed strong momentum with sharp-volume candles during the breakdown attempt,
they failed to reclaim $94K — buyers stepped back in and protected the level! 💪🟢
This is a positive sign for a potential short-term correction against the strong weekly downtrend we’ve been seeing.
BUT… higher timeframes still don’t give us a clean trend direction, so buyers must prove their strength once more.
That’s why I’ve marked a key level on the 1H chart:
➡️ $96,500
A break and 1-hour candle close above $96.5K could be the first real sign of a shift in structure — the first higher high + higher low setup on this timeframe. This level is important enough to justify a controlled, small-risk position.
⚠️ However… Be Cautious!
Short-term momentum still favors sellers, so it’s not a spot to take heavy risks.
I personally will use minimum risk if I take a position here.
📉 BTC Dominance (BTC.D) – Critical Factor
BTC dominance is super important right now.
Historically:
When BTC rises → Dominance drops → Altcoins pump harder 🚀
When BTC dumps → Dominance rises → Altcoins crash harder 💀
So it’s worth keeping an eye on alts during these moves.
🧠 My Personal Plan
I currently have one position on altcoins, and I will open another position on Bitcoin ONLY IF
➡️ 1H candle closes above $96,500
Why?
Because BTC dominance’s long-term direction is still unclear.
By splitting my risk between an alt and BTC, I increase my exposure without overleveraging or over-risking.
💡 My Recommendations for You
✅ First — NEVER trade without risk management.
✅ Second — This is NOT the time to take big risks.
Right now:
Monthly → buyers in control
Weekly → unclear
Daily → sellers in control
No side has a strong enough confirmation yet, so trade with caution.
Thanks for reading this analysis! 🌙
Always remember: the market has zero certainty. Your goal is to stay long enough in the game to build experience — that’s how you become consistently profitable.
I’d love to hear your thoughts in the comments below! 😊💬📊
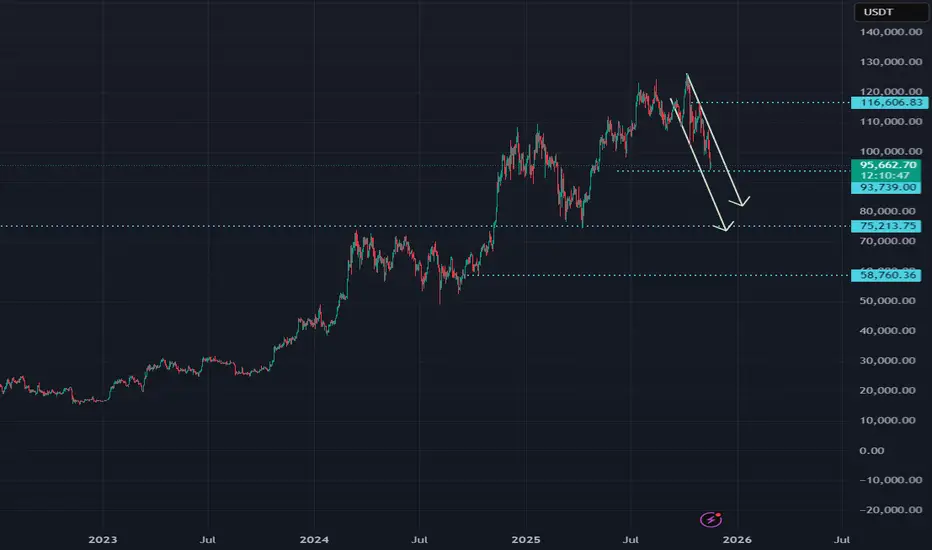
Bitcoin Downtrend UpdateAlright friends, Bitcoin has confirmed its intention to move toward 86,000 and lower.
My previous forecast with the invalidation zone at 96,600 is still valid, but I decided to make a fresh post.
At the moment, my new invalidation level is 96,012.5.
From a broader perspective, I’m still expecting Bitcoin to reach 83,000.
But as I mentioned earlier, we first need to see 86,000 tested — because once that level is hit, Bitcoin may go into a correction before continuing toward 83,000 and below.
Yes-yes, I do expect it even lower, but more on that in the upcoming updates.
Make sure to follow so you don’t miss them


Bearish BTC idea 17 Nov 2025The W BISI turns into an iFVG (rex box), I want to see price find resistance at the iFVG and then distribute toward the W BISI below (blue box).

Analysis on Bitcoin: hit first targetDear all
currently, bitcoin is more about downward bias.
here are the significant level that you should take action.
whether to cut, short, long, sell.
first sup = 94k
second sup = 75-77k
third sup = 58-60k
personally, they should not fall below 58k,
best of luck
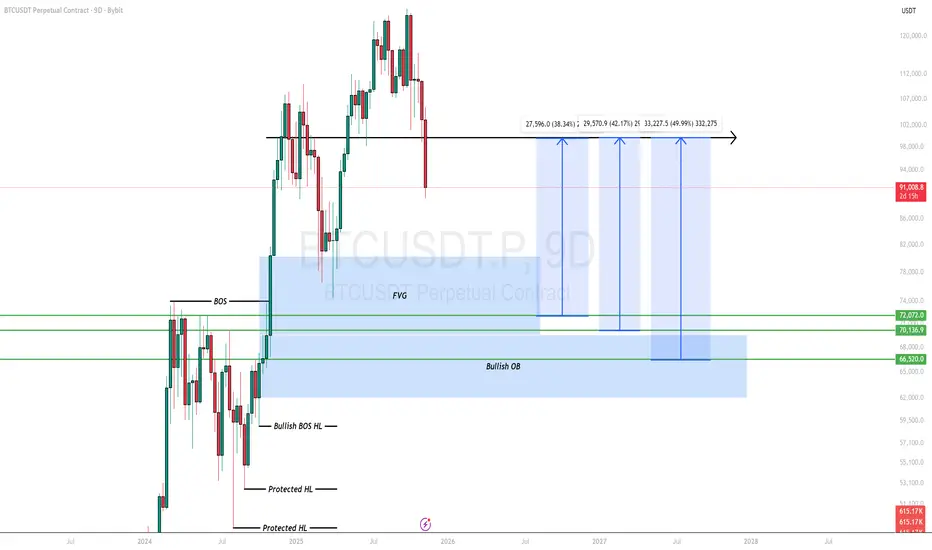
Probable Bullish Reversal Levels For BTCUSDT.The price levels BTC is likely to have a bullish reversal from provided there is no market manipulation.
📌 $66,520
📌 $70,136
📌 $72,072
Trade safe and smart.
Bitcoin Roadmap => Short-termOver the past few days, Bitcoin ( BINANCE:BTCUSDT ) has been reacting quite sharply to recent news, showing some unexpectedly strong moves. So, first and foremost, it's a good idea to keep risk management in mind and be prepared for various scenarios .
At the moment, Bitcoin is approaching a Support zone($102,000,980-$96,880) , a Potential Reversal Zone (PRZ) , and a Cumulative Long Liquidation Leverage($99,900-$98,188) .
From an Elliott Wave standpoint, it appears that Bitcoin is completing a Zigzag correction(ABC/5-3-5) .
I expect that from this Potential Reversal Zone (PRZ) and the Cumulative Long Liquidation Leverage($99,900-$98,188) , Bitcoin might start rising again and could potentially reach around $105,171(First Target) .
Second Target: $107,291
Stop Loss(SL): $98,797
Cumulative Short Liquidation Leverage: $108,582-$106,850
Cumulative Short Liquidation Leverage: $112,590-$111,459
Please respect each other's ideas and express them politely if you agree or disagree.
Bitcoin Analysis (BTCUSDT), 1-hour time frame.
Be sure to follow the updated ideas.
Do not forget to put a Stop loss for your positions (For every position you want to open).
Please follow your strategy and updates; this is just my Idea, and I will gladly see your ideas in this post.
Please do not forget the ✅' like '✅ button 🙏😊 & Share it with your friends; thanks, and Trade safe.

BTCThis is the next major move for $BTC. In my view it will print an inverse head and shoulders pattern. Shorts will stack near support expecting a breakdown, but a massive bear trap is likely. The previous bull and bear traps on the chart highlight the same behavior.

Bitcoin Whales are in again + Stop loss of 100K buyer hitTwo significant market developments warrant attention. First, on-chain data indicates substantial accumulation by large-scale investors, as spot prices have reached multi-month lows, creating what these entities often perceive as value zones. Second, Bitcoin's recent test of the key $100,000 support level triggered a substantial liquidity event, liquidating over-leveraged long positions around this psychologically important threshold.
This confluence of strong institutional buying pressure beneath a major support level, combined with the absorption of sell-side liquidity through stop-loss executions, establishes favorable conditions for a potential bullish reversal. Accordingly, we have initiated a long position with a disciplined 1:3 risk-to-reward ratio, anticipating upward momentum toward our predefined technical targets.
DISCLAIMER: ((trade based on your own decision))
<<press like👍 if you enjoy💚

Bitcoin’s Five-Wave Peak and What Comes NextIt seems that Bitcoin’s price action over the past two years has more or less completed a full five-wave advance. At the same time, even though each push upward made new highs, the RSI didn’t confirm those highs. This kind of divergence is often seen as a classic sign of fading momentum — the market looks strong on the surface, but the underlying buying pressure is no longer keeping up.
Based on common market structures, once a five-wave cycle finishes, the market often shifts into a three-part corrective pattern, known as an ABC correction.
Overall, Bitcoin may still see some short-term bounces, but the broader rhythm feels more like the start of a digestion or consolidation phase rather than the immediate beginning of a new bull cycle.
As for how things will ultimately unfold, we’ll have to let the market reveal the answer in its own time.

#BTC – Isn’t it time to buy?#BTC – Isn’t it time to buy? 🚀
By analyzing market structure and outside news, BTC is approaching the zone where I’d seriously consider entering .
📍 88k–76k is the key range I’m watching for potential buys, aiming for 15–40%+ profit with a 15% stop los s.
⚡️ Important: Wait for LTF entry sign – don’t jump in blindly . Always do your own research before making a move.
#CryptoTrading #Bitcoin #BTC #ScalpTrading #CryptoAnalysis #BTCScalp #CryptoStrategy #TradeSmart #HODL #BitcoinAnalysis
