BTC Slips Below 50 EMA: Caution RequiredThings could get uglier as CRYPTOCAP:BTC has now broken below the 50 EMA, a key long-term dynamic support level.
This breakdown signals growing weakness and may open the door for deeper downside if buyers don’t step in soon.
DYOR, NFA
Trade ideas

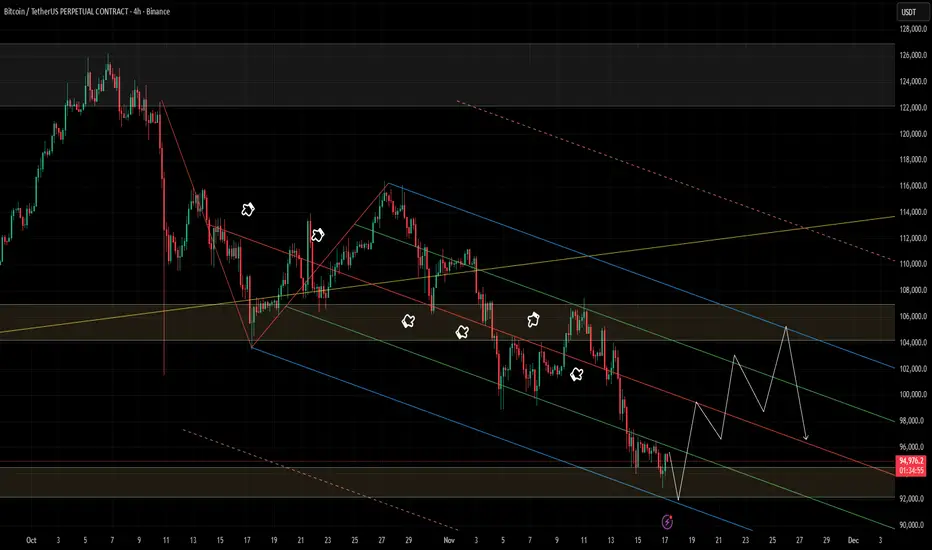
Bitcoin price forecast, short-term BTC chart analysisResistance line: Represented by a red diagonal line indicating a downtrend, suggesting that the price may struggle to break above this level.
Support line: A green horizontal line at the bottom of the chart, marking the support area where a recent W pattern formed, currently around 99K.
CME gap: Highlighted in yellow at the center of the chart, representing a short-term resistance area.
Parallel channel: Formed by two gray diagonal lines, illustrating the range within which the price is likely to move.
POC (Point of Control) line: A red line cutting across the center of the chart, representing the price level with the highest trading volume. Currently around 110,000 USDT, it can serve as a key support or resistance level.
Liquidity zone: The area where the POC line near 110,000 USDT overlaps with the upper boundary of the parallel channel, indicating a zone of highest expected liquidity. This is where short stop losses and long take profits are likely to cluster.
Predicted path: Shown in green, suggesting the price may bounce off the support line, rise along the parallel channel, break through the CME gap, and move toward the liquidity zone. If it breaks the red resistance line, the ascent toward the liquidity zone could accelerate.
Conclusion: Bitcoin is expected to gradually rise as it overcomes resistance levels, ultimately reaching the high-liquidity zone around 110K–112K. This analysis is based on current market conditions, and actual price movements may differ due to various market factors.

BTC Weekly Update | Still in Uptrend – Next Target 140K to 150KIn the start of 2025 (10 Feb), I shared a #BTC analysis when Bitcoin was trading around 95K, and our buying zone was clearly mentioned between 86K – 79K.
#BTC perfectly touched this zone and gave over 100% return!
Our position is still active and in strong profit.
Now, once again on the weekly timeframe, #BTC is showing a potential AB=CD pattern formation.
Currently, #BTC is moving within the Fibonacci golden zone (0.382–0.5), testing the trend line, and testing the EMA 50, theses are strong technical confluence zones for a bullish continuation.
Spot Trade Plan:
We will accumulate #BTC at CMP (Current Market Price).
Futures Trade Plan:
For confirmation, we will wait for:
A bullish candle on the 1D timeframe
A bullish divergence on the 4H chart
A clear breakout of the resistance zone
Once confirmed, we’ll look for a long setup with proper risk management.
Trend Outlook:
#BTC remains in a strong uptrend, and the next potential target zone could be around 140K – 150K if bullish momentum continues.
What’s your view on #BTC — are you bullish or expecting a deeper correction? Drop your thoughts below!
#BTC #Bitcoin #Crypto #BTCUSD #CryptoAnalysis #TechnicalAnalysis #TradingView #Bullish #ABCDPattern #Fibonacci #Uptrend #EMA50

MTOPS AI Nails Another Market Move – Unmatched Accuracy Absolutely blown away by how MTOPS AI called the latest price action on BTC/USDT—once again, it predicted the move ahead of time. If you’re serious about catching these trends before everyone else, it’s time to see what this model can do. This level of consistency and foresight is unreal.
#CryptoAI #Trading #PredictiveAnalytics

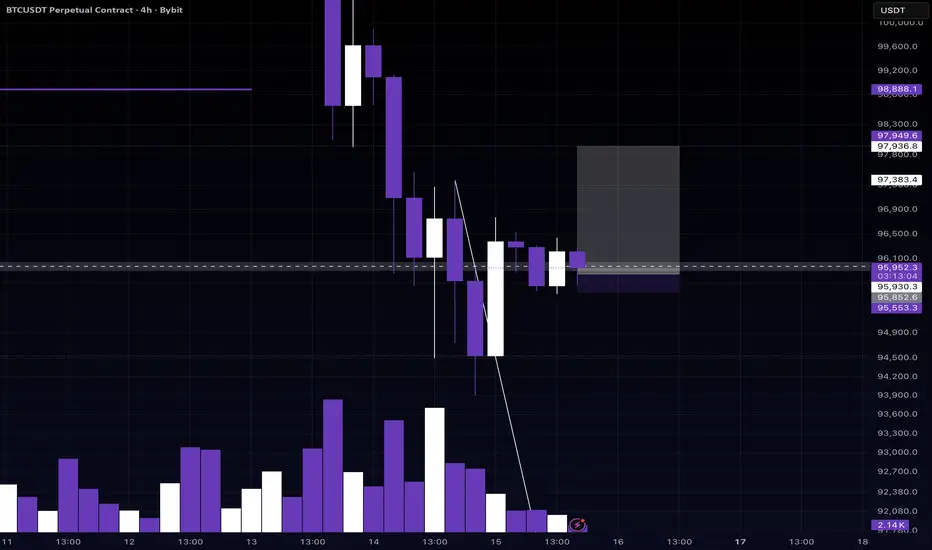
Trading Alert (BTC)4h +Trading Alert
• Watch for a long trigger when price reaches the green support zone and the green circle
• Add to your scalp sell watchlist if price approaches the black resistance area
• Targets should be evaluated in accordance with scalping rules and risk management
✅ Good luck and stay sharp!

Bitcoin Bear Market This is just the general idea of whats coming for BTC the coming years. 40k zone will be the floor for this bear market.

BTC — Weekend Recovery? (Because Why Not)Alright, here’s the situation:
I still think BTC has room to slide lower…
BUT a little weekend recovery bounce is totally on the menu too. 🍽️
And honestly — if we’re gonna try something slightly questionable,
the weekend is the perfect time.
Low liquidity, no ETF outflows, no institutional adults in the room…
Just pure, unfiltered crypto chaos. 😌
So yeah, let’s poke the market and see if BTC wants to behave.
Could we catch a nice weekend bounce?
Could it dump straight through the floor instead?
Absolutely on both counts. 😅
Let’s see. Stay safe degens. 🧡📉🔥
BTC Adam & Eve PatternLooks like on the 12 hour BTC has an Adam & Eve pattern. The height of the arch is the potential downside. So if it plays out, it looks like 74k is possible.

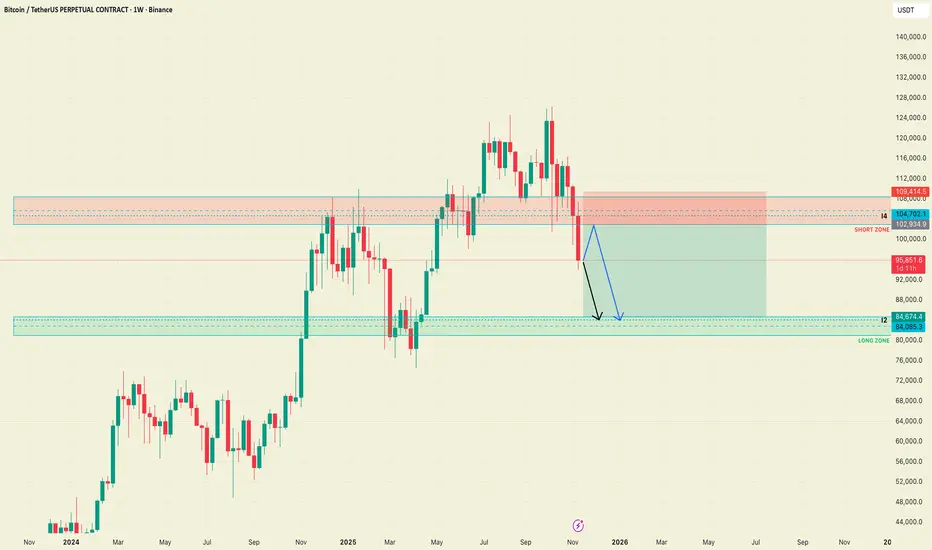
BTC after reaching the targets from the previous analysis After reaching the targets from the previous analysis, I see two possibilities from a weekly timeframe:
Either the price directly drops to $84,085, or BTC makes a pullback to values between $102,934 and $104,702, from where I would look for a short position towards $84,674.
My trading plan would be:
Entry: $102,934.9
SL: $109,414.5
TP: $84,674.4
RRR: 2.82
BTCUSDT -- Is 98K a key level??BTCUSDT -- Is 98K a key level and we see another ATH or we already hit the top of this cycle?
I would like some insights from expert and experienced traders here.

BTC next cycle BTC next cycle simple Pa+Fair value analysis
Acumulation range $35-55k
3-4 Year target $444k
7-10 Year target $1M

Standard points for such a structure in Ichimoku clouds.So, here are three rebound scenarios on the 1-week chart.
1. A favorable rebound from the cloud angle. This often occurs when an uptrend continues. The price tests the cloud angle (Senkou Span A), finds support there, and begins to rise either the following week or in 2-3 weeks.
2. Structure protection. As long as prices are above the cloud and even within the cloud itself, the structure is not completely broken. We have seen rebounds from the lower border of the cloud (Senkou Span B) more than once in this market, which is technically possible as long as the Kijun and Tenkan lines have not crossed this very border. If this border is touched, the price should rebound immediately if it is still an uptrend.
3. Breakout. All I can say here is that there is a 99% chance that it will be stopped at the historical ceiling of 69,000, and further information will be needed.

Strong rebound is imminent, Don't miss it📊 In days when everyone is talking about a 60,000k BITCOIN, the chart is showing something completely different.
👉 From a classical perspective, the price has touched a very critical trendline and is currently moving right above it.
📥 From an Elliott viewpoint, BITCOIN is in wave 4 of 5. This wave 4 has turned into a complex correction, and the price has now hit the critical 1.618% level, from which we’ve seen a solid rebound.
🔰 As long as the price remains above 94k , BITCOIN trend is bullish and there’s absolutely no reason to worry.
📈 I expect a strong bullish move from the current area toward 140k as a typical target and 167k . I definitely don’t want to miss this golden buying opportunity

Final 2025 Forecast for BTCUSDT 18th November 2025 (Updated)Short term pump to ~$94k (this week), dump in or around New Moon (20th November) down to ~$84k for a bottom in or around Black Friday (28th November) for one of two scenarios to play out;
1. Dead Cat Bounce Pump (Red Line)
Pump to ~$108k only for it to dump to confirm bear market
2. Final Pump to ATH (Green Line)
Target #1 $140k-$145k,
Target #2 $170k-$175k
Target #3 $200k-$205k

BTCUSDT.P - November 6, 2025BTCUSDT is currently consolidating above a rising trendline, with potential breakout zones at $104,496 for a bullish move targeting $106,659, or below $102,684 for a bearish continuation toward $101,164. The setup suggests a breakout-driven trade depending on which level is breached first.

Bitcoin | 3 Hrs | Long | Target: 107kThis technical analysis is for informational and educational purposes only. It does not constitute financial advice. Remember to always research and consult with a professional before making investment decisions. Good luck! 📈💼🚀

17/11/25 Weekly OutlookLast weeks high: $107,526.18
Last weeks low: $93,034.53
Midpoint: $100,280.35
Bitcoins downtrend continues as price reaches a 6-month low of $93,000. This price action came as a result of a failed attempt to flip the $107,000-$108,000 level, as this area rejected the bears gained momentum sending BTC sub $100k big even level and the most worrying part of all for the bulls losing the $97,000-$98,000 level. On the Higher timeframes this new lower low sets up for a trend shift. Should any reaction from the bulls fail to flip the weekly high and rollover, I would then have confirmation of a bearish trend and trade accordingly.
Despite the US Government shut down coming to an end, it appears this has not been enough to get the market in a risk-on mood, at least not yet. This compounded with Nvidia earnings in midweek and the larger question mark about the AI industry as a whole has meant buyers are just not will to step in yet. My opinion is that IF Bitcoin trades into the $89,000-$92,000 area that is where support may be found, that's because we have an area of imbalance that broke the previous downtrend in April earlier this year during the tariff war.
This week I expect Wednesday 19th November to be a day of volatility, and some formation of a local bottom in Bitcoin, at least in the short term.
Good luck this week everybody!

BTC Daily View 17.11Hey friends! How’s your trading week starting off?
In my last Bitcoin post, I shifted my invalidation zone from 96,600 to 95,545 and said that if 95,545 breaks, then 96,600 won’t hold either.
Well… it broke — so I revisited the chart.
Now I think the correction after the drop should be bigger than I first expected.
For now, I’m looking at a move up toward 98,400, and then a possible continuation of the downtrend.
I still see two paths — along the orange and purple arrows.
❌ Invalidation zone: 94,850
⚠️ Not financial advice — just sharing my view.
Trade your own plan, always use stops.
⭐ Follow for updates
💬 Drop a reaction in the comments!

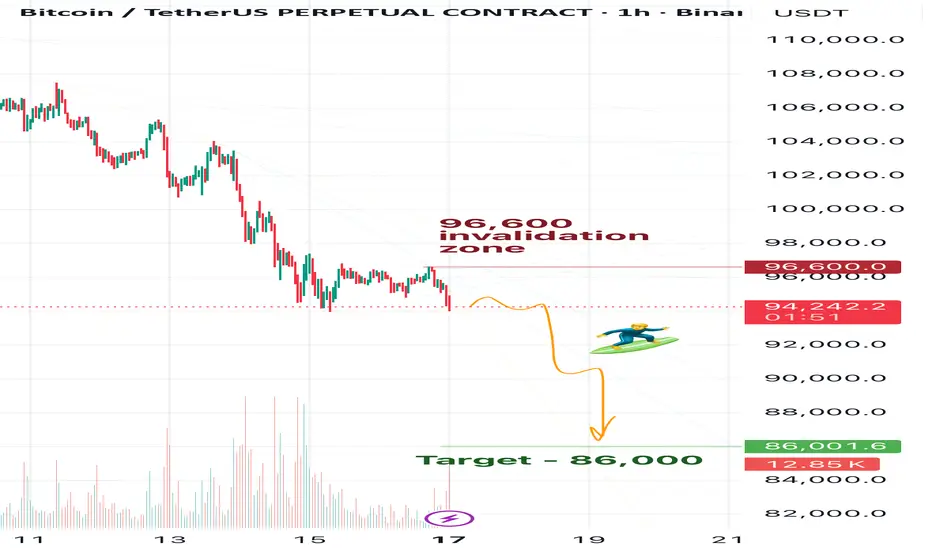
BTC Daily View 17.11Friends, as you may remember from my previous Bitcoin updates, I’m expecting BTC to reach 83k. At the moment, in my view, Bitcoin is already preparing for this move down.
However, for now my main target is 86k — I think BTC currently has enough momentum only to drop to that level. Before we see 83k, it will likely need to build more energy.
So after hitting 86k, I expect a correction — probably a prolonged one. But let’s see what the market gives us.
🎯For now, my target remains 86k.
❌Invalidation zone: 96,600
⚠️Disclaimer:
This is not financial advice. Please make your own decisions according to your own trading rules, and never trade without stop-losses.
🗯️If you find my ideas helpful, please leave a reaction and write a comment — your support really matters to me
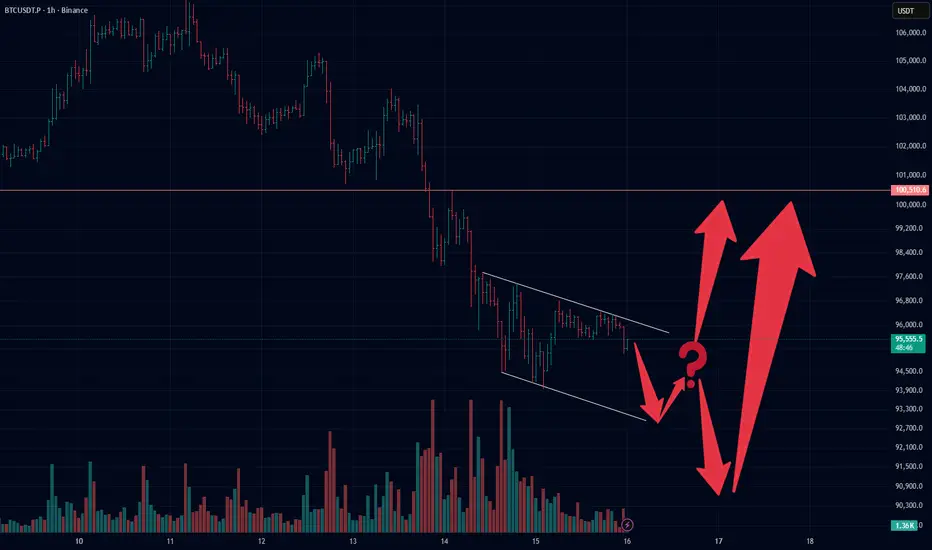
Price is sliding inside a clean descending channel. Each attemptPrice is sliding inside a clean descending channel. Each attempt to break above the upper boundary has been rejected, and the structure still prints lower highs. As long as price remains inside this channel, the market keeps its corrective tone.
A decisive break below the mid-section of the structure may trigger one more push toward the lower boundary of the channel. On the other hand, a clear breakout above the upper trendline would invalidate the local pressure and open space for a fast upside continuation.
The chart is at a decision point: either a final sweep toward the lower band before a reversal, or a direct breakout. Confirmation will come only after price leaves the channel with impulsive volume.
BTC Trade Plan 17/11/2025Dear Traders,
👉 **“The crypto market is currently under heavy selling pressure. We have several resistance zones: the first one is the psychological level at 100,000, the second is 103,000, and the third is 110,000. The price will at least reach the first two zones, and considering the large amount of liquidity in the 92–94 area, we can expect a pullback toward those upper zones.”**
Regards,
Alireza!

BTC At the Edge of Breakdown or Reversal?!!!Bitcoin has once again tapped the lower boundary of the descending channel, creating a clean liquidity sweep inside a major demand zone. This area has repeatedly triggered strong bullish reactions, and the current price action shows early signs of another potential rebound.
As long as BTC holds above the channel low, a corrective move toward 98K → 102K → 105K remains on the table.
However, the broader structure is still bearish until a confirmed breakout above the red trendline and the upper channel levels is achieved.
Key Levels:
• Support: Channel Low + Demand Zone
• Resistance: Red Trendline, 98K, 102K, 105K
• Bias: Short-Term Bullish Correction, Mid-Term Bearish Structure
📌 Clear invalidation occurs if price breaks down below the channel with a strong close.
Bitcoin bottom in soon? support at $94,000Bitcoin has corrected into the daily support at $94,000, a region backed by strong confluence including the 0.618 Fibonacci retracement. Price is showing early signs of stabilisation, but bulls still need to defend this level cleanly.
If $94,000 continues to hold, the market can rotate back toward the $100,000 resistance, which remains the major barrier for bullish continuation. Losing this support would shift the structure toward a deeper corrective phase.
Key Points:
- Daily support at $94,000 with 0.618 Fib confluence
- Potential bounce into $100,000 resistance
- Holding $94K is essential to avoid deeper downside
What to Expect:
A short-term bounce is likely as long as $94K holds, but a reclaim of $100K is required for bullish continuation.
