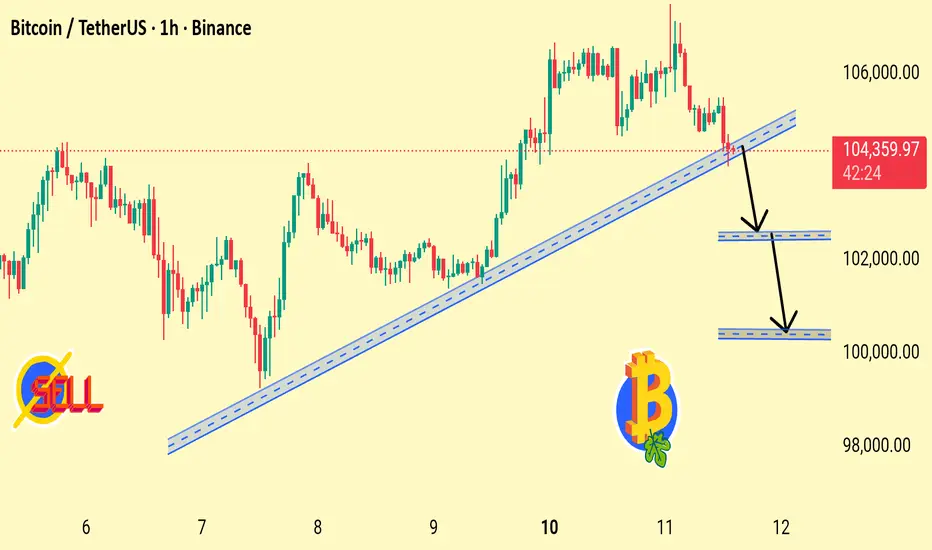
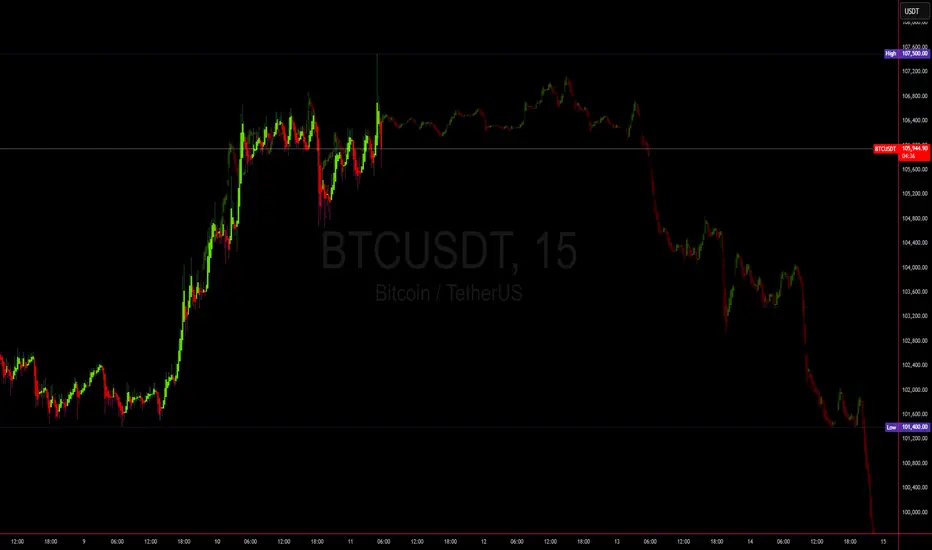
Bitcoin Losing Trendline Support Possible Drop Toward Key DemandBTC has broken below the rising trendline, signaling weakening bullish momentum. Price may retest $102,500 and potentially dip toward the $100,000 support zone if sellers continue to dominate.
1. Trendline Break Detected
BTC has fallen below the rising trendline that supported the uptrend from Nov 7–11. This signals weakening bullish structure.
2. Momentum Turning Bearish
The rejection near 105,000 and sharp drop indicate sellers are stepping in aggressively.
3. First Support Zone: $102,500
Chart shows the first demand zone here. If BTC stabilizes above this level, a bounce is possible — but weakness still remains.
4. Second Support Zone: $100,000
A deeper drop could test the psychological round number. Strong liquidity is expected at this level.
5. Trend Structure Changing
Breaking the trendline + lower highs = possible shift from bullish to short-term bearish trend.
Trade ideas
BTC/USDT Analysis. A New Support Point
Hello everyone! This is CryptoRobotics trader-analyst, and here’s your daily market update.
Yesterday, Bitcoin reached the previously marked selling zone at $105,800–$107,400.
Buyers initially dominated, but after failing to form a new local high, selling pressure resumed, leading to an expected correction.
At the moment, BTC is testing the lower boundary of the local range that formed within the resistance zone.
Below, we can see a strong imbalance toward selling around ~$104,500. The delta remains highly negative, indicating strong seller pressure that hasn’t yet produced a decisive result.
It’s important to wait for confirmation and a price consolidation.
If BTC returns to the range and consolidates above the anomalous volume area near ~$104,500, the potential upside target will be around $110,000.
However, if the price breaks and consolidates lower, the ~$103,300 support might fail, opening the way for a deeper decline.
Buy zones:
~$103,300 (local support)
$102,000–$100,000 (volume anomalies)
$97,000–$93,000 (volume cluster)
Sell zones:
$105,800–$106,600 (local resistance)
$109,500–$110,700 (accumulated volumes)
$112,400–$113,300 (accumulated volumes)
$114,700–$115,700 (accumulated volumes)
$120,900–$124,000 (high-volume area)
This publication is not financial advice.

CVD / price divergergenceBTC shows a clear CVD vs. price divergence on the low timeframes — price is rising while CVD trends lower.
This suggests weakening buy pressure and could precede a short-term breakdown if momentum shifts.

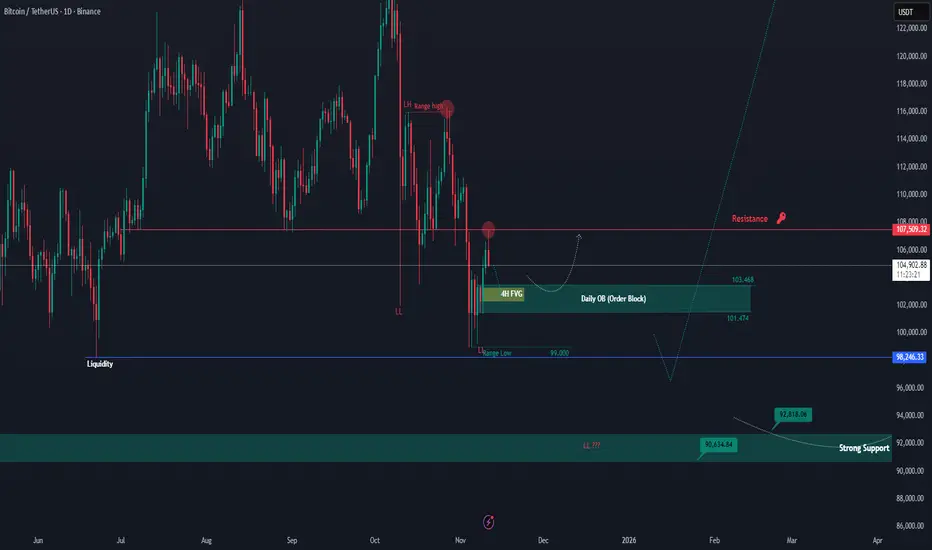
BTCUSDT – Retesting Key Levels After Resistance RejectionAs expected, BTC successfully closed above the $100K mark on the daily timeframe and moved up to retest the major resistance zone around $107,500. However, the price faced a clear rejection from this level, confirming that it remains a strong resistance area which Bitcoin must break to resume its upward momentum toward $110K–$112K.
Currently, BTC is showing signs of a potential pullback toward the Daily Order Block (OB) area near $103K–$101K. This zone will be crucial to watch — if the price reacts positively and rebounds, it could signal another push to retest the $107K resistance. On the other hand, a breakdown below this OB may open the door for a deeper retracement toward the $100K zone or even lower, possibly targeting the liquidity around $98K.
For now, BTC remains in a short-term corrective phase within a larger bullish structure. The reaction from the Daily OB zone will likely determine the next major move.
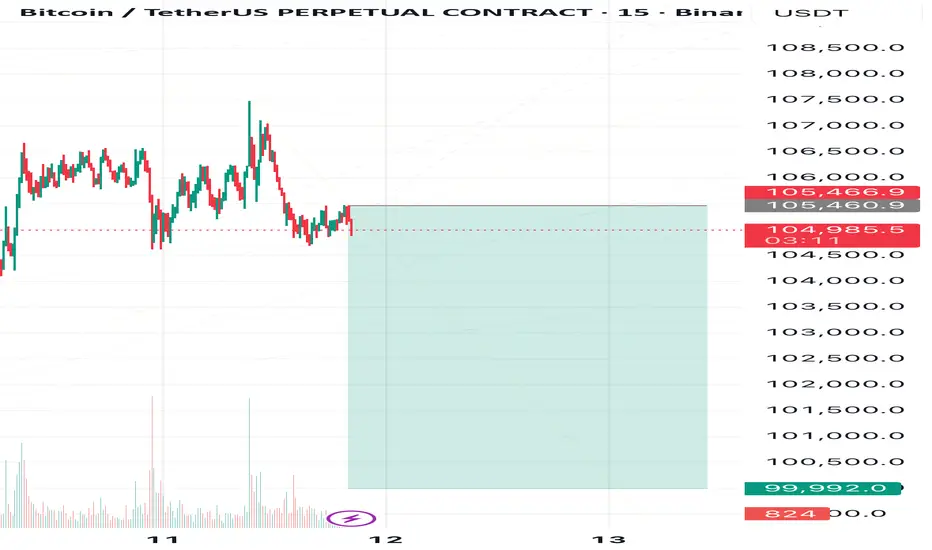
Bitcoin’s Slide to the 100K SideI expect Bitcoin to decline toward 99,999🎯
❌Invalidation Zone: above 105,565.
⚠️This is not a signal — make your own decisions and always trade with stop-losses!)
What’s your view on this setup?
💭Share your thoughts in the comments and follow to stay tuned for what’s next!
Bitcoin - is at cross road Bitcoin - is at cross road
price is at Key reistance pVAL which is a powerful area for a short but we need clear bull trap to trade it
that's why my short scenario possible in a cae of bull trap
Bullish plan - long in a case of squeezing up

CRYPTOCHECK Throwback - BEST POSTS 2025New Year loading 🥳🥂
Setting up your trading technique and sticking to it
The Dunning Kruger Effect
How to trade Bollinger Bands
How to Dollar-Cost-Average
Spotting reliable Bottom Patterns
These ideas may help you improve your strategy and become a more profitable trader. Happy Trading!

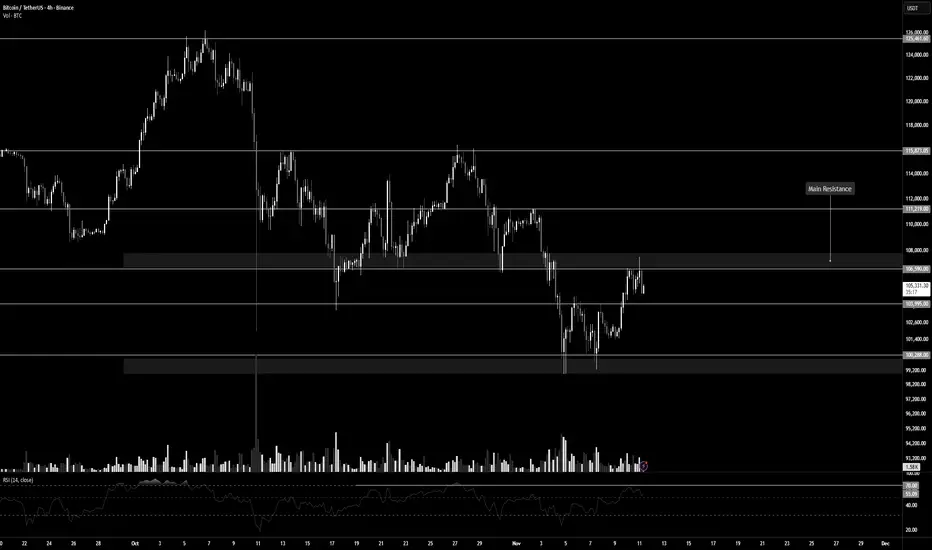
Bitcoin and a Critical Resistance for a Price Breakout | Day 3👋🏻 Hey everyone! Hope you’re doing great! Welcome to the SatoshiFrame channel.
✨ Today we’re diving into the 4-Hour Bitcoin analysis — stay tuned and follow along!
🪙 Bitcoin, in its 4-hour timeframe (as mentioned in previous analyses), is currently sitting below a major resistance level. A breakout above this area could trigger a strong bullish leg, potentially driving price toward forming a new ATH. The key resistance zone is around $106,590, and breaking it could lead to some beautiful market moves.
📊 The buying volume at this resistance is not yet sufficient. If we look closely, since the last touch of the maker-buyer zone at the lower part of the chart, volume has been declining. To break through this resistance, whale candles are needed to absorb all sell orders in the zone — this could lead to a short squeeze.
🧮 The RSI oscillator on the 4-hour timeframe has fluctuated several times below the 70 level, showing two rejections near that area. The 70 RSI level aligns with the $106,590 price resistance, and crossing above it could trigger a strong upward move.
✍️ You can read the possible scenarios for Bitcoin in the rest of the analysis, but since Bitcoin has shown reduced buying volume, it’s best to lower your risk exposure. If the breakout happens, you can reallocate remaining risk toward the next resistance levels.
✅ Long Position Scenario:
A confirmed breakout above $106,590, along with increased buying volume and the RSI surpassing 70, could form a solid long setup on the 4-hour timeframe. Make sure to gather proper confirmations before entering to ensure the best possible trade setup.
❤️ Disclaimer: This analysis is purely based on my personal opinion, and I only take trades when the stated triggers are activated.
Asia Range Downtrend ContinuationAfter consolidating all of Monday we have a fake out break out up to open Hong Kong which created the upper limit of our Tuesday Asia range. The downtrend continued to hold the Asia downtrend perfectly and we are now looking to London to see what happens.
There is the possibility that we get a continuation back up, in which we would like to see this level hold and some sort of W formation created.
More likely with this Asia range pattern we will see a retracement and and failure in London/NY Open at the bottom of the Asia range or either the MA or the VWAP.

BTCUSDT.P - November 11, 2025BTCUSDT.P is showing potential for a short-term bearish continuation after breaking below the ascending trendline support near $105,300. The pair has lost upward momentum, indicating potential downside movement toward the $103,530 partial profit zone and the $102,039 profit level. A stop level is positioned around $107,473–$107,714, marking the invalidation area for this bearish setup.
Risk Assessment: Moderate — The breakdown from trendline support favors further downside, but a sustained recovery above $105,600–$106,000 could signal a failed breakdown and shift sentiment back toward bullish consolidation.

Is having a stop loss on Bitcoin embarrassing?Is having a stop loss in the crypto market embarrassing? This isn't just a question—it's a new trading style that's become trendy and has pulled the culture of young crypto traders right into its orbit... a culture without responsibility that wants to escape reality and market principles, chasing higher profits and loftier positions. A culture where 5% monthly profit is laughable to them, and they won't settle for anything less than 50% to 100% gains.
Let's see what happens to this minority in just the past few weeks with this ideology: On October 10, a 16% drop (they get liquidated and wiped out of the market). On September 22, with that long squeeze candle, a 4.30% drop (wiped out for the second time). On November 3 and 4, a 10% drop (wiped out for the third time :))
That said, a huge crowd usually floods the market right before accumulation phases or trend changes (when big investors need liquidity), and after supplying that liquidity, they get wiped out too... I haven't found a precise indicator yet for when these folks show up—if you've got one, comment below; maybe I'll write a script for it myself. But the point is, after these people get liquidated, we usually enter an accumulation phase, followed by a trend reversal. Long squeeze and short squeeze candles are great examples for spotting these crowds, and then you can expect ranging, followed by the trend change.
In the 4H timeframe, we've relatively shifted the range—hopefully forming a higher high and higher low above 104,862.71 . A break of 106,542.82 in the 4H timeframe could be our first trigger for a trend change in this leg. But the main trigger is breaking the resistance at 111,287.45, since this resistance is what triggered the reaction that formed the lower low at 100,503.60—so it's hugely important, and breaking it would put Bitcoin back into uptrend mode.
+ The probability of the US government shutdown ending has hit 84% on Polymarket. Actually, that's what drove the growth in recent days... You might think it's weird—like, shouldn't we grow after good news? I say no, the market moves based on expectations, not news or anything else... Does the expectation say the US government will reopen? Okay, let's grow—that's it.
+ A super important point: Trump officially announced that every American (except high earners) will get $2,000. Something like those stimulus checks during COVID in 2020! Remember that?
And what I'm saying here impacts daily and weekly timeframes, not 4H... So if you're trading in lower timeframes, no need to pay attention to this stuff—per your strategy, if it signals long, open long; if we dump from here and go below 104k, hunt for shorts :) Easy.
If you like these multi-faceted, educational analyses, definitely follow—it's crazy we're still under 1,000. We need a bigger community to pull off even bigger things. Thanks for your attention—till next time, peace out.


Bitcoin : Stay heavy on positionsBitcoin : Stay heavy on positions (3x)
A signal for catching a bounce has emerged.
Within 1–2 weeks after the bounce signal, leverage is reduced from 3x to 2x.
** This analysis is based solely on the quantification of crowd psychology.
It does not incorporate price action, trading volume, or macroeconomic indicators.

Bitcoin — The Market of Repeated Patterns🌀 Bitcoin — The Market of Repeated Patterns
As I’ve shown in previous posts, Bitcoin constantly repeats its past patterns.
Right now, the same structure we saw two weeks ago has been perfectly rebuilt, and the price is moving almost identically along it.
There’s a high probability that the next move will follow the same path again.
In the crypto market, patterns aren’t just signals — they’re experiences that keep repeating.
Reversal back to form Head and Shoulder After a massive downward trend, the market needs to reverse back to fill up the FVG.
There was a Double Buttom pattern initially from the first sight then the market retest the entry point to fill up another small FVG then up it goes to the nearest resistance.
According to the pattern and the previous OB, the market is meant to go up to the second resistance which is the max probability TP. “Note; there’s uniqueness of market which means historical charts don’t predict present market conditions”

BTC/USDT: Lower Highs Hold as Price Stalls Below 109K ResistBTC/USDT fulfilled the prior move and is now struggling below the 109,000 resistance after rebounding from 99,000. Price remains in a descending channel, approaching a key confluence zone near 109,200 where upward and downward trendlines intersect.
If this level holds, a decline toward 102,250 support remains likely. The bearish bias stays intact as long as the lower high structure persists.
❗️ Risks:
– Break above 109,800 may trigger short covering.
– Dovish Fed or soft inflation data could lift sentiment.
– ETF inflows may drive renewed spot demand.

Bitcoin Below a Key Resistance – Day 2👋🏻 Hey everyone! Hope you’re doing great! Welcome to SatoshiFrame channel.
✨ Today we’re diving into the 1-Hour BITCOIN analysis. Stay tuned and follow along!
🪙 On the 1-hour timeframe, Bitcoin is currently ranging below its key resistance zone at $106,590 in a multi-timeframe structure. A confirmed breakout above this level could potentially lead to further bullish momentum toward the next resistance area.
📊 Looking at Bitcoin’s volume, we can see that as price reached this crucial resistance, volume has decreased, showing more selling interest among traders. However, the interesting observation here is that even selling volume itself has slightly declined, and during the latest reaction to this resistance (in the 15-minute multi-timeframe), we witnessed an increase in buying volume.
✍️ The possible breakout scenario for this resistance is quite simple and comes with a small stop-loss range. You can consider entering a trade based on this scenario, but always remember proper risk and capital management.
↗️ Long Position Scenario 1 : Breakout above the $106,590 resistance accompanied by increasing buying volume on either the 1-hour or 15-minute multi-timeframe. If we get a candle setup (Indecision + SMA7) before and after the breakout, it can serve as a valid entry signal.
↗️ Long Position Scenario 2 : Breakout above the $106,590 resistance with rising volume and the formation of a higher low on the multi-timeframe compared to the previous low. In this case, we can enter a long position and set the stop-loss below the potential higher low.
❤️ Disclaimer : This analysis is purely based on my personal opinion and I only trade if the stated triggers are activated .

bullish hitter vwap sma Y openyearly vwap, weekly 50sma, yearly candle
looking to see if this triple banger holds the bullish Q4 continuation
50 weekly sma have been pumpish every touch this bullrun
above yearly vwap showing buyers still in control

Crucial level for $BTCFor CRYPTOCAP:BTC I'm watching this $108,000-109,000 level for a reaction
Very bullish if the weekly reclaims and closes above, however we are very early in the week to talk about this scenario

#BTC Time to Buy ?!I believe We could have another downside move , and then we can have a buy position on it as Scalp . for 6-15%
Added in watchlist .

BTC 4H MIRACLE SHOT: $117K INCOMING – FVG + ORDER BLOCK HIT!🔥 **BITCOIN JUST FILLED 4H FVG @ $106,000 – SMART MONEY LOADING**
📉 **-0.90% dip → PERFECT accumulation zone**
🧠 **4H Bullish Reversal Setup:**
- **Descending Trendline BROKEN**
- **4H Fair Value Gap (FVG)** = $105,962 – $106,000
- **OrderBlock+** = Institutional demand zone
- **Support Zone** = $103,592 – $104,000
- **Resistance** = $110,000 (next test)
- **Target:** $117,000 (ATH retest)
⚡ **Miracle Shot™ Indicator NOW PUBLIC**
👉 Search: `Miracle Shot by TradeWithMky` → Add to chart
💬 **COMMENT "BTC" → GET NEXT SIGNAL IN DM BEFORE PUBLIC**
👥 **TAG A FRIEND who missed the dip!**
📊 **2025 Backtest: 16/16 wins on BTC 4H FVG setups**
> Last hit: **$94K → $112K** in 5 days
⚠️ **Not financial advice. DYOR.**
#Bitcoin #BTCUSDT #Crypto #MiracleShot #FVG #OrderBlock #SmartMoney #TradingView
: COMMENT "BTC" → GET NEXT SIGNAL IN DM

BITCOIN 4H MIRACLE SHOT: $114K TARGET – SMART MONEY TRAP?🔥 **BTC JUST HIT 4H FVG + ORDER BLOCK @ $104,985**
📉 **+0.26% now, but whales are LOADING the dip**
🧠 **4H Setup Breakdown:**
- **Lower Low → Higher Low** = Bullish reversal pattern
- **Smart Money Magnet** = 4H Fair Value Gap ($104,458–$104,985)
- **Order Block+** = Institutional buying zone
- **Stop Loss Hunt** = $98,394 (WARNING LINE)
- **Target I:** $110,225
- **Target II:** $114,802 (All-time high retest)
⚡ **Miracle Shot™ Indicator NOW PUBLIC**
👉 Search: `Miracle Shot by TradeWithMky` → Add to chart
💬 **COMMENT "BTC" BELOW → I DM YOU THE NEXT SIGNAL BEFORE PUBLIC**
👥 **Tag a friend who’s shorting BTC!**
#Bitcoin #BTCUSDT #BTCStrategy#SmartMoney #FVG #OrderBlockBrand#MiracleShot #TradeWithMkyPlatform#TradingView #CryptoPersian#بیتکوین #کریپتو #تریدینگ_ویو #فارکس_ایرانی
📊 **Backtested 2025: 14/14 wins on BTC 4H**
> Last hit: **$92K → $108K** in 48 hours
⚠️ **Not financial advice. DYOR.**
#Bitcoin #BTCUSDT #Crypto #MiracleShot #SmartMoney #FVG #OrderBlock #TradingView

BTC/USDTthe last descent before takeoff
Raise Shields
is not an individual investment recommendation.
